Business Decision Making Report - HND Business, Module 6, Semester 2
VerifiedAdded on 2020/07/22
|17
|3797
|165
Report
AI Summary
This report analyzes business decision-making processes for a restaurant, focusing on data collection, analysis, and forecasting. It begins by outlining a plan for gathering primary and secondary data, including survey methodology and questionnaire design. The report then delves into data analysis, assessing mean, mode, median, measures of dispersion, quartiles, percentiles, and correlation coefficients to create information for decision-making. Graphical presentations and trend lines are used to forecast future trends, and a business presentation and formal report are prepared. Finally, the report discusses the use of information processing tools, critical success factors, and investment appraisal tools in the decision-making process, providing a comprehensive overview of the strategies and tools used to make informed business decisions.
Business Decision Making
Paraphrase This Document
Need a fresh take? Get an instant paraphrase of this document with our AI Paraphraser
Table of Contents
INTRODUCTION......................................................................................................................1
1.1 Stating plan for the collection of primary and secondary data set...................................1
1.2 Designing survey methodology and sampling frame.......................................................2
1.3 Framing questionnaire for survey and the collection of primary data set........................2
2.1 Creating information for decision making.......................................................................4
2.2 Assessing mean, mode and median from secondary data set...........................................6
2.3 Analyzing data set through using measures of dispersion...............................................7
2.4 Quartile, percentile and correlation co-efficient..............................................................7
TASK 2......................................................................................................................................8
3.1 Graphical presentation.....................................................................................................8
3.2 Creating trend line for forecasting future trends..............................................................9
3.3 Preparing business presentation.....................................................................................10
3.4 Formal business report...................................................................................................10
TASK 3....................................................................................................................................11
4.1 Stating the use of information processing tools in the decision making aspects...........11
4.2 Determination of critical on the basis of business plan..................................................11
..............................................................................................................................................12
4.3 Use of investment appraisal tools in evaluating the viability of proposal.....................12
CONCLUSION........................................................................................................................14
REFERENCES.........................................................................................................................15
INTRODUCTION
In the present era, from expansion to new establishment business entity has to take
strategic decisions for attaining success in the competitive environment. Hence, for effective
decision making it is highly required for the business entity to consider both monetary and
non-monetary criteria’s. Considering the success of existing restaurant unit and tourism trend
in UK owner of Murano is planning to establish another unit. In this regard, for ensuring high
level of growth and success business entity will lay emphasis on organizing research with the
motive to assess the expectation level of customers. Hence, present report will provide deeper
insight about the results of primary and secondary data set. It also entails the extent to which
to sales and profit margin of such restaurant will incline in the near future. Further, such
assessment helps in understanding about the manner in which statistical and financial tools
aid in decision making.
TASK 1
1.1 Stating plan for the collection of primary and secondary data set
For assessing or getting information about the customers preferences regarding
dinning services of Murano researcher data has taken decision in relation to gathering data
from both primary and secondary sources. Hence, plan for data collection is as follows:
Primary data collection plan
In the first step, out of several methods such as observation, focus group, interview
etc, survey method is selected by the researcher.
Once primary data collection method has selected thereafter for conducting survey in
the best possible way researcher will select sample. For instance: Through the means
of random sampling 25 respondents have been selected on which study will be
focused.
Under third step, scholar will prepare questionnaire by including question regarding
menu preferences, pricing and promotional aspects etc.
Hence, in the last stage by sending questionnaire to the customers or potential
respondents on their mail id primary data will be gathered by the scholar.
Secondary data collection plan: For the collection of secondary data, books, journals as
well as scholarly articles related to restaurant trend will be evaluated by the researcher
⊘ This is a preview!⊘
Do you want full access?
Subscribe today to unlock all pages.
Trusted by 1+ million students worldwide
through the means of internet. This in turn provides information about market trend and
analyzing information gathered via survey in an appropriate manner (Drucker, 2017). Along
with this, financial data regarding sales and profit will also be evaluated by the researcher for
effective decision making.
1.2 Designing survey methodology and sampling frame
Survey methodology: It refers to the process that is undertaken by the researcher for
carry out survey in the best possible way. Survey methodology helps in conducting
investigation in a structured way and presenting suitable solution of the concerned
issue (Wheelen and Hunger, 2017). In this, to analyze the preference of customers and
for the collection of primary data set on time online survey methodology has been
chosen by the researcher. In accordance with such aspect primarily, mail id of
customers will be acquired by the researcher. Thereafter, by sending questionnaire on
the mail-id of customers survey will be conducted by the researcher. In this, by
requesting respondents in relation to filling questionnaire primary data will be
gathered,
Sampling frame: There are mainly two types of sampling techniques such as
probabilistic and non-probabilistic that can be used by the researcher to determine
appropriate sample (Beach and Lipshitz, 2017). In this, by using simple random
sampling technique 25 respondents have been selected by the researcher. Such
technique is the part of probabilistic mode which in turn completely avoids the level
of biasness and assists in doing investigation in an accurate manner.
1.3 Framing questionnaire for survey and the collection of primary data set
In order to get suitable information for decision making through the means of survey
questionnaire has designed by the scholar. Thus, to evaluate preferences of customers
regarding product, price, place and promotion both open as well as close ended questions
were included by the researcher in questionnaire.
Questionnaire
Demographic information
Name....
Age....
Occupation....
Paraphrase This Document
Need a fresh take? Get an instant paraphrase of this document with our AI Paraphraser
Q.1 How often do you visit the restaurant of Murano?
Once in a week ()
Two times in a week ()
Once in a month ()
Other (Kindly specify)
Q.2 According to you, dinning services of Murano comes under which one of the following
category?
Poor ()
Average ()
Good ()
Better ()
Best ()
Q.3 Are you satisfied with the staff services of Murano?
Satisfied ()
Highly satisfied ()
Neutral ()
Dissatisfied ()\
Highly dissatisfied ()
Q.4 At the time of selecting restaurant which criteria is most preferred by you?
Restaurant concept ()
Food quality ()
Service ()
Price ()
Convenience ()
Ambiance ()
Q.5 Which kind of restaurant style is preferred by you?
Homey ()
Modern ()
Traditional ()
Mixed style ()
Q.6 On what time, do you like to visit restaurant?
Breakfast (9am to 11am)
Lunch time (12pm to 5 pm)
Dinner(8pm to 12 pm)
Q.7 Do you agree that services of Murano give high value for money?
Agree ()
Strongly agree ()
Neither agree nor disagree ()
Disagree ()
Strongly disagree ()
Q.8 Which kind of promotional mode has high influence on your decision making?
Newspaper ()
Television ()
Newspaper and television both ()
Social media ()
Q.9 In the near future, do you recommend restaurant services to your friends and family
members?
Yes ()
No ()
Q.10 Which location do you like to consider while making selection of restaurant.........Kindly
specify
Q.11 Do you want to give any recommendation for the purpose of improvement ........Please
specify with the reasons
2.1 Creating information for decision making
Primary data assessment
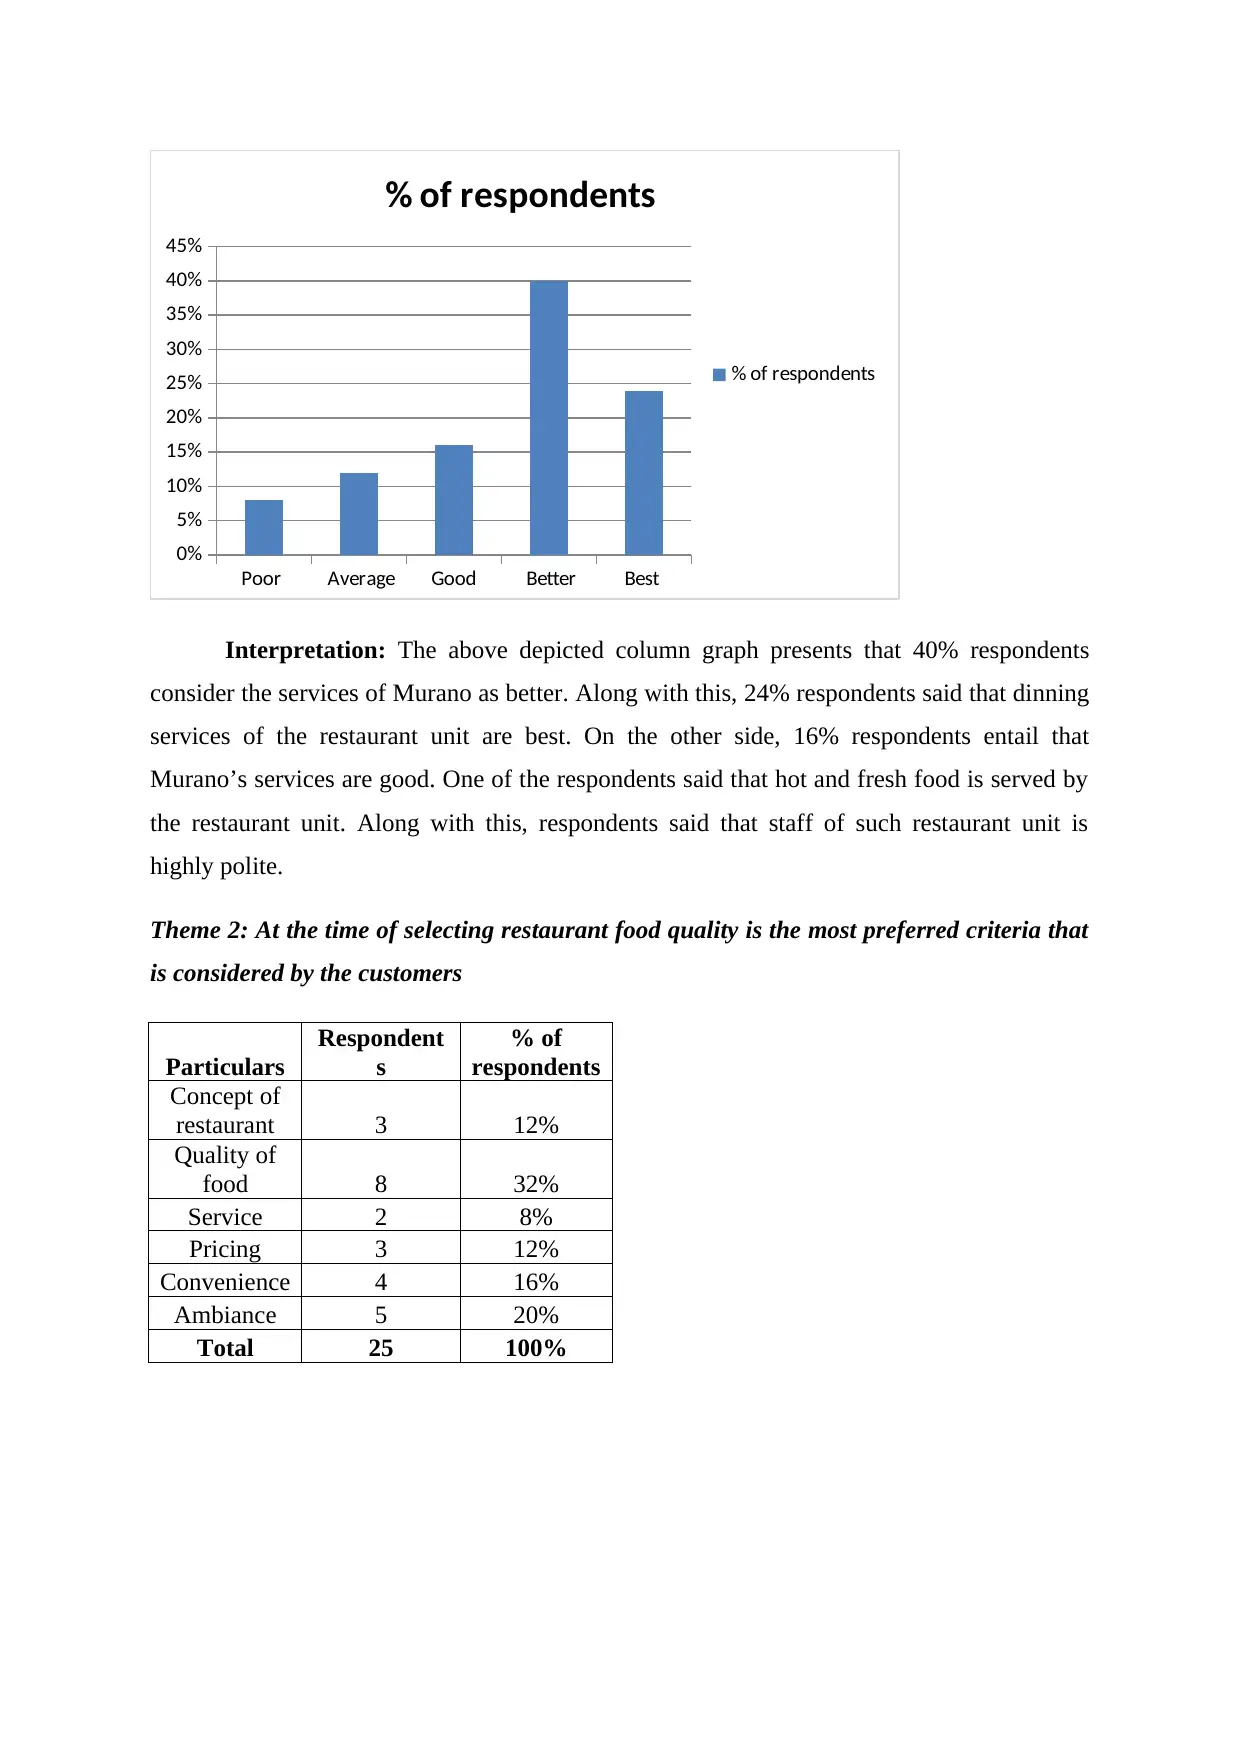
Theme 1: Dinning services of Murano comes under which one of the following category
Particul
ars
Responde
nts
% of
responde
nts
Poor 2 8%
Average 3 12%
Good 4 16%
Better 10 40%
Best 6 24%
Total 25 100%
Agree ()
Strongly agree ()
Neither agree nor disagree ()
Disagree ()
Strongly disagree ()
Q.8 Which kind of promotional mode has high influence on your decision making?
Newspaper ()
Television ()
Newspaper and television both ()
Social media ()
Q.9 In the near future, do you recommend restaurant services to your friends and family
members?
Yes ()
No ()
Q.10 Which location do you like to consider while making selection of restaurant.........Kindly
specify
Q.11 Do you want to give any recommendation for the purpose of improvement ........Please
specify with the reasons
2.1 Creating information for decision making
Primary data assessment
Theme 1: Dinning services of Murano comes under which one of the following category
Particul
ars
Responde
nts
% of
responde
nts
Poor 2 8%
Average 3 12%
Good 4 16%
Better 10 40%
Best 6 24%
Total 25 100%
⊘ This is a preview!⊘
Do you want full access?
Subscribe today to unlock all pages.
Trusted by 1+ million students worldwide
Poor Average Good Better Best
0%
5%
10%
15%
20%
25%
30%
35%
40%
45%
% of respondents
% of respondents
Interpretation: The above depicted column graph presents that 40% respondents
consider the services of Murano as better. Along with this, 24% respondents said that dinning
services of the restaurant unit are best. On the other side, 16% respondents entail that
Murano’s services are good. One of the respondents said that hot and fresh food is served by
the restaurant unit. Along with this, respondents said that staff of such restaurant unit is
highly polite.
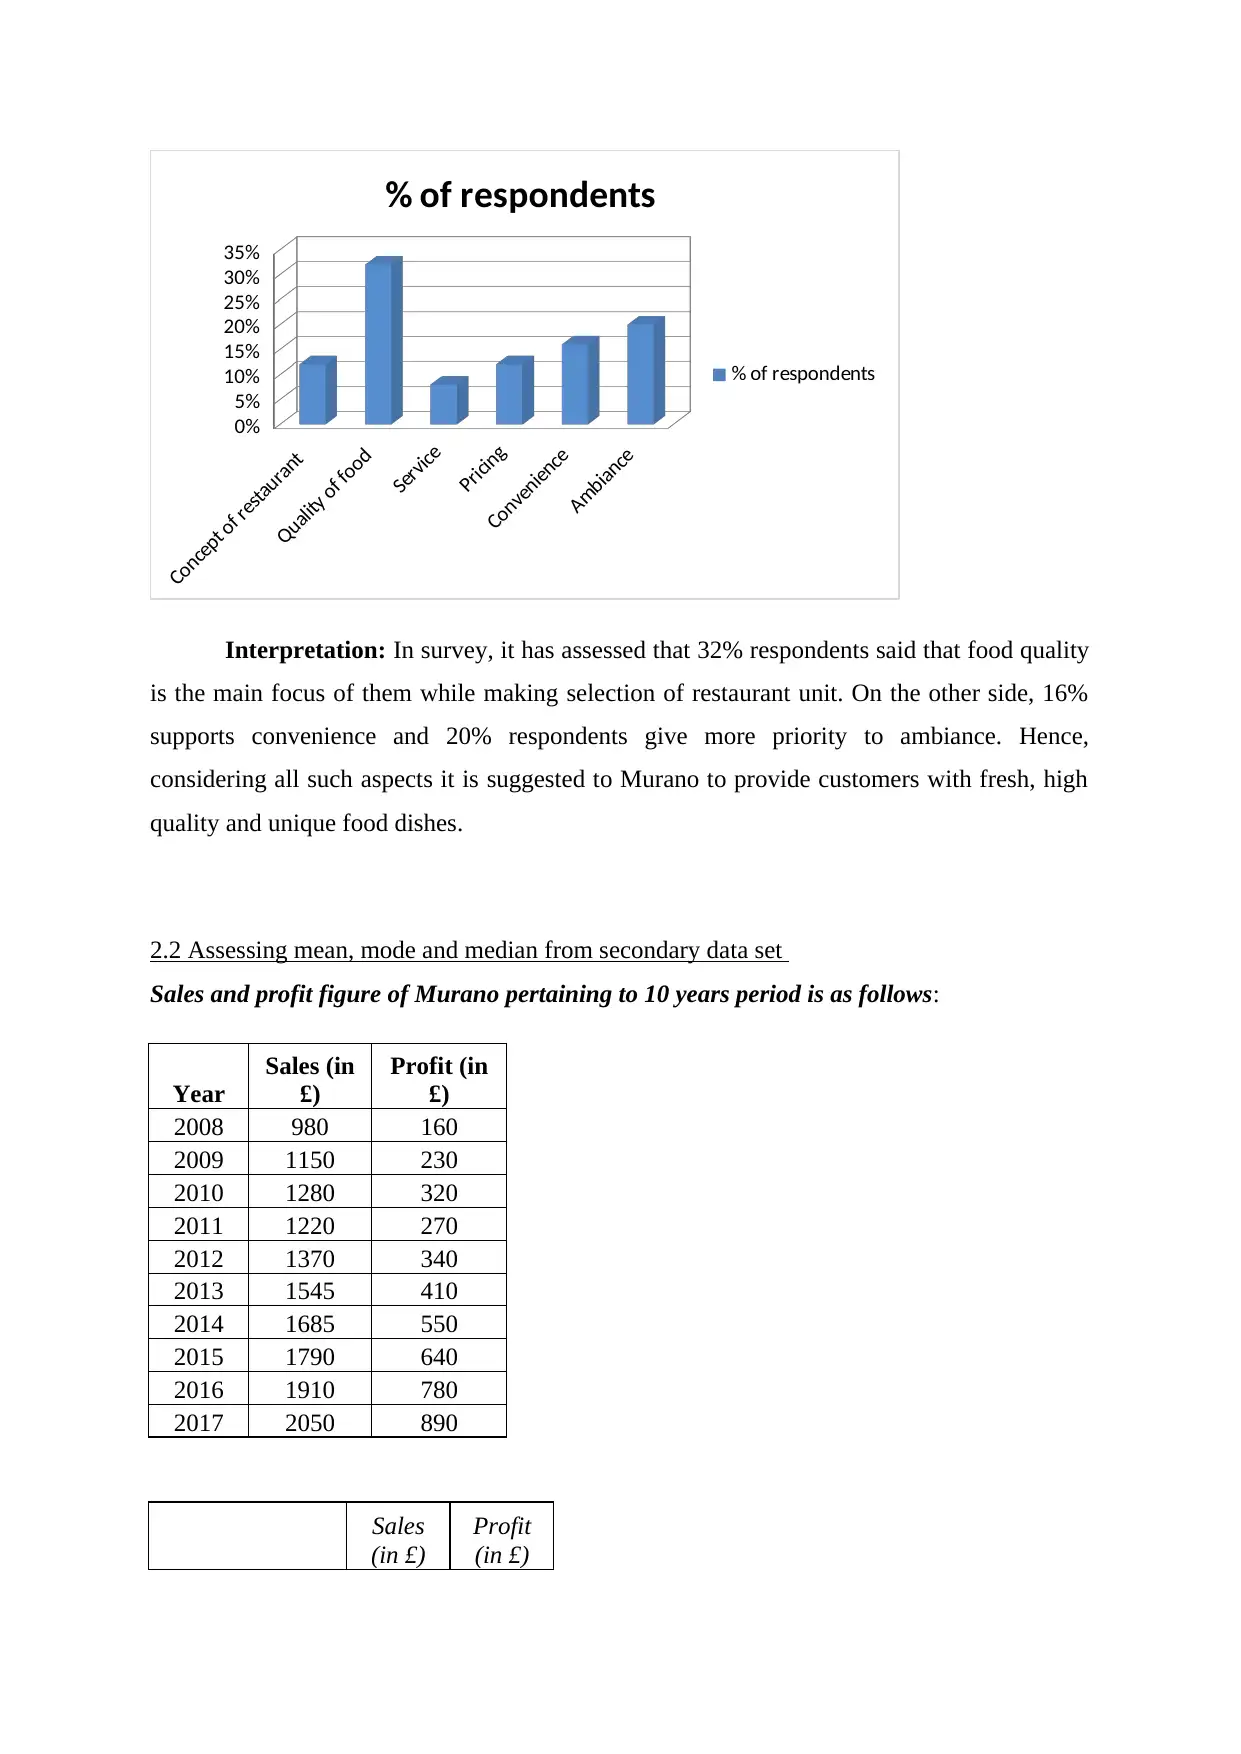
Theme 2: At the time of selecting restaurant food quality is the most preferred criteria that
is considered by the customers
Particulars
Respondent
s
% of
respondents
Concept of
restaurant 3 12%
Quality of
food 8 32%
Service 2 8%
Pricing 3 12%
Convenience 4 16%
Ambiance 5 20%
Total 25 100%
0%
5%
10%
15%
20%
25%
30%
35%
40%
45%
% of respondents
% of respondents
Interpretation: The above depicted column graph presents that 40% respondents
consider the services of Murano as better. Along with this, 24% respondents said that dinning
services of the restaurant unit are best. On the other side, 16% respondents entail that
Murano’s services are good. One of the respondents said that hot and fresh food is served by
the restaurant unit. Along with this, respondents said that staff of such restaurant unit is
highly polite.
Theme 2: At the time of selecting restaurant food quality is the most preferred criteria that
is considered by the customers
Particulars
Respondent
s
% of
respondents
Concept of
restaurant 3 12%
Quality of
food 8 32%
Service 2 8%
Pricing 3 12%
Convenience 4 16%
Ambiance 5 20%
Total 25 100%
Paraphrase This Document
Need a fresh take? Get an instant paraphrase of this document with our AI Paraphraser
Concept of restaurant
Quality of food
Service
Pricing
Convenience
Ambiance
0%
5%
10%
15%
20%
25%
30%
35%
% of respondents
% of respondents
Interpretation: In survey, it has assessed that 32% respondents said that food quality
is the main focus of them while making selection of restaurant unit. On the other side, 16%
supports convenience and 20% respondents give more priority to ambiance. Hence,
considering all such aspects it is suggested to Murano to provide customers with fresh, high
quality and unique food dishes.
2.2 Assessing mean, mode and median from secondary data set
Sales and profit figure of Murano pertaining to 10 years period is as follows:
Year
Sales (in
£)
Profit (in
£)
2008 980 160
2009 1150 230
2010 1280 320
2011 1220 270
2012 1370 340
2013 1545 410
2014 1685 550
2015 1790 640
2016 1910 780
2017 2050 890
Sales
(in £)
Profit
(in £)
Mean 1498 459
Standard Error 111.928 77.6953
Median 1457.5 375
Mode #N/A #N/A
Range 1070 730
Minimum 980 160
Maximum 2050 890
Sum 14980 4590
Count 10 10
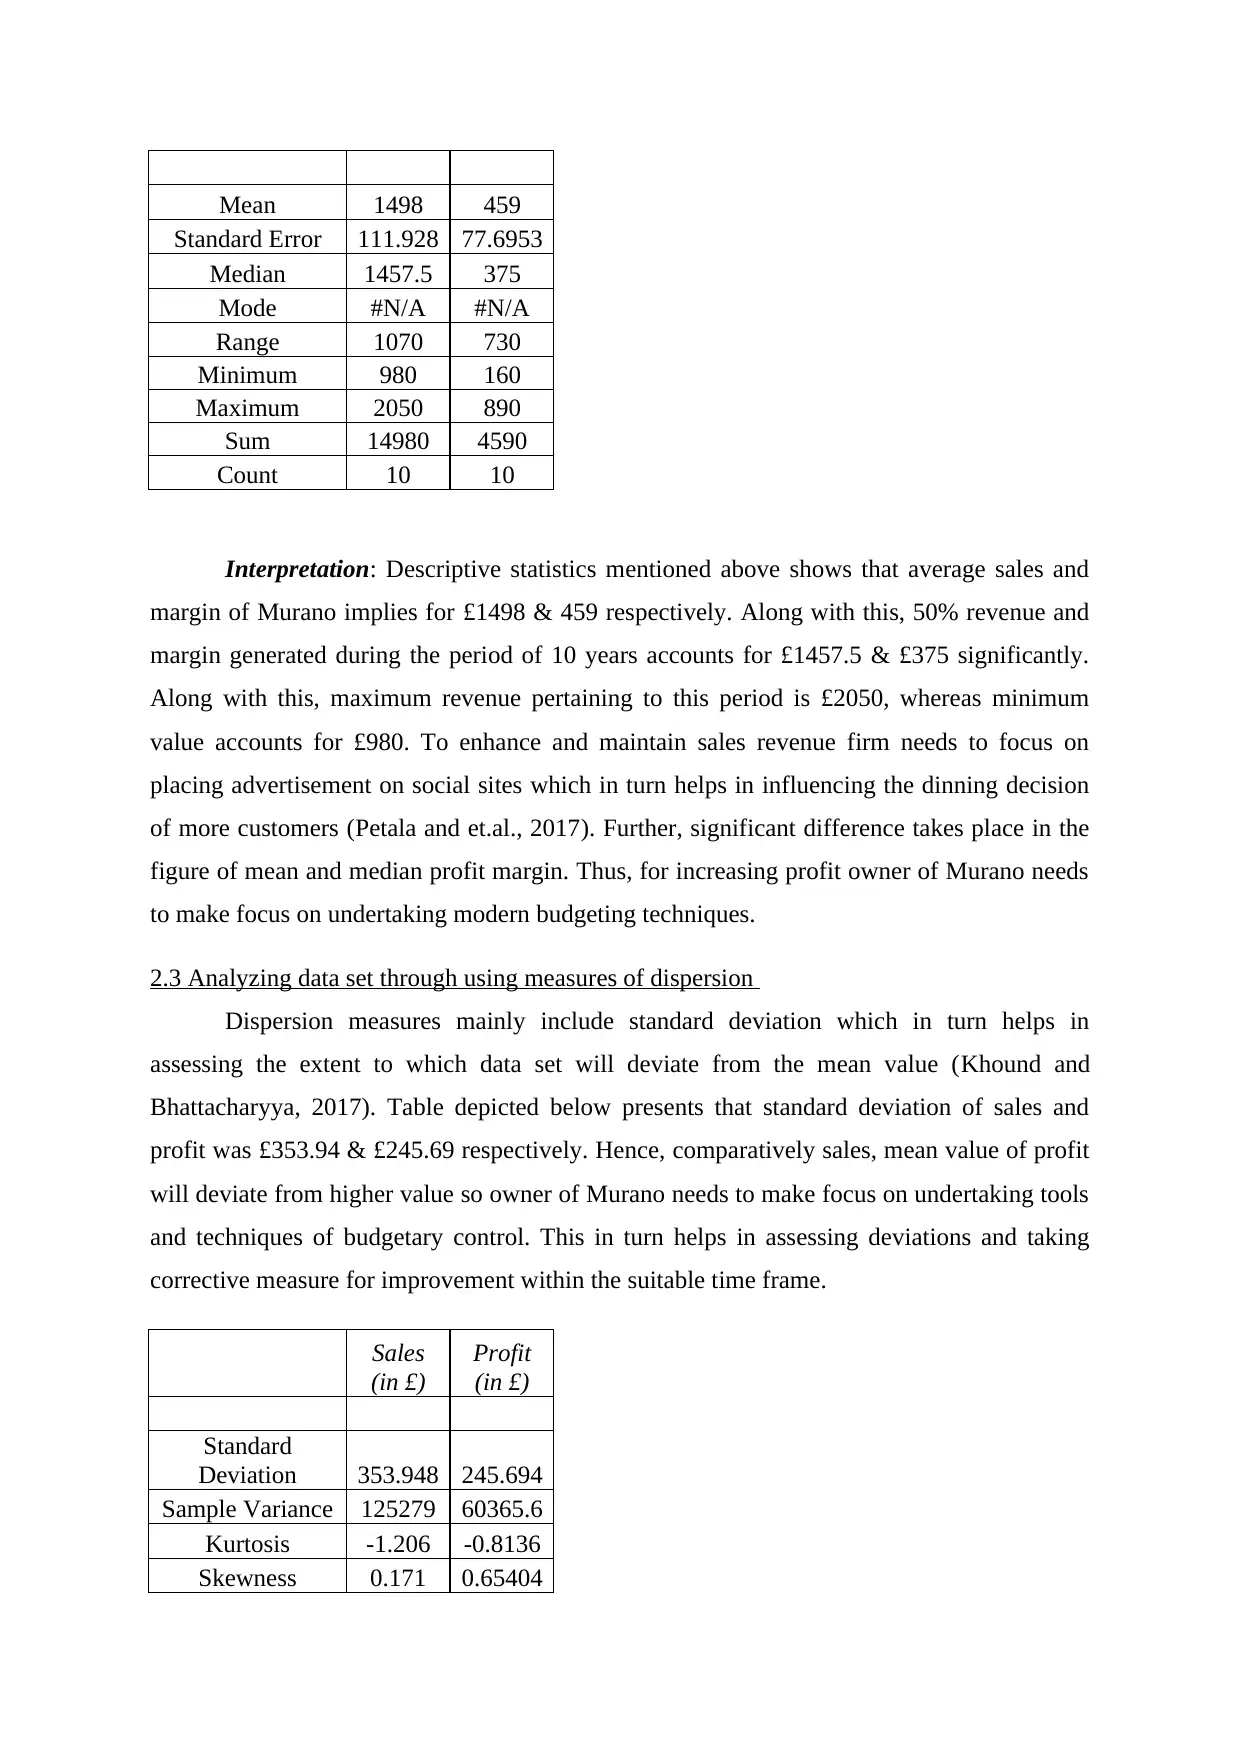
Interpretation: Descriptive statistics mentioned above shows that average sales and
margin of Murano implies for £1498 & 459 respectively. Along with this, 50% revenue and
margin generated during the period of 10 years accounts for £1457.5 & £375 significantly.
Along with this, maximum revenue pertaining to this period is £2050, whereas minimum
value accounts for £980. To enhance and maintain sales revenue firm needs to focus on
placing advertisement on social sites which in turn helps in influencing the dinning decision
of more customers (Petala and et.al., 2017). Further, significant difference takes place in the
figure of mean and median profit margin. Thus, for increasing profit owner of Murano needs
to make focus on undertaking modern budgeting techniques.
2.3 Analyzing data set through using measures of dispersion
Dispersion measures mainly include standard deviation which in turn helps in
assessing the extent to which data set will deviate from the mean value (Khound and
Bhattacharyya, 2017). Table depicted below presents that standard deviation of sales and
profit was £353.94 & £245.69 respectively. Hence, comparatively sales, mean value of profit
will deviate from higher value so owner of Murano needs to make focus on undertaking tools
and techniques of budgetary control. This in turn helps in assessing deviations and taking
corrective measure for improvement within the suitable time frame.
Sales
(in £)
Profit
(in £)
Standard
Deviation 353.948 245.694
Sample Variance 125279 60365.6
Kurtosis -1.206 -0.8136
Skewness 0.171 0.65404
Standard Error 111.928 77.6953
Median 1457.5 375
Mode #N/A #N/A
Range 1070 730
Minimum 980 160
Maximum 2050 890
Sum 14980 4590
Count 10 10
Interpretation: Descriptive statistics mentioned above shows that average sales and
margin of Murano implies for £1498 & 459 respectively. Along with this, 50% revenue and
margin generated during the period of 10 years accounts for £1457.5 & £375 significantly.
Along with this, maximum revenue pertaining to this period is £2050, whereas minimum
value accounts for £980. To enhance and maintain sales revenue firm needs to focus on
placing advertisement on social sites which in turn helps in influencing the dinning decision
of more customers (Petala and et.al., 2017). Further, significant difference takes place in the
figure of mean and median profit margin. Thus, for increasing profit owner of Murano needs
to make focus on undertaking modern budgeting techniques.
2.3 Analyzing data set through using measures of dispersion
Dispersion measures mainly include standard deviation which in turn helps in
assessing the extent to which data set will deviate from the mean value (Khound and
Bhattacharyya, 2017). Table depicted below presents that standard deviation of sales and
profit was £353.94 & £245.69 respectively. Hence, comparatively sales, mean value of profit
will deviate from higher value so owner of Murano needs to make focus on undertaking tools
and techniques of budgetary control. This in turn helps in assessing deviations and taking
corrective measure for improvement within the suitable time frame.
Sales
(in £)
Profit
(in £)
Standard
Deviation 353.948 245.694
Sample Variance 125279 60365.6
Kurtosis -1.206 -0.8136
Skewness 0.171 0.65404
⊘ This is a preview!⊘
Do you want full access?
Subscribe today to unlock all pages.
Trusted by 1+ million students worldwide
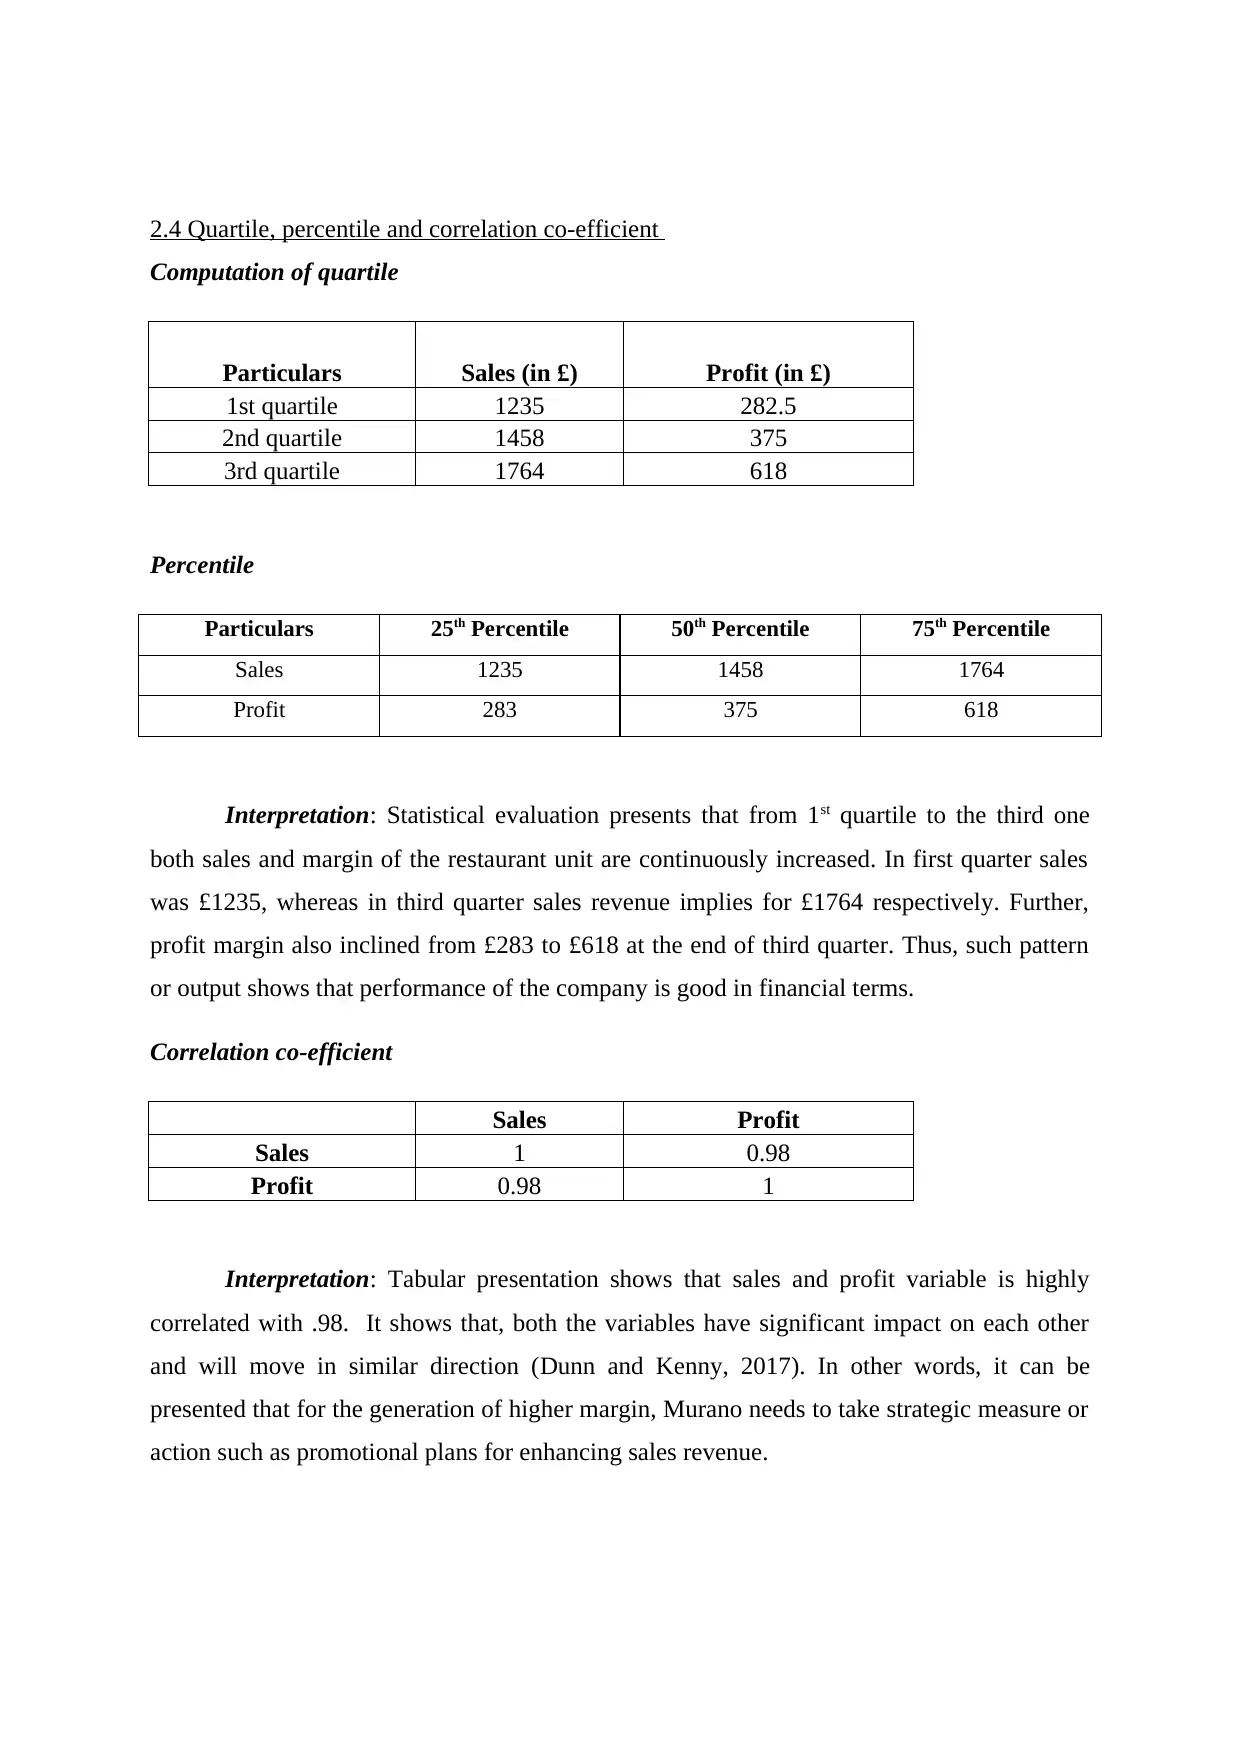
2.4 Quartile, percentile and correlation co-efficient
Computation of quartile
Particulars Sales (in £) Profit (in £)
1st quartile 1235 282.5
2nd quartile 1458 375
3rd quartile 1764 618
Percentile
Particulars 25th Percentile 50th Percentile 75th Percentile
Sales 1235 1458 1764
Profit 283 375 618
Interpretation: Statistical evaluation presents that from 1st quartile to the third one
both sales and margin of the restaurant unit are continuously increased. In first quarter sales
was £1235, whereas in third quarter sales revenue implies for £1764 respectively. Further,
profit margin also inclined from £283 to £618 at the end of third quarter. Thus, such pattern
or output shows that performance of the company is good in financial terms.
Correlation co-efficient
Sales Profit
Sales 1 0.98
Profit 0.98 1
Interpretation: Tabular presentation shows that sales and profit variable is highly
correlated with .98. It shows that, both the variables have significant impact on each other
and will move in similar direction (Dunn and Kenny, 2017). In other words, it can be
presented that for the generation of higher margin, Murano needs to take strategic measure or
action such as promotional plans for enhancing sales revenue.
Paraphrase This Document
Need a fresh take? Get an instant paraphrase of this document with our AI Paraphraser
TASK 2
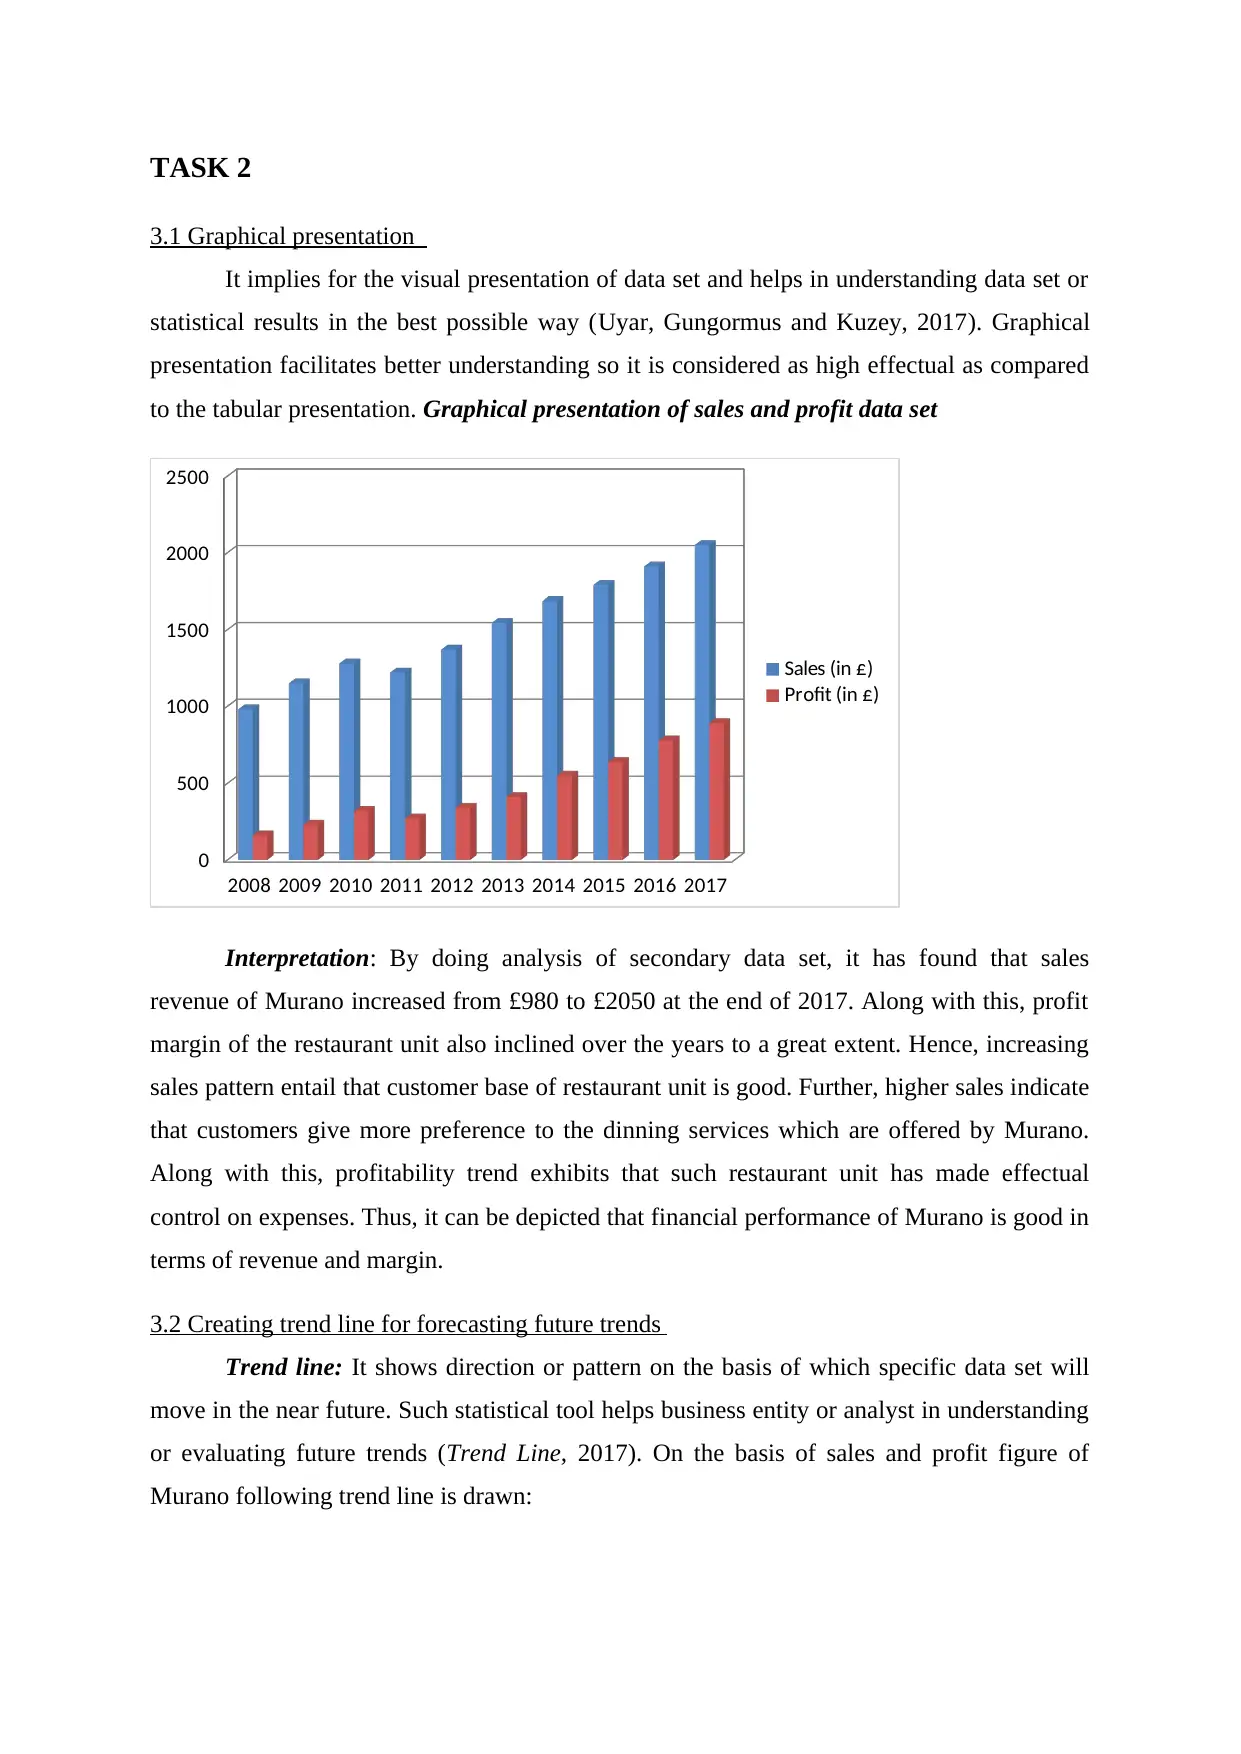
3.1 Graphical presentation
It implies for the visual presentation of data set and helps in understanding data set or
statistical results in the best possible way (Uyar, Gungormus and Kuzey, 2017). Graphical
presentation facilitates better understanding so it is considered as high effectual as compared
to the tabular presentation. Graphical presentation of sales and profit data set
2008 2009 2010 2011 2012 2013 2014 2015 2016 2017
0
500
1000
1500
2000
2500
Sales (in £)
Profit (in £)
Interpretation: By doing analysis of secondary data set, it has found that sales
revenue of Murano increased from £980 to £2050 at the end of 2017. Along with this, profit
margin of the restaurant unit also inclined over the years to a great extent. Hence, increasing
sales pattern entail that customer base of restaurant unit is good. Further, higher sales indicate
that customers give more preference to the dinning services which are offered by Murano.
Along with this, profitability trend exhibits that such restaurant unit has made effectual
control on expenses. Thus, it can be depicted that financial performance of Murano is good in
terms of revenue and margin.
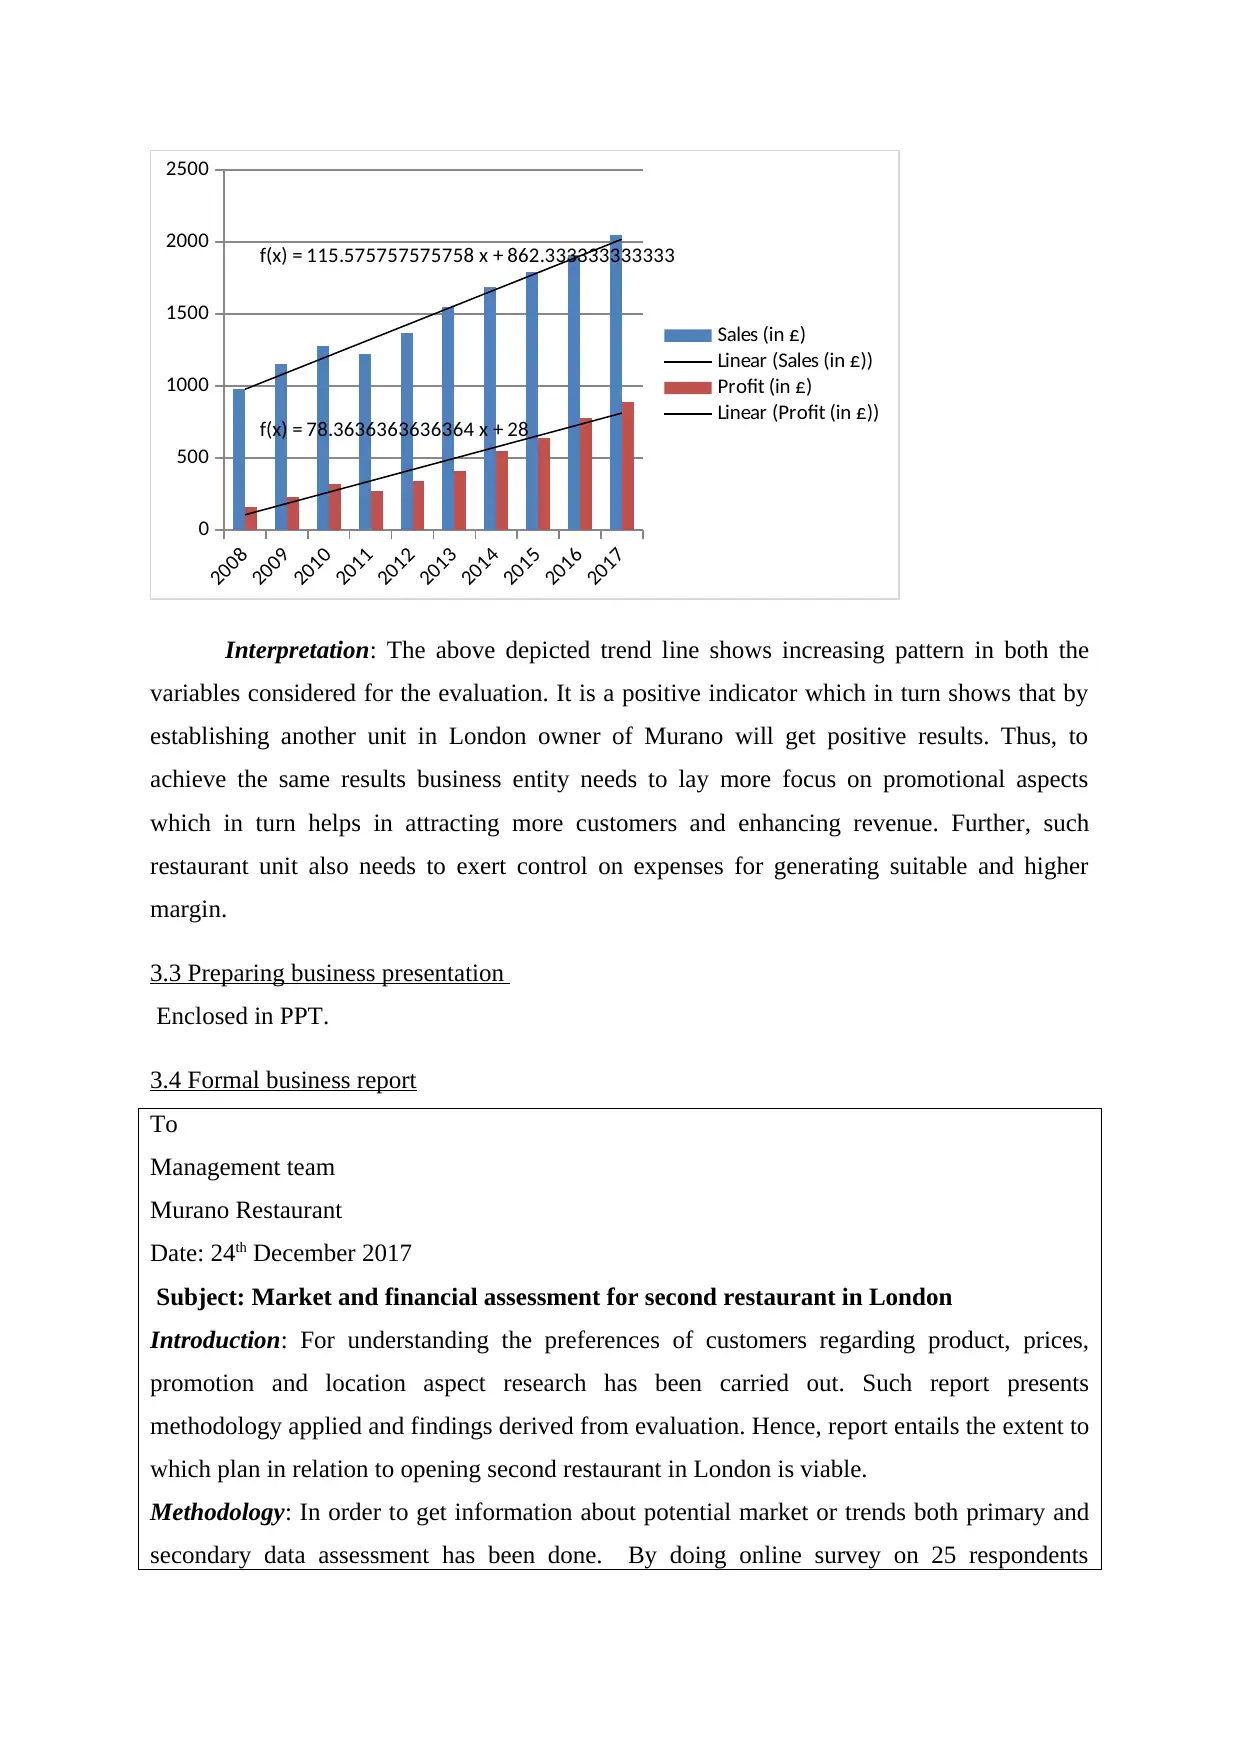
3.2 Creating trend line for forecasting future trends
Trend line: It shows direction or pattern on the basis of which specific data set will
move in the near future. Such statistical tool helps business entity or analyst in understanding
or evaluating future trends (Trend Line, 2017). On the basis of sales and profit figure of
Murano following trend line is drawn:
3.1 Graphical presentation
It implies for the visual presentation of data set and helps in understanding data set or
statistical results in the best possible way (Uyar, Gungormus and Kuzey, 2017). Graphical
presentation facilitates better understanding so it is considered as high effectual as compared
to the tabular presentation. Graphical presentation of sales and profit data set
2008 2009 2010 2011 2012 2013 2014 2015 2016 2017
0
500
1000
1500
2000
2500
Sales (in £)
Profit (in £)
Interpretation: By doing analysis of secondary data set, it has found that sales
revenue of Murano increased from £980 to £2050 at the end of 2017. Along with this, profit
margin of the restaurant unit also inclined over the years to a great extent. Hence, increasing
sales pattern entail that customer base of restaurant unit is good. Further, higher sales indicate
that customers give more preference to the dinning services which are offered by Murano.
Along with this, profitability trend exhibits that such restaurant unit has made effectual
control on expenses. Thus, it can be depicted that financial performance of Murano is good in
terms of revenue and margin.
3.2 Creating trend line for forecasting future trends
Trend line: It shows direction or pattern on the basis of which specific data set will
move in the near future. Such statistical tool helps business entity or analyst in understanding
or evaluating future trends (Trend Line, 2017). On the basis of sales and profit figure of
Murano following trend line is drawn:
2008
2009
2010
2011
2012
2013
2014
2015
2016
2017
0
500
1000
1500
2000
2500
f(x) = 115.575757575758 x + 862.333333333333
f(x) = 78.3636363636364 x + 28
Sales (in £)
Linear (Sales (in £))
Profit (in £)
Linear (Profit (in £))
Interpretation: The above depicted trend line shows increasing pattern in both the
variables considered for the evaluation. It is a positive indicator which in turn shows that by
establishing another unit in London owner of Murano will get positive results. Thus, to
achieve the same results business entity needs to lay more focus on promotional aspects
which in turn helps in attracting more customers and enhancing revenue. Further, such
restaurant unit also needs to exert control on expenses for generating suitable and higher
margin.
3.3 Preparing business presentation
Enclosed in PPT.
3.4 Formal business report
To
Management team
Murano Restaurant
Date: 24th December 2017
Subject: Market and financial assessment for second restaurant in London
Introduction: For understanding the preferences of customers regarding product, prices,
promotion and location aspect research has been carried out. Such report presents
methodology applied and findings derived from evaluation. Hence, report entails the extent to
which plan in relation to opening second restaurant in London is viable.
Methodology: In order to get information about potential market or trends both primary and
secondary data assessment has been done. By doing online survey on 25 respondents
⊘ This is a preview!⊘
Do you want full access?
Subscribe today to unlock all pages.
Trusted by 1+ million students worldwide
1 out of 17
Related Documents


Your All-in-One AI-Powered Toolkit for Academic Success.
+13062052269
info@desklib.com
Available 24*7 on WhatsApp / Email
![[object Object]](/_next/static/media/star-bottom.7253800d.svg)
Unlock your academic potential
Copyright © 2020–2026 A2Z Services. All Rights Reserved. Developed and managed by ZUCOL.