Business Decision Making: A Report on UKCBC Student Survey
VerifiedAdded on 2020/06/04
|34
|5611
|28
Report
AI Summary
This report analyzes business decision-making processes within the context of UKCBC College, focusing on student satisfaction and experiences. The methodology involves primary data collection through questionnaires across four campuses and secondary data from college publications. Statistical tools such as measures of central tendency (mean, mode, median) and dispersion (range, variance, standard deviation) are employed to analyze survey data and derive conclusions about student perceptions of learning materials, facilities, and teaching methodologies. The report summarizes the survey data, presents findings, and offers insights into areas where UKCBC can improve its services based on student feedback. The study uses simple random sampling and includes a detailed questionnaire. The analysis provides a valuable framework for understanding student experiences and informing strategic decisions within the college.

BUSINESS DECISION
MAKING
MAKING
Paraphrase This Document
Need a fresh take? Get an instant paraphrase of this document with our AI Paraphraser
⊘ This is a preview!⊘
Do you want full access?
Subscribe today to unlock all pages.
Trusted by 1+ million students worldwide
INTRODUCTION
In the workplace of any organisation, several kinds of the problems and issues arise
which hamper the smooth business process to a greater level. It is mandatory to resolve such
obstacles by which an entrepreneur can easily achieve those purposes and goals which are
predetermined.. For conducting appropriate research, different number of statistical tools and
methods are considered by the scholar, which are described in the present project. The research
is on the basis of UK College of Business and Computing (UKCBC) in which satisfaction as
well as the experience level of students are analysed. It focuses on statistical tools and methods
like measure of dispersion, central tendency etc. which is supportive for making effective
business decisions. Beside this, the present project describes about the thematic analysis which is
taken into account by the scholar for analyse research problems and derive conclusion. At the
end of report, network diagram and financial tools are presented through which management is
able to make better decisions and meet with the determined time frame.
TASK 1
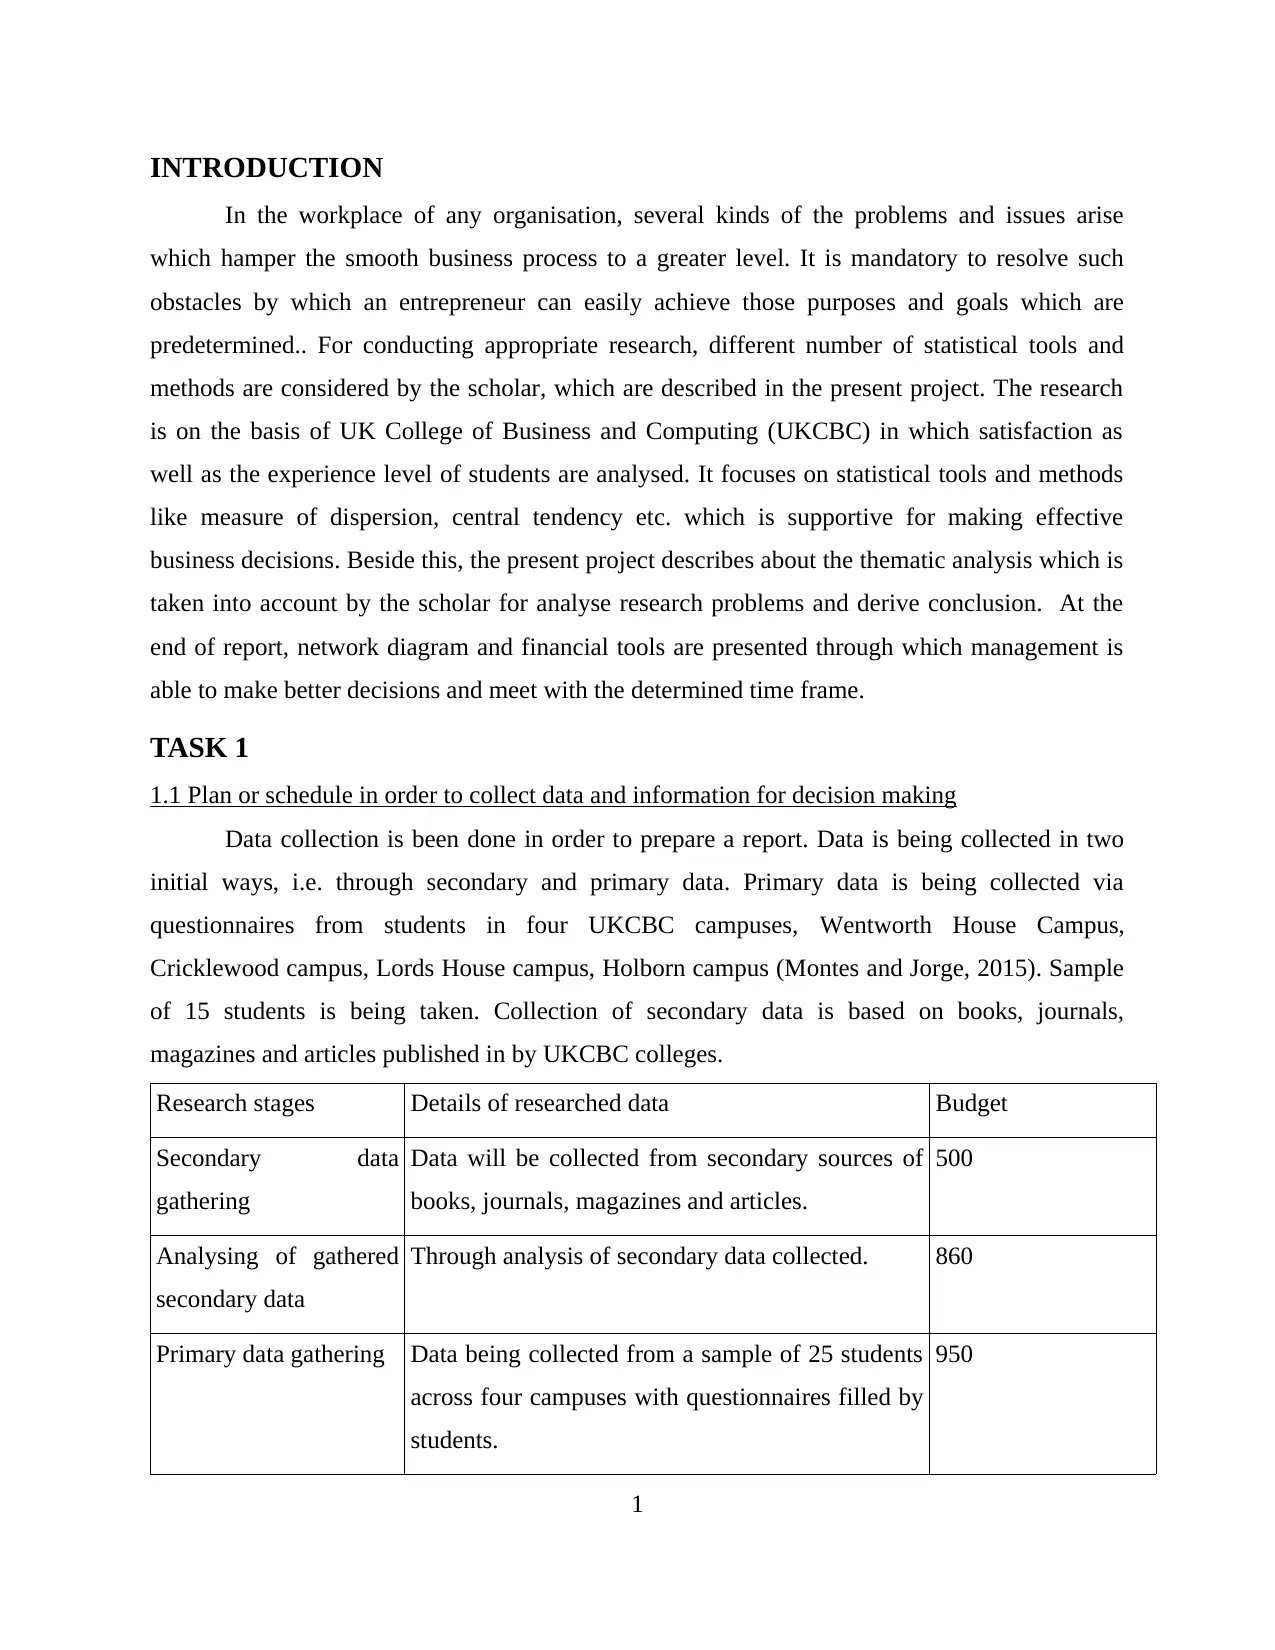
1.1 Plan or schedule in order to collect data and information for decision making
Data collection is been done in order to prepare a report. Data is being collected in two
initial ways, i.e. through secondary and primary data. Primary data is being collected via
questionnaires from students in four UKCBC campuses, Wentworth House Campus,
Cricklewood campus, Lords House campus, Holborn campus (Montes and Jorge, 2015). Sample
of 15 students is being taken. Collection of secondary data is based on books, journals,
magazines and articles published in by UKCBC colleges.
Research stages Details of researched data Budget
Secondary data
gathering
Data will be collected from secondary sources of
books, journals, magazines and articles.
500
Analysing of gathered
secondary data
Through analysis of secondary data collected. 860
Primary data gathering Data being collected from a sample of 25 students
across four campuses with questionnaires filled by
students.
950
1
In the workplace of any organisation, several kinds of the problems and issues arise
which hamper the smooth business process to a greater level. It is mandatory to resolve such
obstacles by which an entrepreneur can easily achieve those purposes and goals which are
predetermined.. For conducting appropriate research, different number of statistical tools and
methods are considered by the scholar, which are described in the present project. The research
is on the basis of UK College of Business and Computing (UKCBC) in which satisfaction as
well as the experience level of students are analysed. It focuses on statistical tools and methods
like measure of dispersion, central tendency etc. which is supportive for making effective
business decisions. Beside this, the present project describes about the thematic analysis which is
taken into account by the scholar for analyse research problems and derive conclusion. At the
end of report, network diagram and financial tools are presented through which management is
able to make better decisions and meet with the determined time frame.
TASK 1
1.1 Plan or schedule in order to collect data and information for decision making
Data collection is been done in order to prepare a report. Data is being collected in two
initial ways, i.e. through secondary and primary data. Primary data is being collected via
questionnaires from students in four UKCBC campuses, Wentworth House Campus,
Cricklewood campus, Lords House campus, Holborn campus (Montes and Jorge, 2015). Sample
of 15 students is being taken. Collection of secondary data is based on books, journals,
magazines and articles published in by UKCBC colleges.
Research stages Details of researched data Budget
Secondary data
gathering
Data will be collected from secondary sources of
books, journals, magazines and articles.
500
Analysing of gathered
secondary data
Through analysis of secondary data collected. 860
Primary data gathering Data being collected from a sample of 25 students
across four campuses with questionnaires filled by
students.
950
1
Paraphrase This Document
Need a fresh take? Get an instant paraphrase of this document with our AI Paraphraser
Analysing of primary
data
Collected primary data being analysed for statical
research.
1120
Report Preparation of report taking in account the base
data created from primary and secondary
collection.
290
Total budgeted amount for conducting survey 3720 GBP
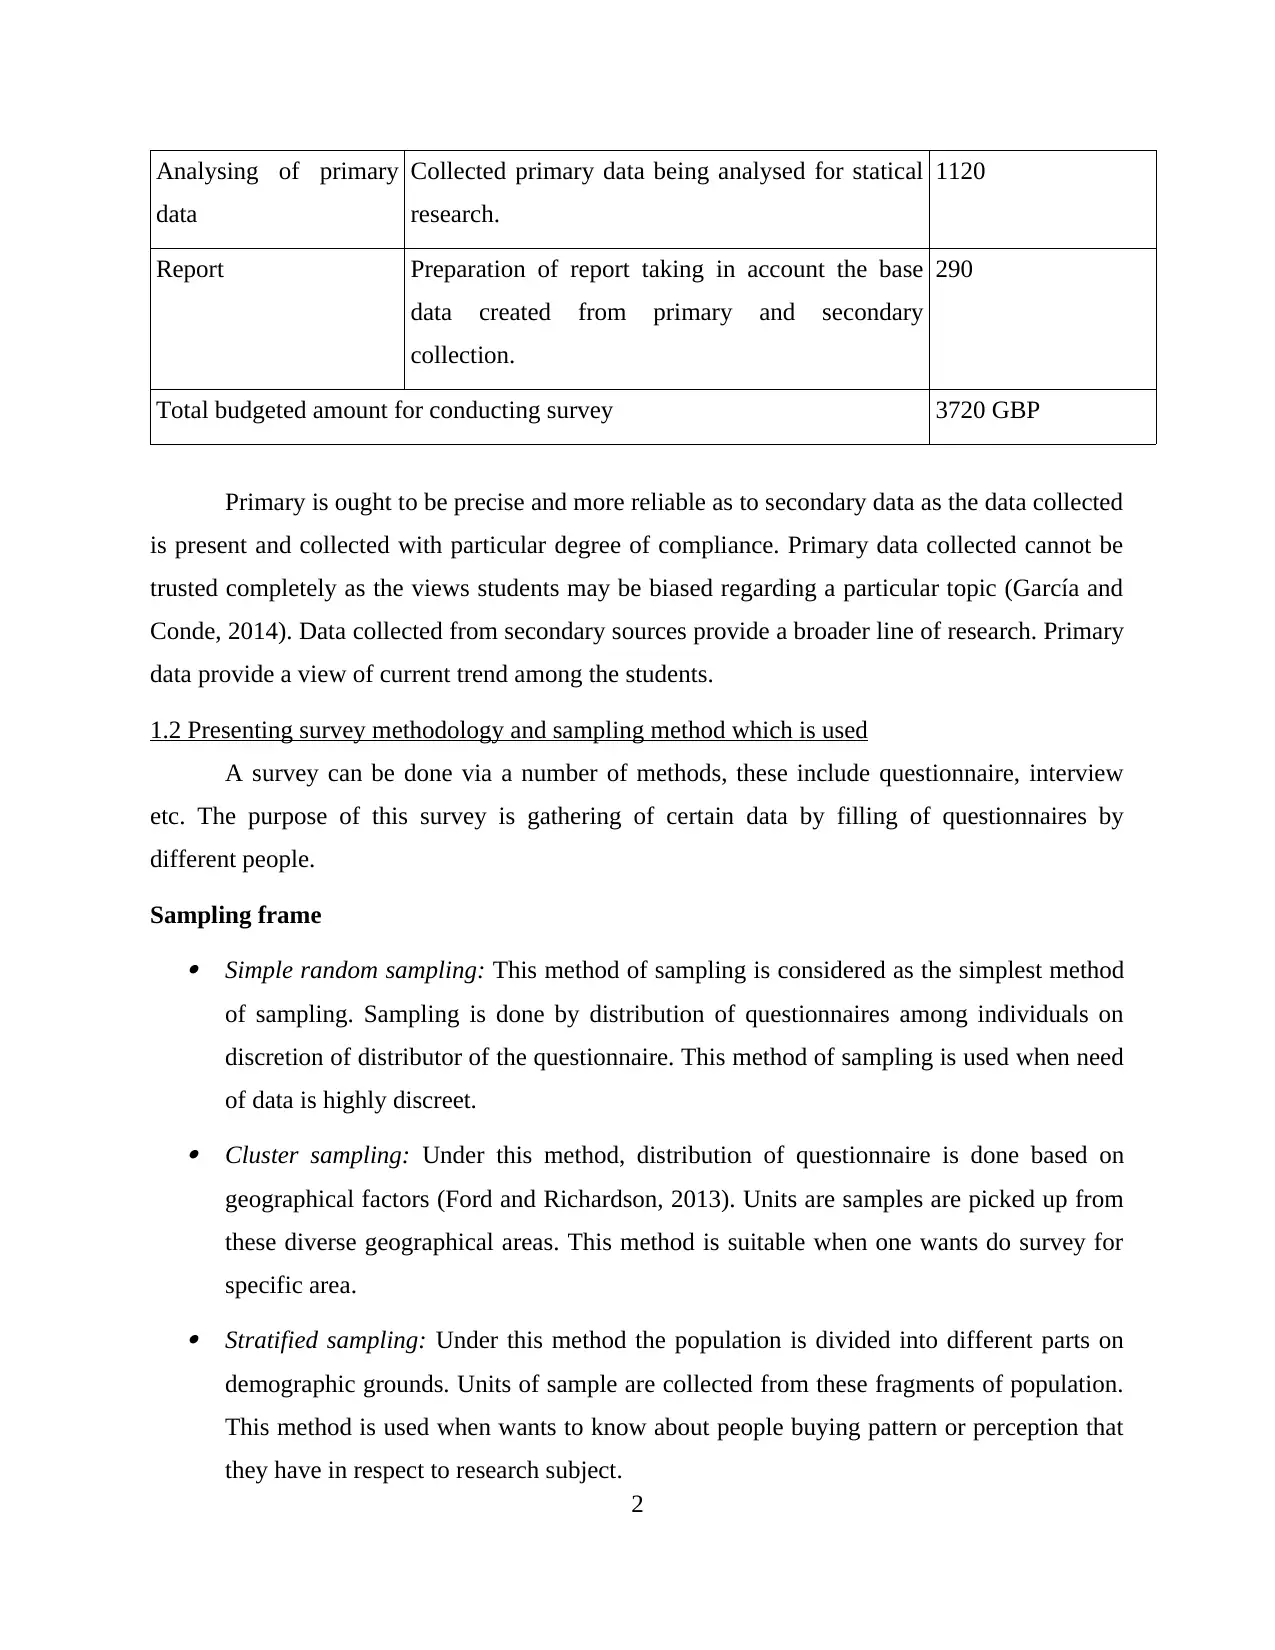
Primary is ought to be precise and more reliable as to secondary data as the data collected
is present and collected with particular degree of compliance. Primary data collected cannot be
trusted completely as the views students may be biased regarding a particular topic (García and
Conde, 2014). Data collected from secondary sources provide a broader line of research. Primary
data provide a view of current trend among the students.
1.2 Presenting survey methodology and sampling method which is used
A survey can be done via a number of methods, these include questionnaire, interview
etc. The purpose of this survey is gathering of certain data by filling of questionnaires by
different people.
Sampling frame Simple random sampling: This method of sampling is considered as the simplest method
of sampling. Sampling is done by distribution of questionnaires among individuals on
discretion of distributor of the questionnaire. This method of sampling is used when need
of data is highly discreet. Cluster sampling: Under this method, distribution of questionnaire is done based on
geographical factors (Ford and Richardson, 2013). Units are samples are picked up from
these diverse geographical areas. This method is suitable when one wants do survey for
specific area. Stratified sampling: Under this method the population is divided into different parts on
demographic grounds. Units of sample are collected from these fragments of population.
This method is used when wants to know about people buying pattern or perception that
they have in respect to research subject.
2
data
Collected primary data being analysed for statical
research.
1120
Report Preparation of report taking in account the base
data created from primary and secondary
collection.
290
Total budgeted amount for conducting survey 3720 GBP
Primary is ought to be precise and more reliable as to secondary data as the data collected
is present and collected with particular degree of compliance. Primary data collected cannot be
trusted completely as the views students may be biased regarding a particular topic (García and
Conde, 2014). Data collected from secondary sources provide a broader line of research. Primary
data provide a view of current trend among the students.
1.2 Presenting survey methodology and sampling method which is used
A survey can be done via a number of methods, these include questionnaire, interview
etc. The purpose of this survey is gathering of certain data by filling of questionnaires by
different people.
Sampling frame Simple random sampling: This method of sampling is considered as the simplest method
of sampling. Sampling is done by distribution of questionnaires among individuals on
discretion of distributor of the questionnaire. This method of sampling is used when need
of data is highly discreet. Cluster sampling: Under this method, distribution of questionnaire is done based on
geographical factors (Ford and Richardson, 2013). Units are samples are picked up from
these diverse geographical areas. This method is suitable when one wants do survey for
specific area. Stratified sampling: Under this method the population is divided into different parts on
demographic grounds. Units of sample are collected from these fragments of population.
This method is used when wants to know about people buying pattern or perception that
they have in respect to research subject.
2
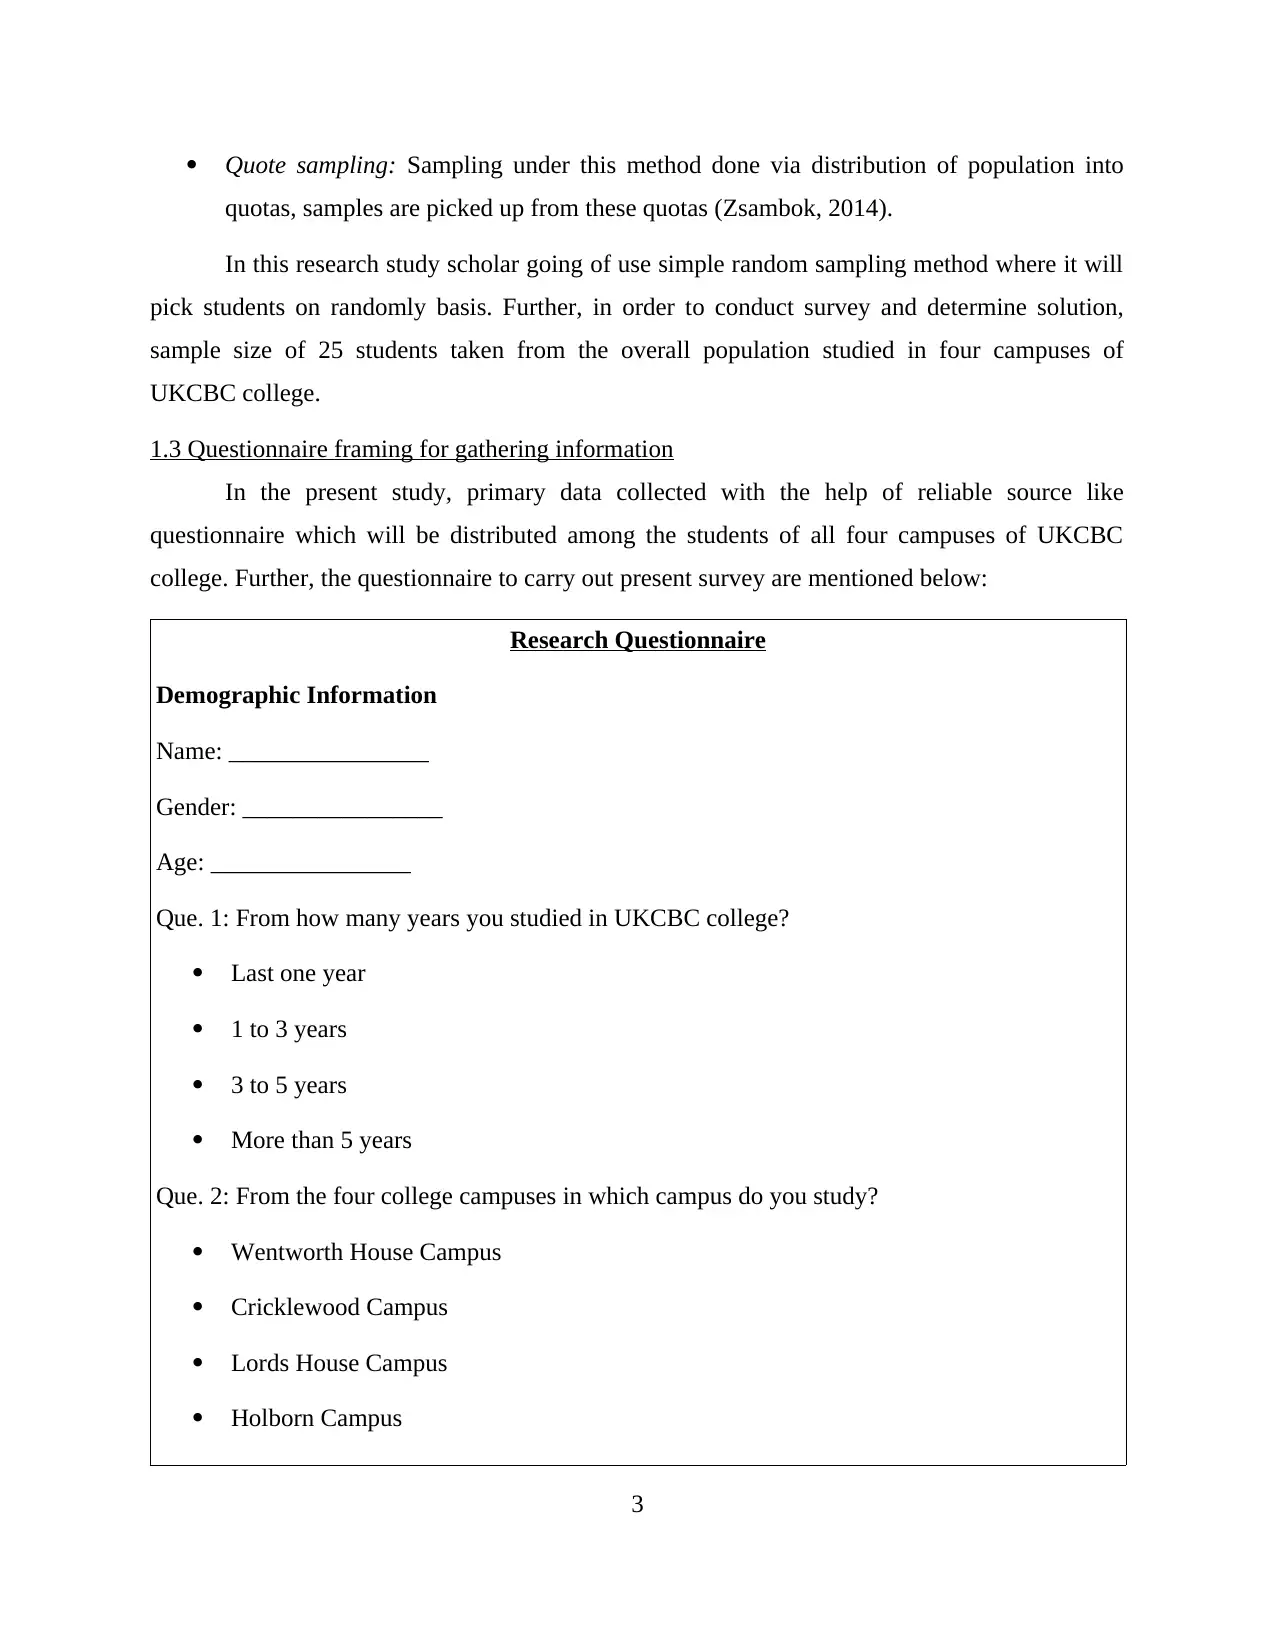
Quote sampling: Sampling under this method done via distribution of population into
quotas, samples are picked up from these quotas (Zsambok, 2014).
In this research study scholar going of use simple random sampling method where it will
pick students on randomly basis. Further, in order to conduct survey and determine solution,
sample size of 25 students taken from the overall population studied in four campuses of
UKCBC college.
1.3 Questionnaire framing for gathering information
In the present study, primary data collected with the help of reliable source like
questionnaire which will be distributed among the students of all four campuses of UKCBC
college. Further, the questionnaire to carry out present survey are mentioned below:
Research Questionnaire
Demographic Information
Name: ________________
Gender: ________________
Age: ________________
Que. 1: From how many years you studied in UKCBC college?
Last one year
1 to 3 years
3 to 5 years
More than 5 years
Que. 2: From the four college campuses in which campus do you study?
Wentworth House Campus
Cricklewood Campus
Lords House Campus
Holborn Campus
3
⊘ This is a preview!⊘
Do you want full access?
Subscribe today to unlock all pages.
Trusted by 1+ million students worldwide
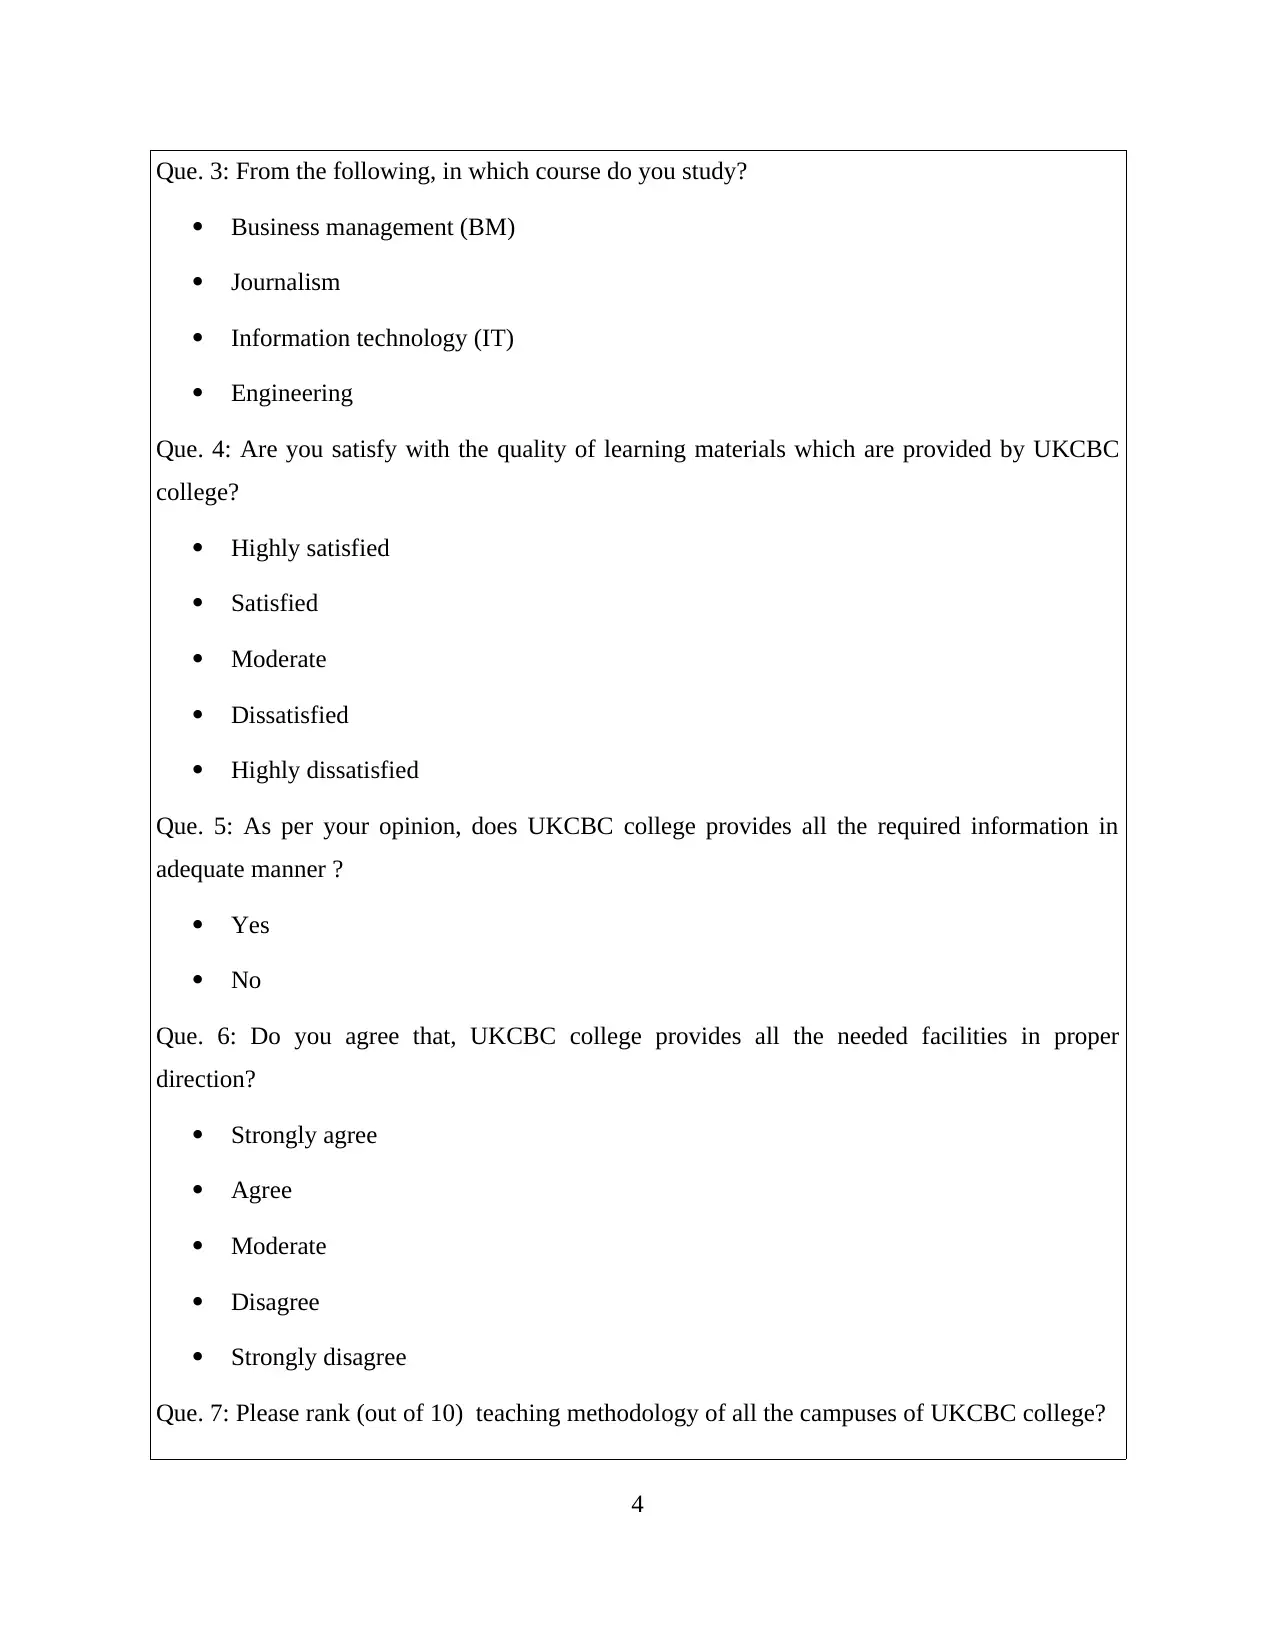
Que. 3: From the following, in which course do you study?
Business management (BM)
Journalism
Information technology (IT)
Engineering
Que. 4: Are you satisfy with the quality of learning materials which are provided by UKCBC
college?
Highly satisfied
Satisfied
Moderate
Dissatisfied
Highly dissatisfied
Que. 5: As per your opinion, does UKCBC college provides all the required information in
adequate manner ?
Yes
No
Que. 6: Do you agree that, UKCBC college provides all the needed facilities in proper
direction?
Strongly agree
Agree
Moderate
Disagree
Strongly disagree
Que. 7: Please rank (out of 10) teaching methodology of all the campuses of UKCBC college?
4
Paraphrase This Document
Need a fresh take? Get an instant paraphrase of this document with our AI Paraphraser
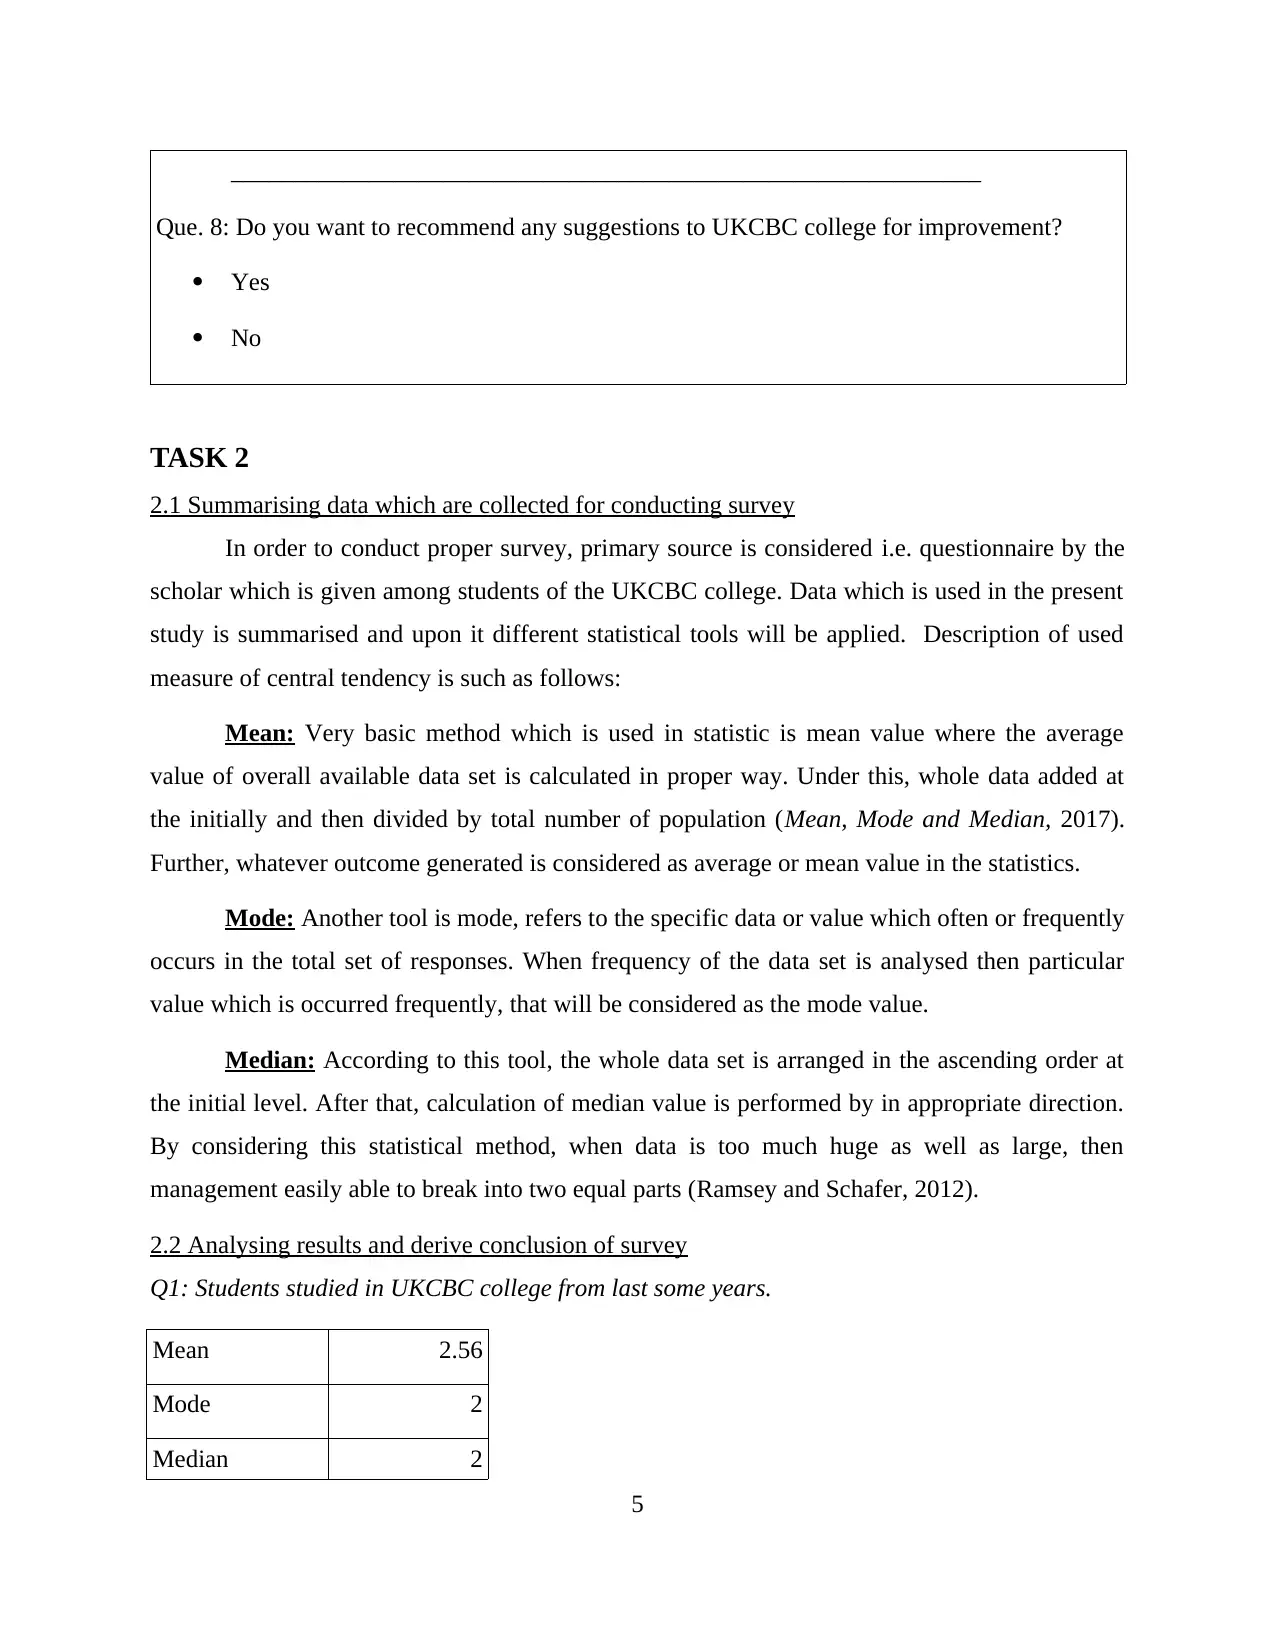
____________________________________________________________
Que. 8: Do you want to recommend any suggestions to UKCBC college for improvement?
Yes
No
TASK 2
2.1 Summarising data which are collected for conducting survey
In order to conduct proper survey, primary source is considered i.e. questionnaire by the
scholar which is given among students of the UKCBC college. Data which is used in the present
study is summarised and upon it different statistical tools will be applied. Description of used
measure of central tendency is such as follows:
Mean: Very basic method which is used in statistic is mean value where the average
value of overall available data set is calculated in proper way. Under this, whole data added at
the initially and then divided by total number of population (Mean, Mode and Median, 2017).
Further, whatever outcome generated is considered as average or mean value in the statistics.
Mode: Another tool is mode, refers to the specific data or value which often or frequently
occurs in the total set of responses. When frequency of the data set is analysed then particular
value which is occurred frequently, that will be considered as the mode value.
Median: According to this tool, the whole data set is arranged in the ascending order at
the initial level. After that, calculation of median value is performed by in appropriate direction.
By considering this statistical method, when data is too much huge as well as large, then
management easily able to break into two equal parts (Ramsey and Schafer, 2012).
2.2 Analysing results and derive conclusion of survey
Q1: Students studied in UKCBC college from last some years.
Mean 2.56
Mode 2
Median 2
5
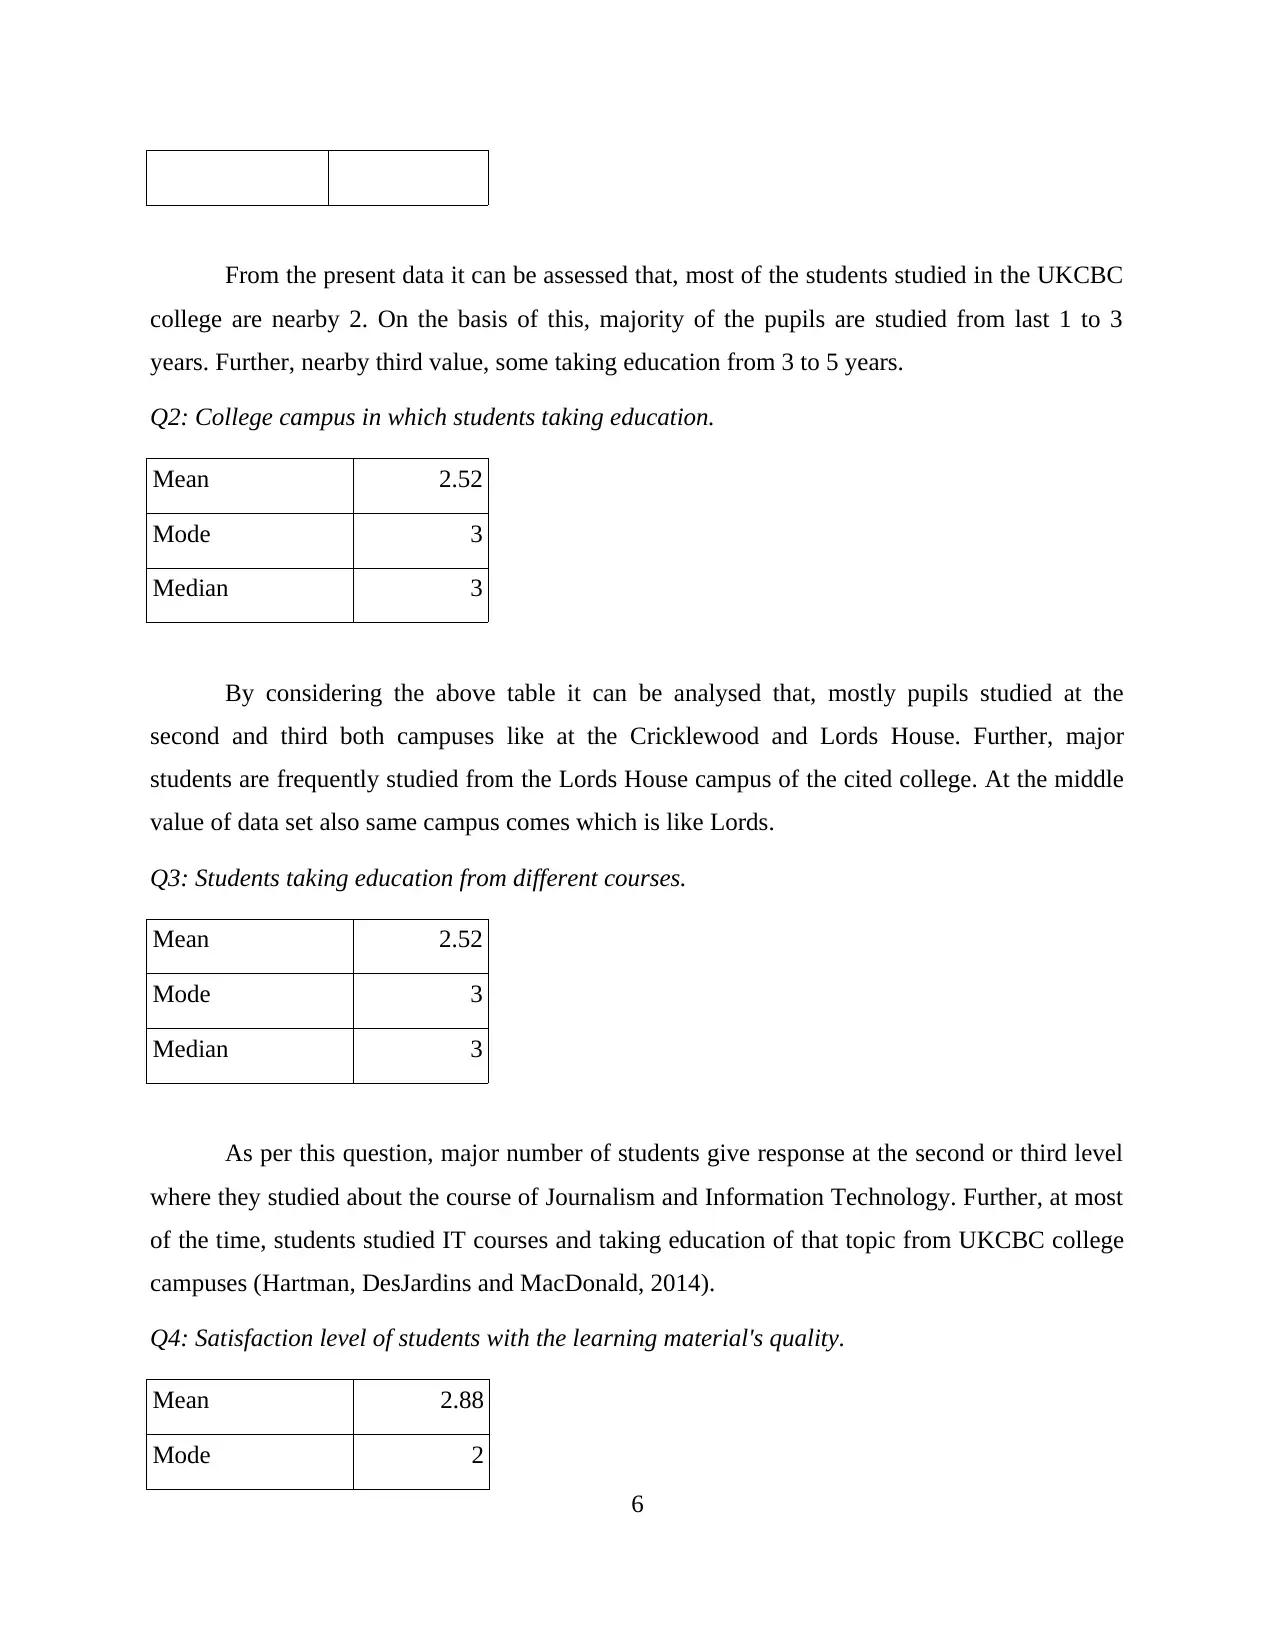
From the present data it can be assessed that, most of the students studied in the UKCBC
college are nearby 2. On the basis of this, majority of the pupils are studied from last 1 to 3
years. Further, nearby third value, some taking education from 3 to 5 years.
Q2: College campus in which students taking education.
Mean 2.52
Mode 3
Median 3
By considering the above table it can be analysed that, mostly pupils studied at the
second and third both campuses like at the Cricklewood and Lords House. Further, major
students are frequently studied from the Lords House campus of the cited college. At the middle
value of data set also same campus comes which is like Lords.
Q3: Students taking education from different courses.
Mean 2.52
Mode 3
Median 3
As per this question, major number of students give response at the second or third level
where they studied about the course of Journalism and Information Technology. Further, at most
of the time, students studied IT courses and taking education of that topic from UKCBC college
campuses (Hartman, DesJardins and MacDonald, 2014).
Q4: Satisfaction level of students with the learning material's quality.
Mean 2.88
Mode 2
6
⊘ This is a preview!⊘
Do you want full access?
Subscribe today to unlock all pages.
Trusted by 1+ million students worldwide
Median 2
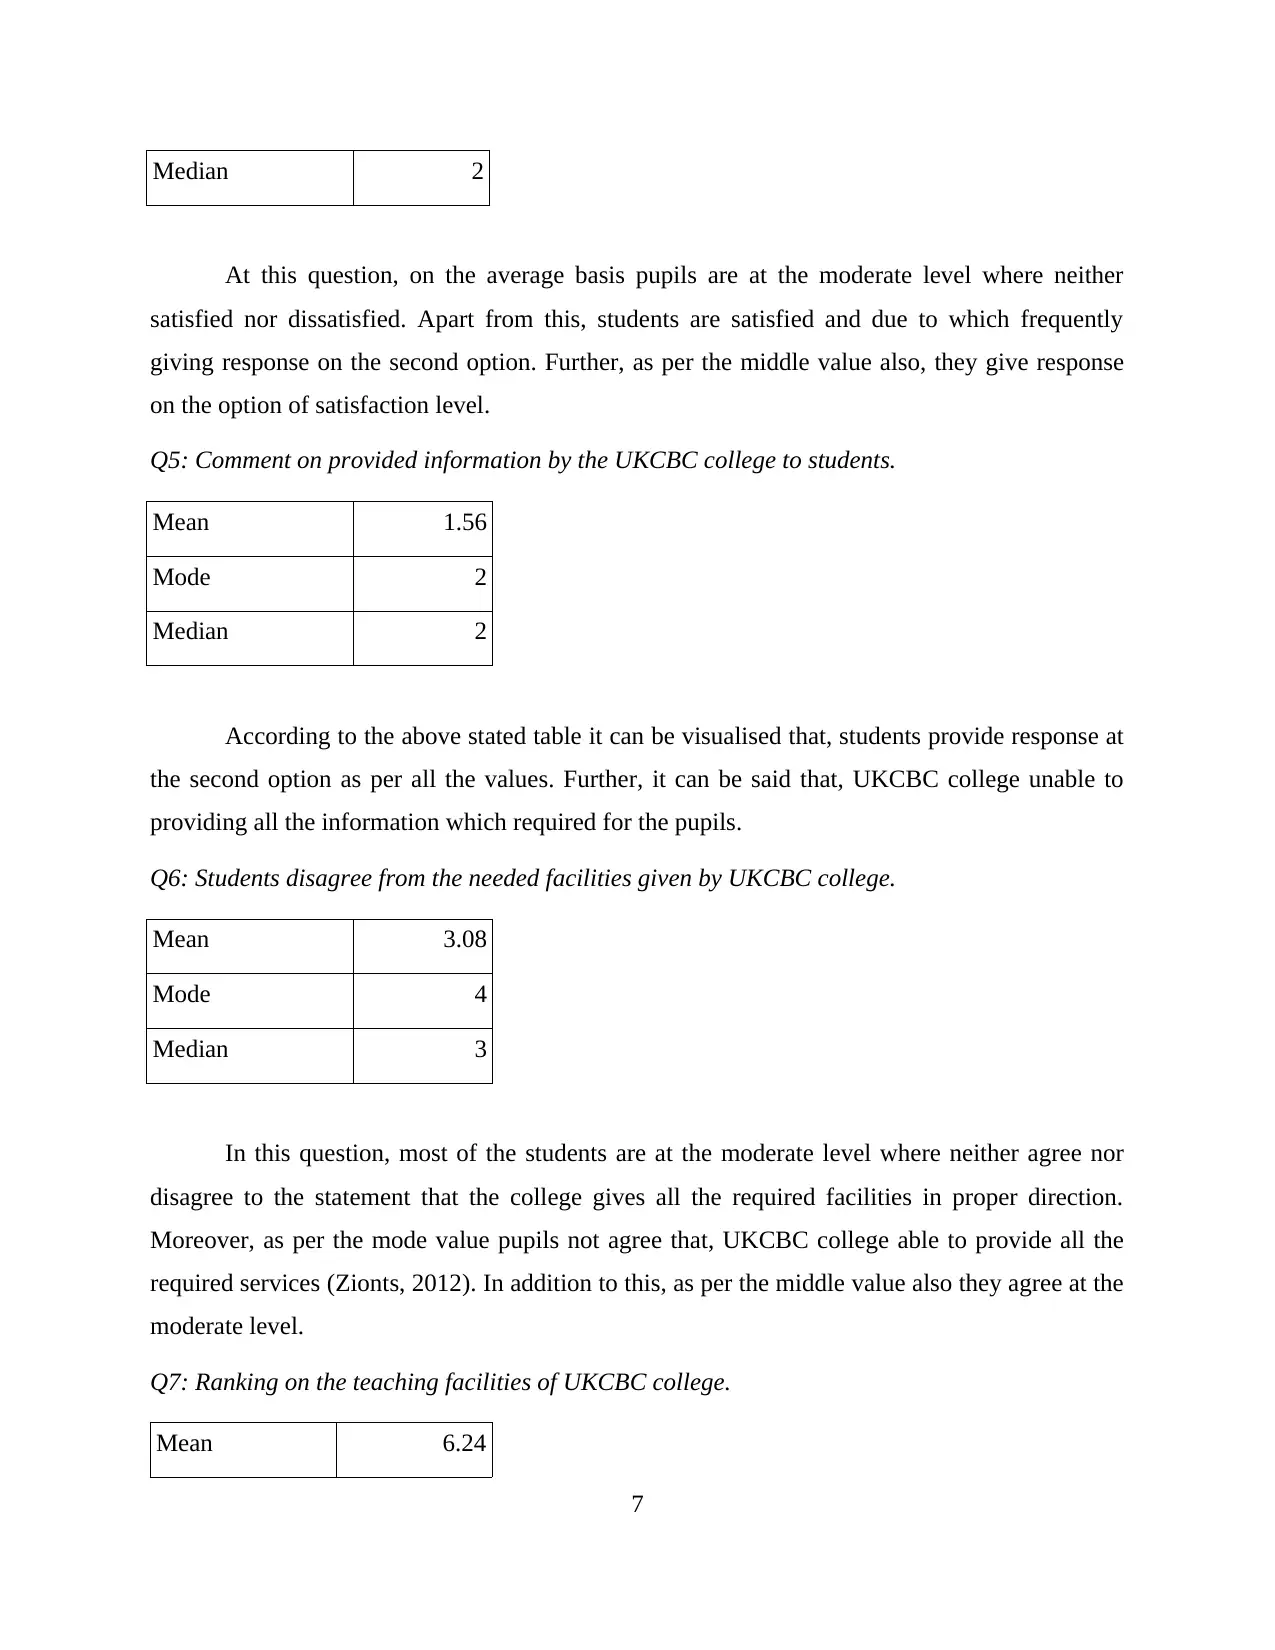
At this question, on the average basis pupils are at the moderate level where neither
satisfied nor dissatisfied. Apart from this, students are satisfied and due to which frequently
giving response on the second option. Further, as per the middle value also, they give response
on the option of satisfaction level.
Q5: Comment on provided information by the UKCBC college to students.
Mean 1.56
Mode 2
Median 2
According to the above stated table it can be visualised that, students provide response at
the second option as per all the values. Further, it can be said that, UKCBC college unable to
providing all the information which required for the pupils.
Q6: Students disagree from the needed facilities given by UKCBC college.
Mean 3.08
Mode 4
Median 3
In this question, most of the students are at the moderate level where neither agree nor
disagree to the statement that the college gives all the required facilities in proper direction.
Moreover, as per the mode value pupils not agree that, UKCBC college able to provide all the
required services (Zionts, 2012). In addition to this, as per the middle value also they agree at the
moderate level.
Q7: Ranking on the teaching facilities of UKCBC college.
Mean 6.24
7
Paraphrase This Document
Need a fresh take? Get an instant paraphrase of this document with our AI Paraphraser
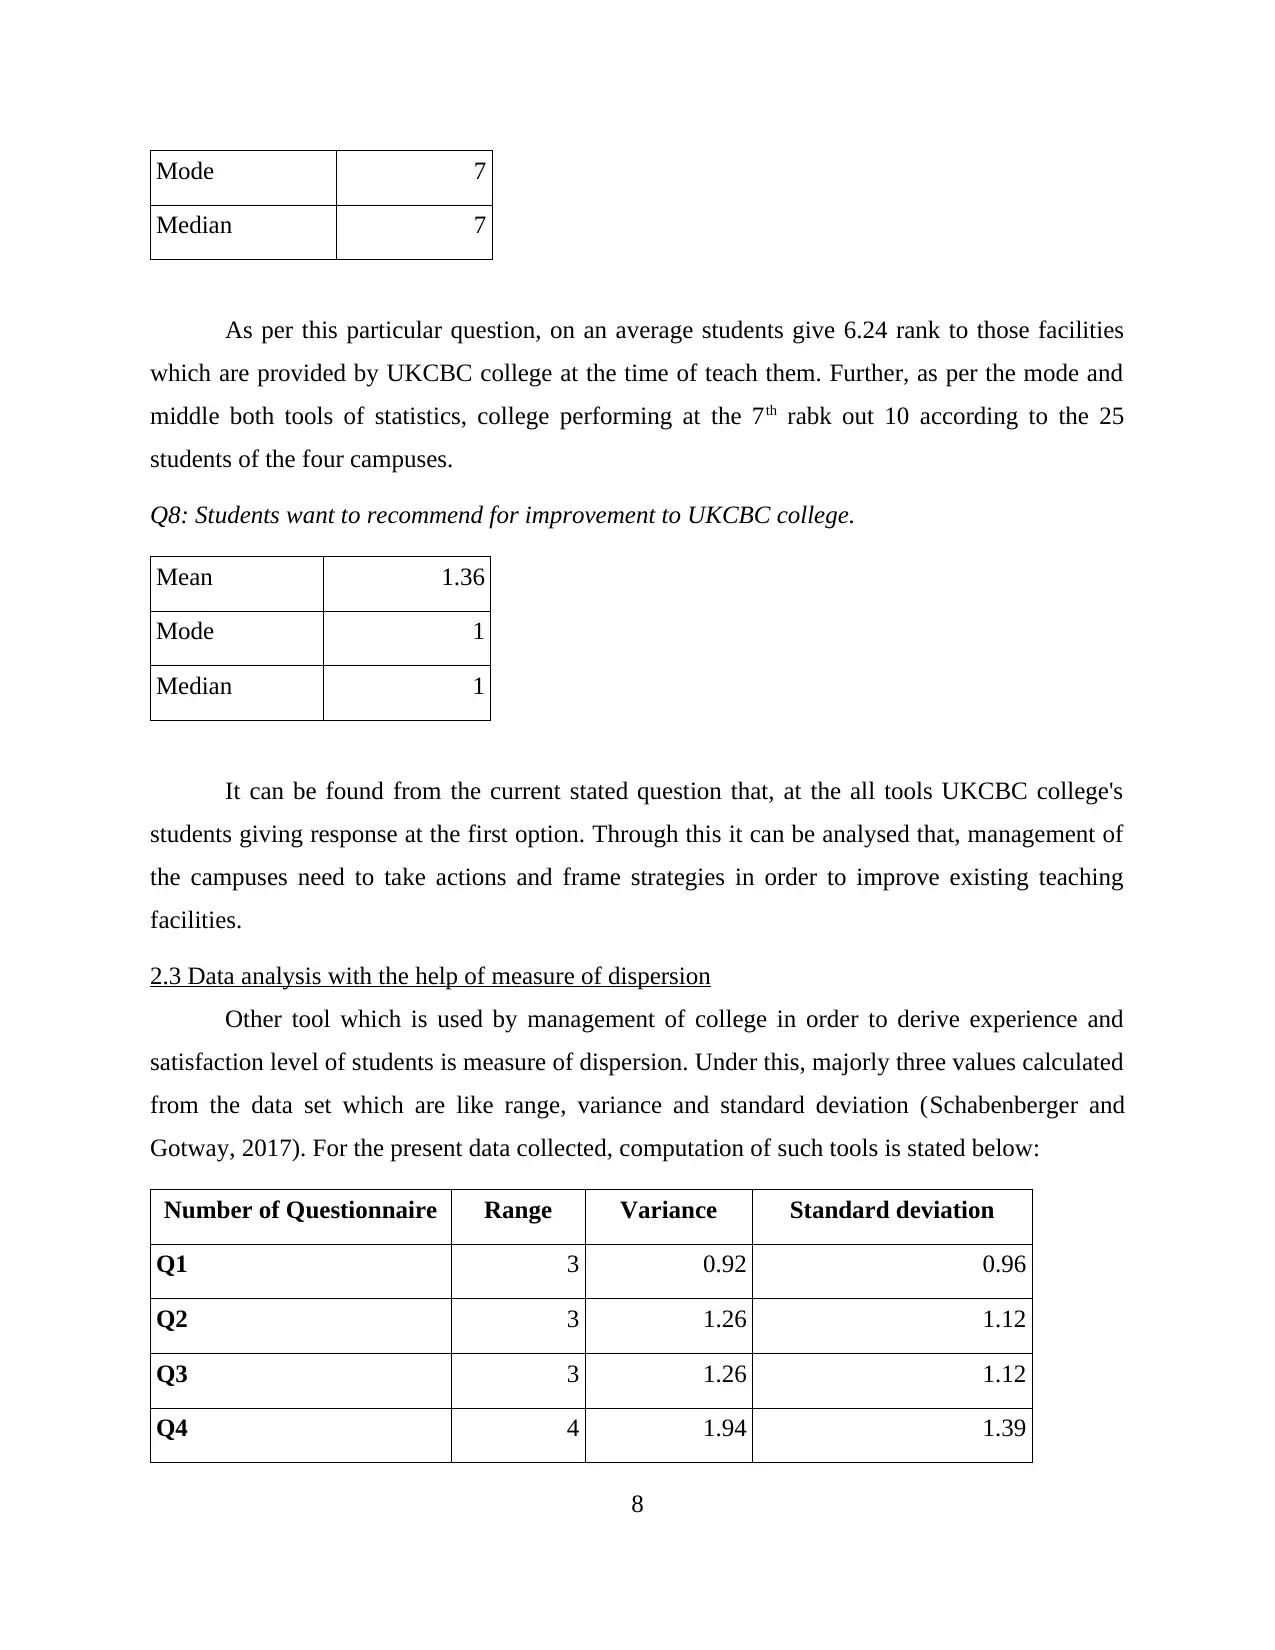
Mode 7
Median 7
As per this particular question, on an average students give 6.24 rank to those facilities
which are provided by UKCBC college at the time of teach them. Further, as per the mode and
middle both tools of statistics, college performing at the 7th rabk out 10 according to the 25
students of the four campuses.
Q8: Students want to recommend for improvement to UKCBC college.
Mean 1.36
Mode 1
Median 1
It can be found from the current stated question that, at the all tools UKCBC college's
students giving response at the first option. Through this it can be analysed that, management of
the campuses need to take actions and frame strategies in order to improve existing teaching
facilities.
2.3 Data analysis with the help of measure of dispersion
Other tool which is used by management of college in order to derive experience and
satisfaction level of students is measure of dispersion. Under this, majorly three values calculated
from the data set which are like range, variance and standard deviation (Schabenberger and
Gotway, 2017). For the present data collected, computation of such tools is stated below:
Number of Questionnaire Range Variance Standard deviation
Q1 3 0.92 0.96
Q2 3 1.26 1.12
Q3 3 1.26 1.12
Q4 4 1.94 1.39
8
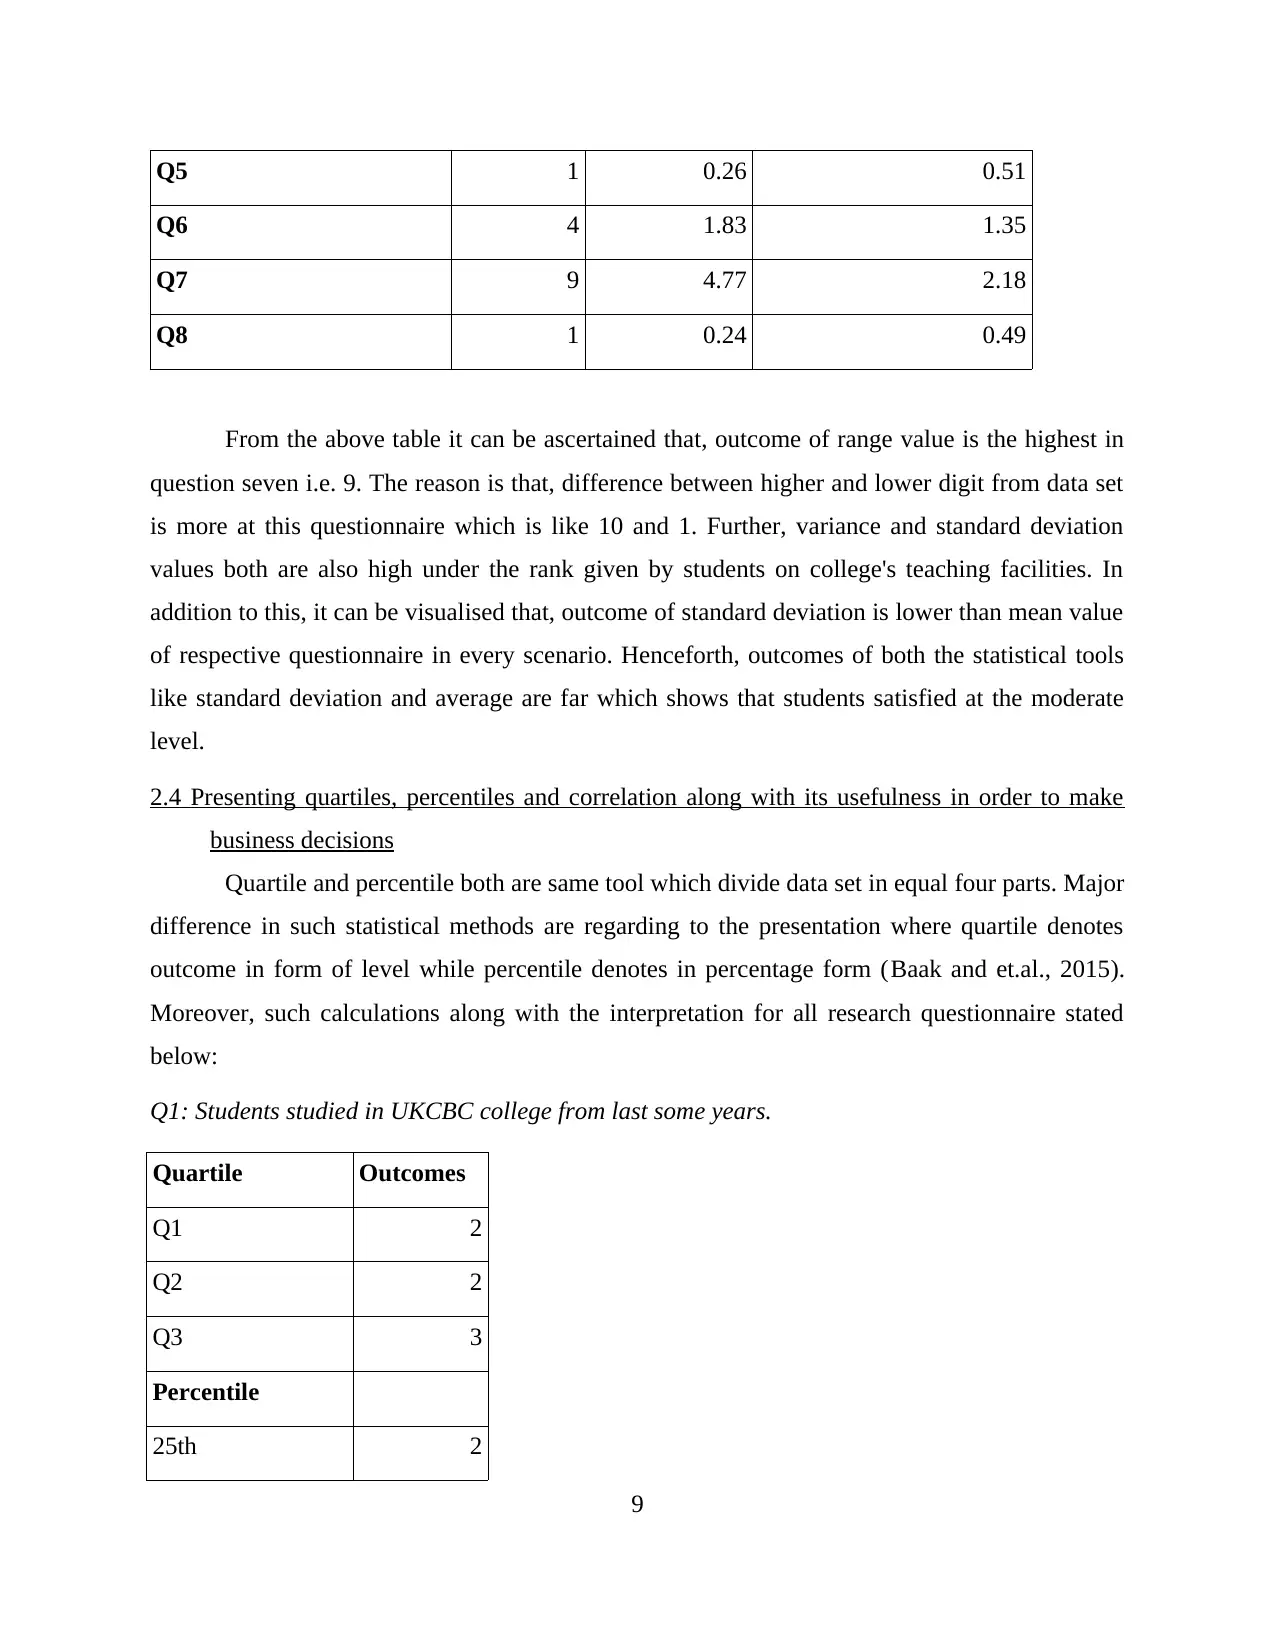
Q5 1 0.26 0.51
Q6 4 1.83 1.35
Q7 9 4.77 2.18
Q8 1 0.24 0.49
From the above table it can be ascertained that, outcome of range value is the highest in
question seven i.e. 9. The reason is that, difference between higher and lower digit from data set
is more at this questionnaire which is like 10 and 1. Further, variance and standard deviation
values both are also high under the rank given by students on college's teaching facilities. In
addition to this, it can be visualised that, outcome of standard deviation is lower than mean value
of respective questionnaire in every scenario. Henceforth, outcomes of both the statistical tools
like standard deviation and average are far which shows that students satisfied at the moderate
level.
2.4 Presenting quartiles, percentiles and correlation along with its usefulness in order to make
business decisions
Quartile and percentile both are same tool which divide data set in equal four parts. Major
difference in such statistical methods are regarding to the presentation where quartile denotes
outcome in form of level while percentile denotes in percentage form (Baak and et.al., 2015).
Moreover, such calculations along with the interpretation for all research questionnaire stated
below:
Q1: Students studied in UKCBC college from last some years.
Quartile Outcomes
Q1 2
Q2 2
Q3 3
Percentile
25th 2
9
⊘ This is a preview!⊘
Do you want full access?
Subscribe today to unlock all pages.
Trusted by 1+ million students worldwide
1 out of 34
Related Documents


Your All-in-One AI-Powered Toolkit for Academic Success.
+13062052269
info@desklib.com
Available 24*7 on WhatsApp / Email
![[object Object]](/_next/static/media/star-bottom.7253800d.svg)
Unlock your academic potential
Copyright © 2020–2026 A2Z Services. All Rights Reserved. Developed and managed by ZUCOL.