Business Decision Making Report: Food for Friends Expansion Plan
VerifiedAdded on 2021/01/01
|20
|3021
|48
Report
AI Summary
This report provides a comprehensive analysis of business decision-making for the expansion of Food for Friends. It begins with a detailed introduction to business decision-making and its importance, followed by a plan for primary and secondary research, including questionnaire design and survey methodologies. The report then delves into data interpretation and analysis, covering measures of central tendency, dispersion, and the advantages of using quartiles, percentiles, and correlation coefficients. Task 3 includes the use of charts and trend line analysis to interpret the data. The report concludes with the implementation of information tools in decision-making, including critical path analysis and investment appraisal techniques, offering a complete overview of the decision-making process.
Business Decision Making
Paraphrase This Document
Need a fresh take? Get an instant paraphrase of this document with our AI Paraphraser
TABLE OF CONTENTS
Table of Contents.............................................................................................................................2
INTRODUCTION...........................................................................................................................3
TASK 1............................................................................................................................................3
1.1 Create a plan:....................................................................................................................3
1.2: Survey methodologies and sample framing:...................................................................4
1.3: Questionnaire design.......................................................................................................5
TASK 2............................................................................................................................................6
2.1 Interpretation of data collected:........................................................................................6
2.2 Analysis of the results:.....................................................................................................8
2.3: Analysis of measure of dispersion...................................................................................9
2.4 Advantages of using quartile, percentile and coefficient correlation:..............................9
TASK 3..........................................................................................................................................10
3.2 Trend line:......................................................................................................................14
3.3 Covered in PPT...............................................................................................................15
3.4 Formal report:.................................................................................................................16
TASK 4..........................................................................................................................................16
4.1 Implementing information tools in decision making:....................................................16
4.2 Critical Path:...................................................................................................................17
4.3 Investment appraisal techniques:....................................................................................19
CONCLUSION..............................................................................................................................19
REFERENCES..............................................................................................................................20
INTRODUCTION
Business decision making is the most effective tool that can be used by the organization
in order to gain the sustainability in an effective manner (Schmoldt and et. al., 2013). Decision
making is the tool that can be used by the organization for making an efficient manner. By using
an efficient tool in the research, food for friends is planning to expand its franchise in central
London. However, this can be rightly said that the business can be used for making an efficient
business objective in an efficient manner. Here the primary research is to be taken for doing the
survey via questionnaire in an effective manner (Xu, 2015).
TASK 1
1.1 Create a plan:
Planning is necessary for in every task. Now, this can be rightly said that the management
of the cited restaurant needs to evaluate the proposed business environment by conducting
primary research. Questionnaire is the main tool that can be used for doing the survey. But, there
is a question about the survey. How, this data can be gathered? Well, by using primary method
survey can be done. Here are basically two kinds of methods for collecting the data.
Primary data method: This is the data which is gathered for the first time and used for the
business for attaining the sustainable development. Now, this can be simply said that the
management of the cited restaurant needs to evaluate the market where the restaurant is looking
to open its branch. There are various ways by which the primary data can be achieved in an
effective manner. Some of them are: Questionnaire, observations, interviews and others. This is
simply said that the data collecting technique by using primary method is too much costly and
time consuming process as this requires so much attention while carrying research (Zolfani and
et. al., 2013). This can be used when the data is short or requirement of the data is less needed.
Secondary data method: This is the tool which is used by the organization for making
the business objectives in an efficient manner. Now, this can be rightly said that the management
of the cited organization for making an efficient tool in an efficient manner. The data which have
already been published are used in the secondary method. Secondary methods are the most
effective tool that can be used by the organization for making the business objectives achievable
in an effective manner. Secondary method is the most effective method that can be attained in an
effective tool.
⊘ This is a preview!⊘
Do you want full access?
Subscribe today to unlock all pages.
Trusted by 1+ million students worldwide
1.2: Survey methodologies and sample framing:
The crucial aim of gathering survey for gathering information from diverse respondents
that are highly concerned for the aim of drawing out solutions. For aiming of an efficient report,
there is a strong requirement to convene the primary research that renders feedback which are
related to their diverse kinds of problems (Shapiro and Stefkovich, 2016). This assists in forming
an efficient decision and carry out the changes that could satisfy their diverse criteria.
Survey methodologies: This comprises about process of gathering survey by the Foods for
Friends in order to achieve the diverse respondents’ perceptions regarding cited restaurants
services and food quality. To convene the research, cited restaurant fixed to implement primary
and secondary method of data collection (Tufféry, 2011). Under which questionnaire method is
implemented by the researcher that could comprises diverse kinds of questions related to the
issues which are faced the Food for Friends and distribute among the respondents.
Sample framework: This comprises process of selection of the sample from the total
population. For this aim, researcher might implement diverse kinds of tools such as the random
sampling method, cluster sampling method, stratified sampling and much more. these tools for
collecting the data from the diverse respondents as this does not possible in order to convene
research from the entire population.
Researcher opt random sampling method for collecting the data from various respondents that is
more strong and convenient tool for selection of sample from the total population. There are
diverse kinds of benefits which are to be used for making sustainable development for gaining
the sustainability. This is the main cause behind the selection of this tool (Yager and Kacprzyk,
2012). For purpose of convening the research, there are almost 60 respondents from the total
population. Diverse kinds of issues for which diverse questions are frequently asked to
respondents comprising about:
Diversity in services
Quality of food products
Price
Working at Food for friends
Paraphrase This Document
Need a fresh take? Get an instant paraphrase of this document with our AI Paraphraser
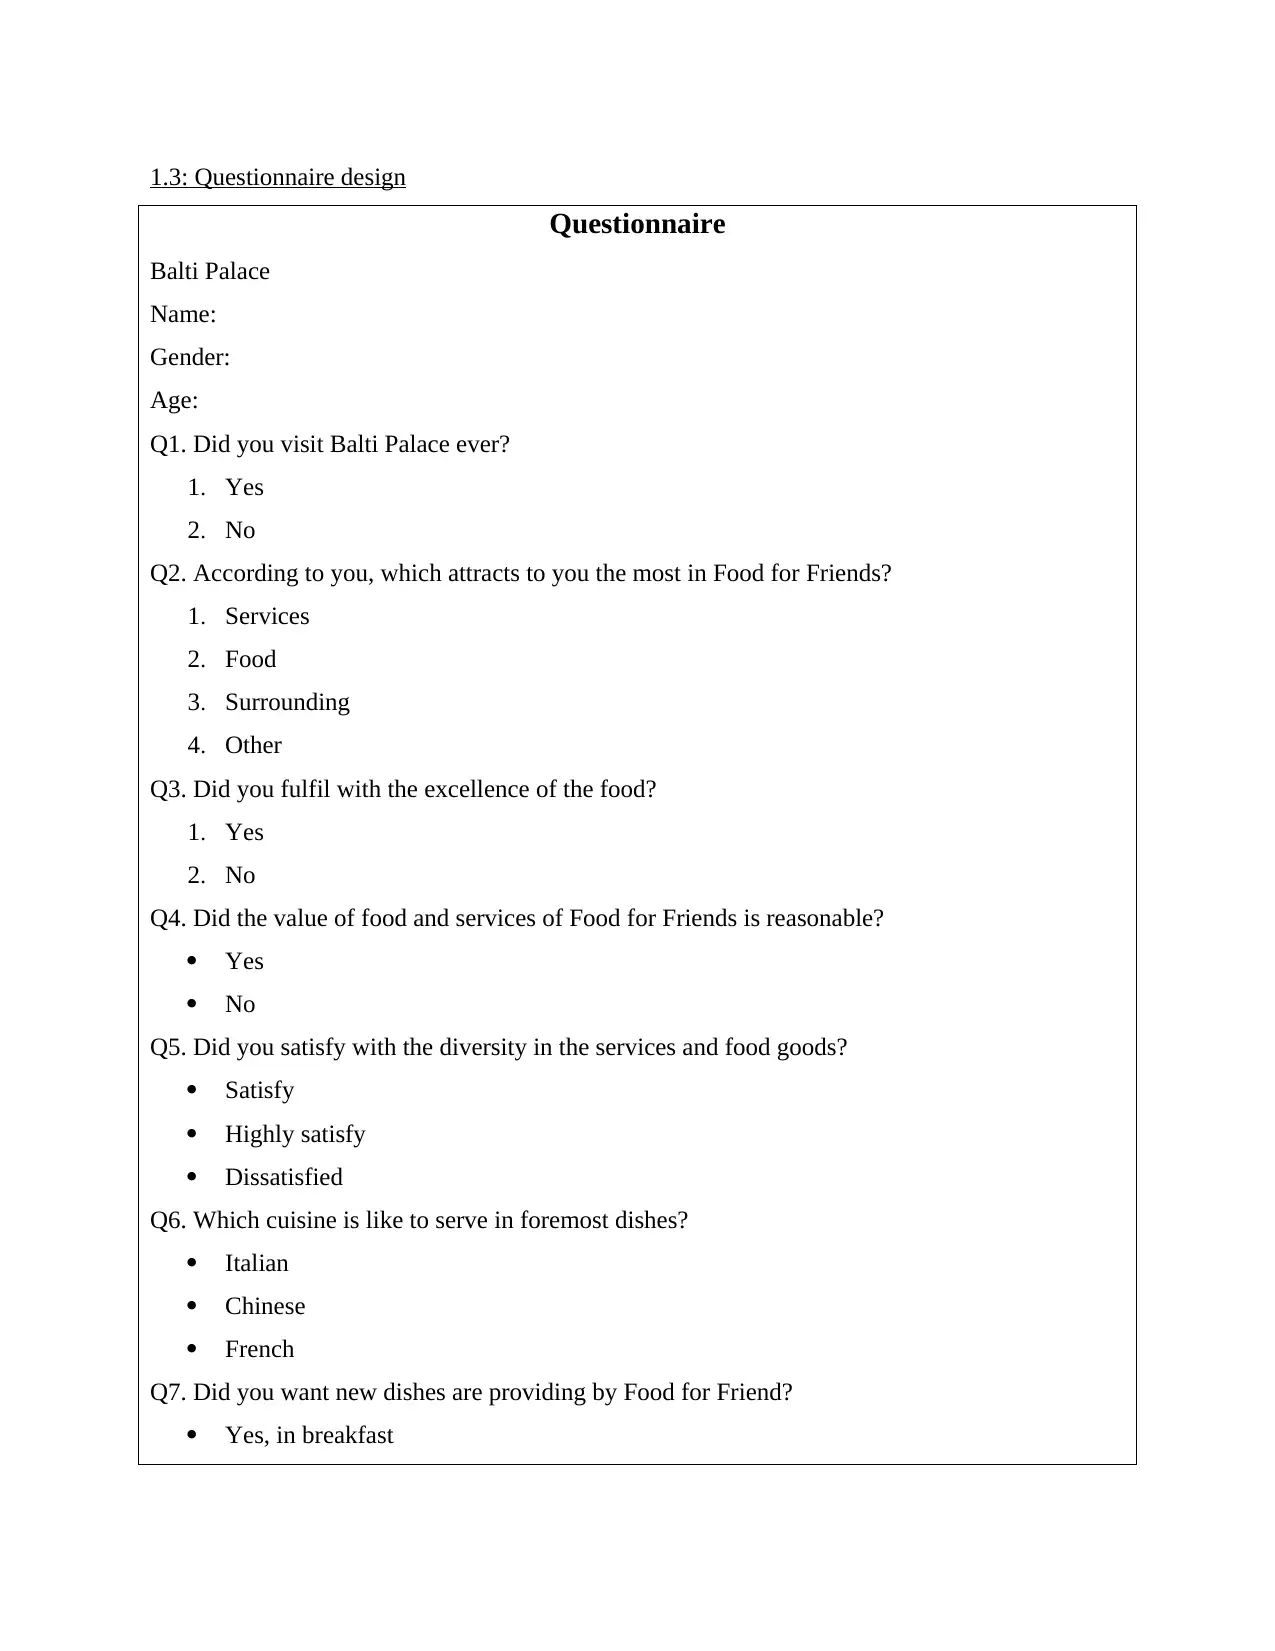
1.3: Questionnaire design
Questionnaire
Balti Palace
Name:
Gender:
Age:
Q1. Did you visit Balti Palace ever?
1. Yes
2. No
Q2. According to you, which attracts to you the most in Food for Friends?
1. Services
2. Food
3. Surrounding
4. Other
Q3. Did you fulfil with the excellence of the food?
1. Yes
2. No
Q4. Did the value of food and services of Food for Friends is reasonable?
Yes
No
Q5. Did you satisfy with the diversity in the services and food goods?
Satisfy
Highly satisfy
Dissatisfied
Q6. Which cuisine is like to serve in foremost dishes?
Italian
Chinese
French
Q7. Did you want new dishes are providing by Food for Friend?
Yes, in breakfast
Yes, in main course
No
Q8. Which location you want to start their new restaurant?
Prime location
Country side
Q9. Did you want to receive unique on festivals?
Agree
Disagree
Q10. Feel free by providing personnel opinion?
Ans:..
TASK 2
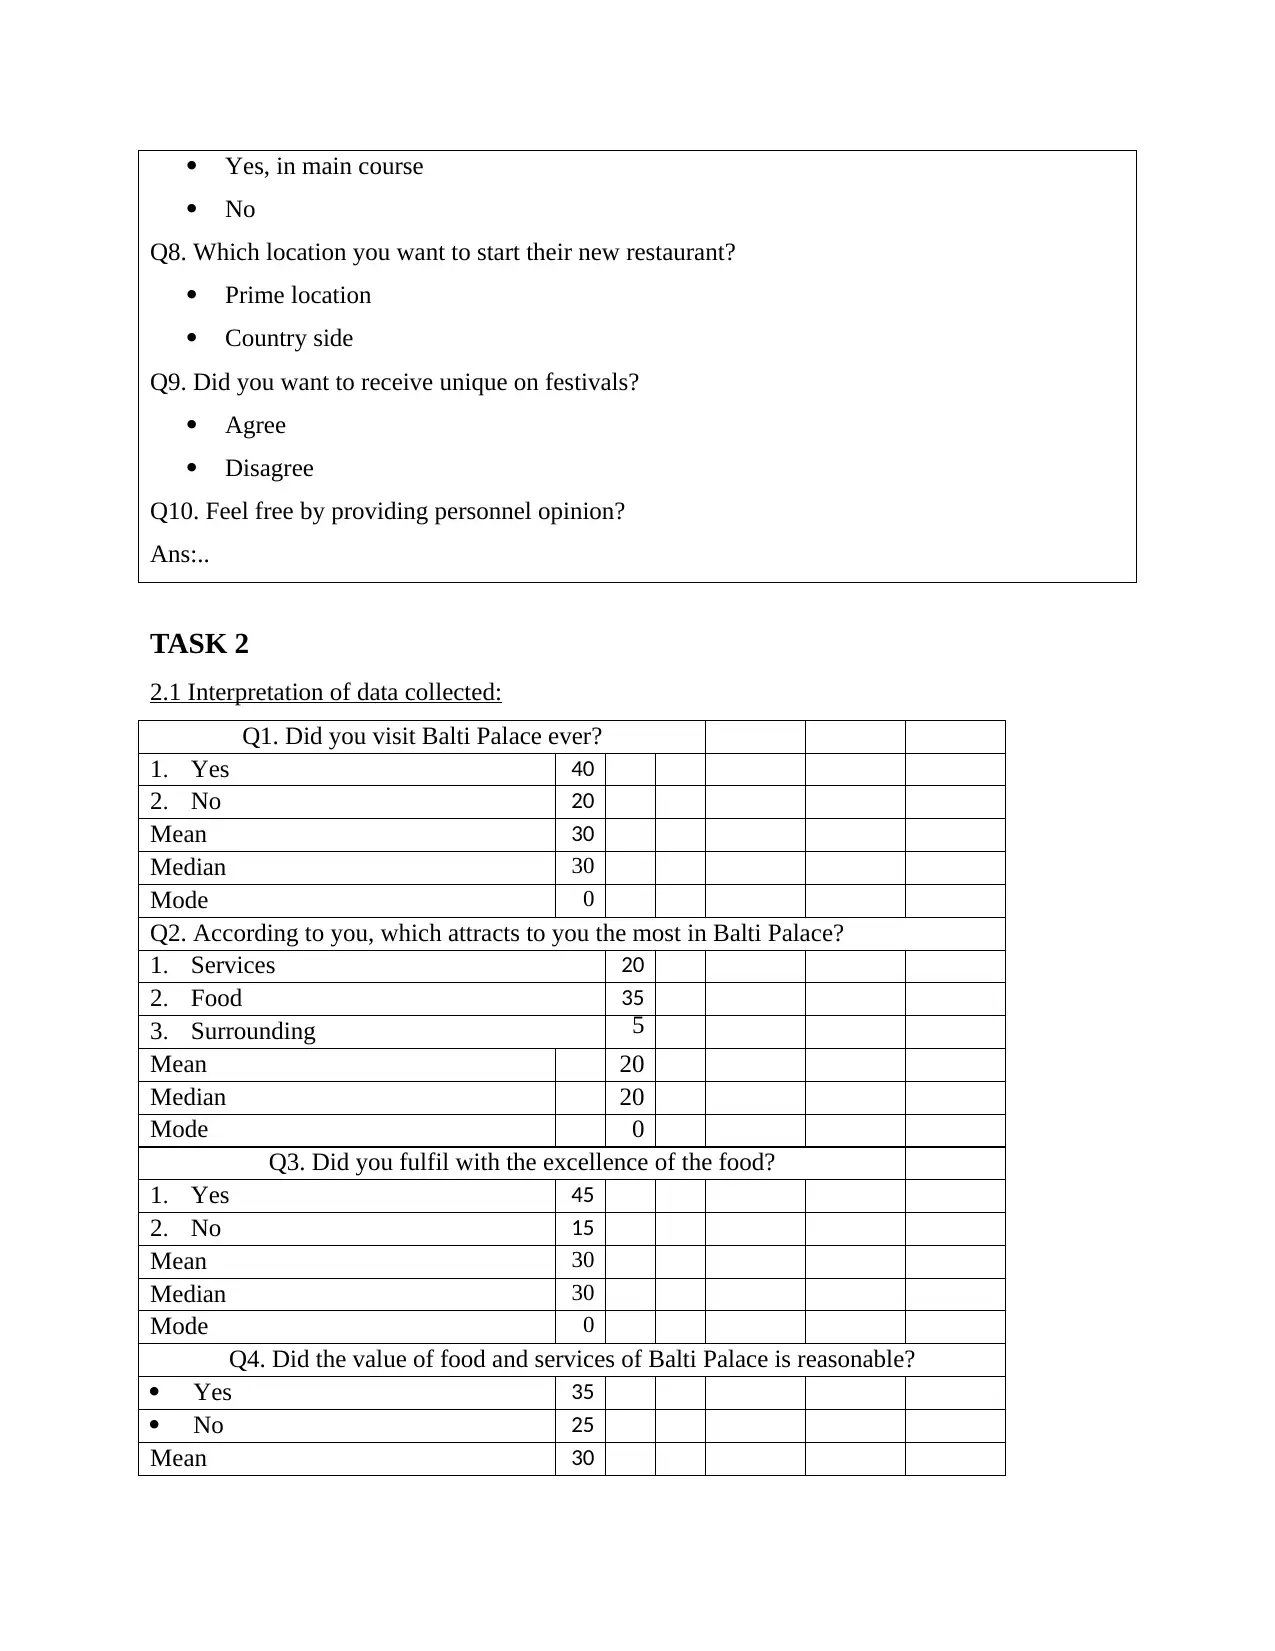
2.1 Interpretation of data collected:
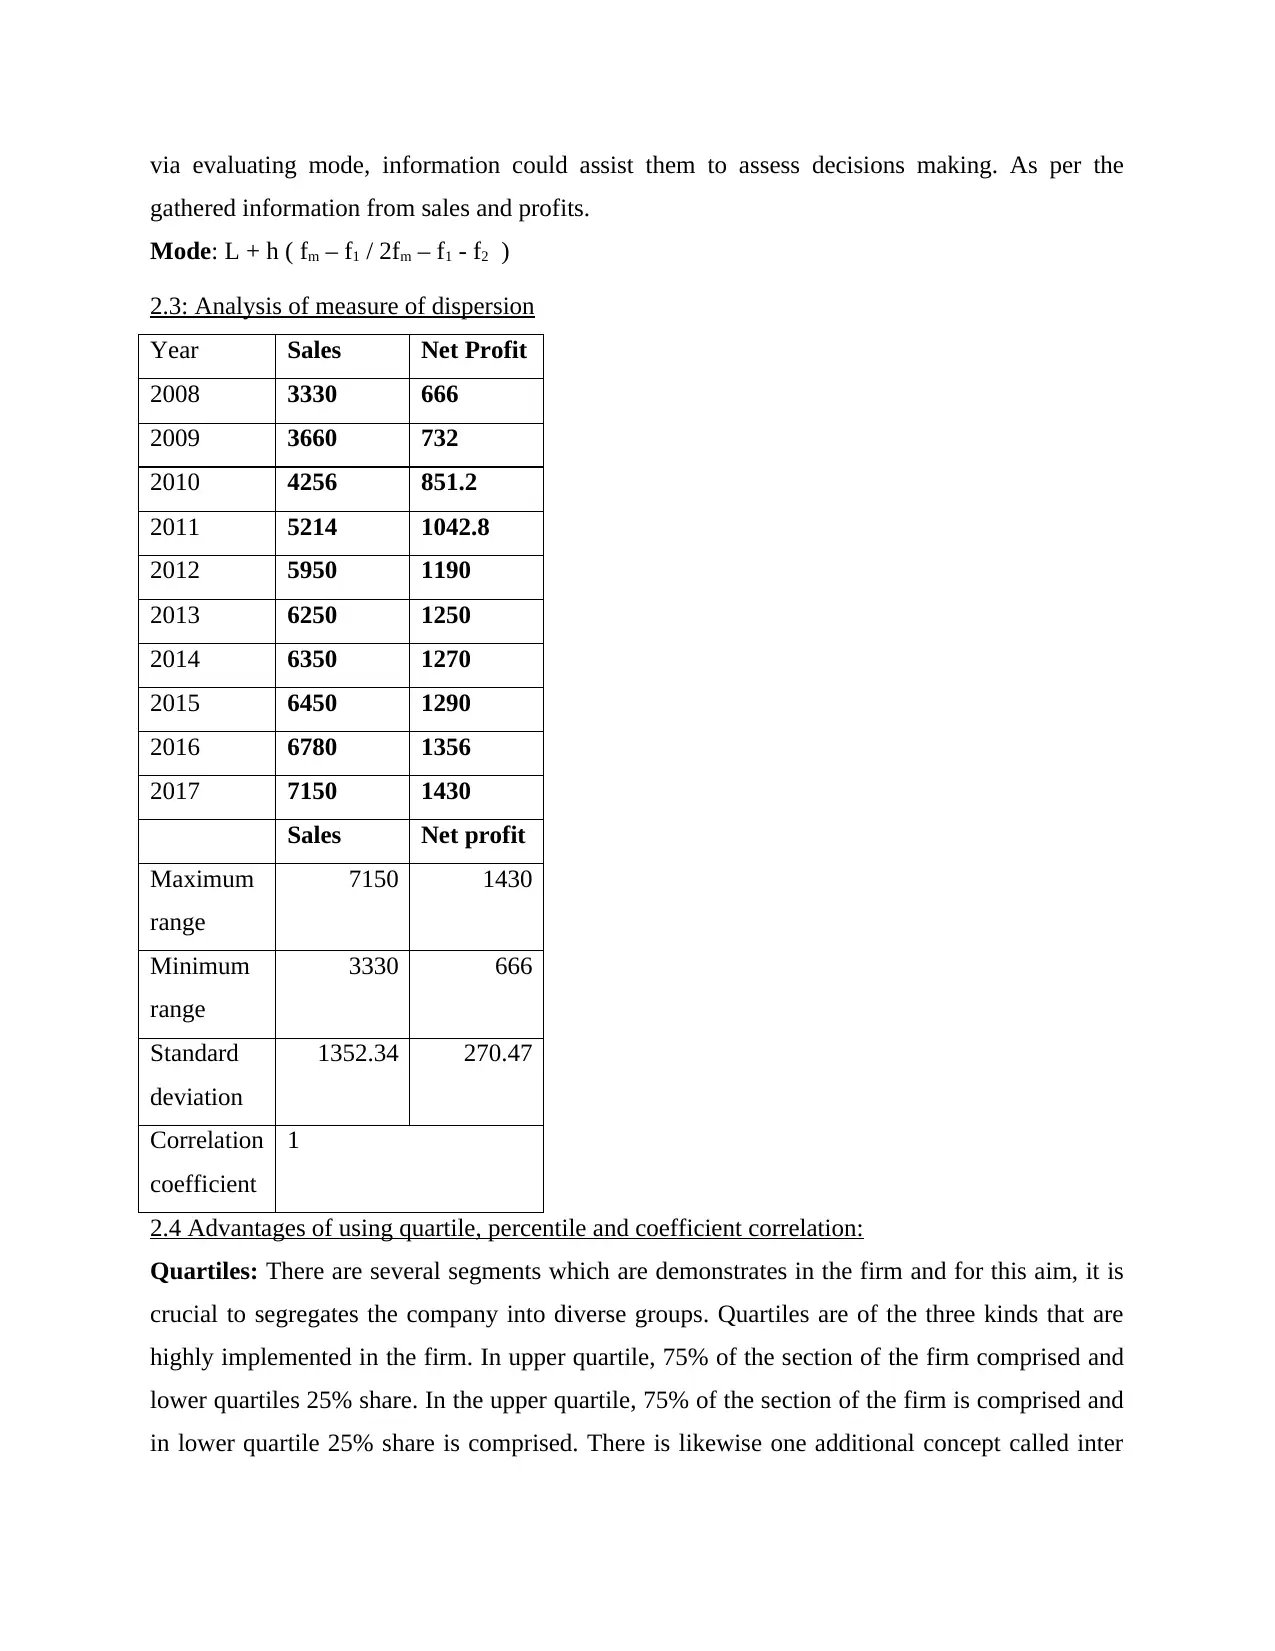
Q1. Did you visit Balti Palace ever?
1. Yes 40
2. No 20
Mean 30
Median 30
Mode 0
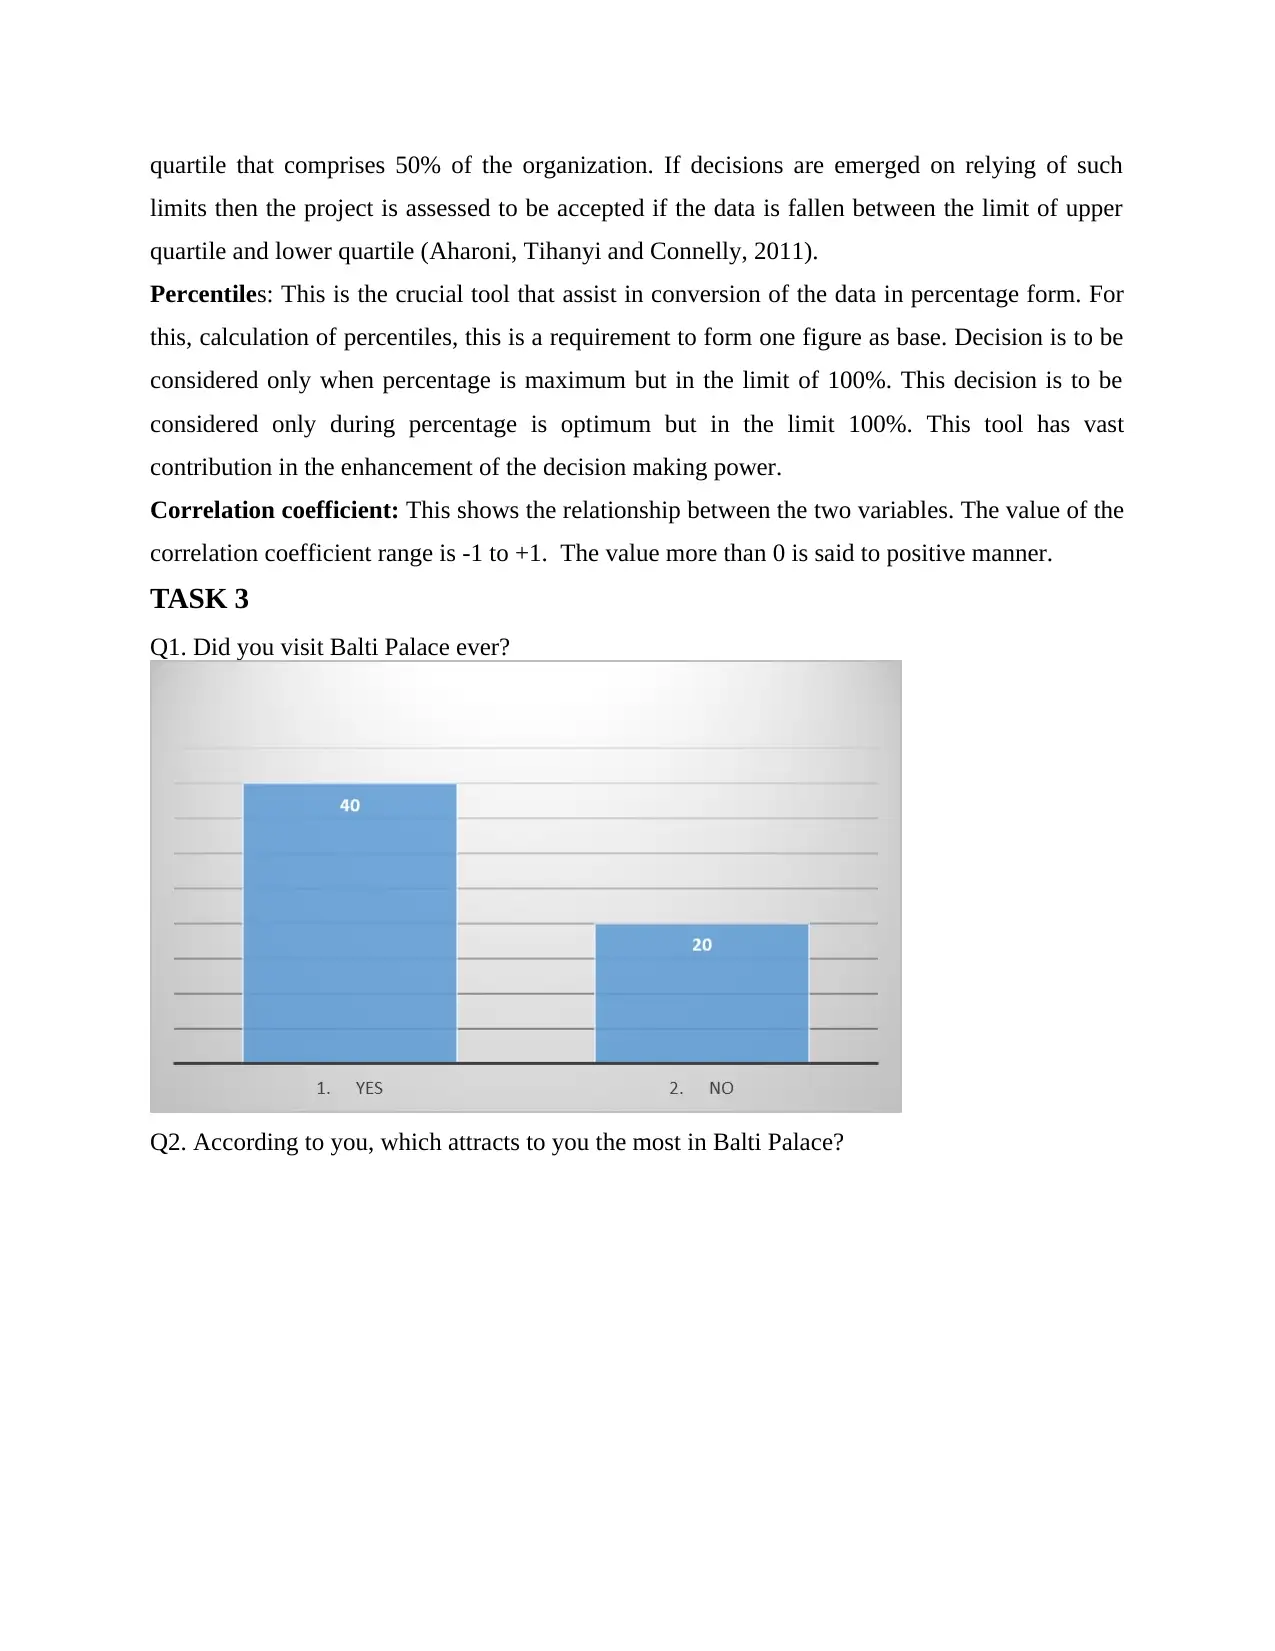
Q2. According to you, which attracts to you the most in Balti Palace?
1. Services 20
2. Food 35
3. Surrounding
Mean 20
Median 20
Mode 0
Q3. Did you fulfil with the excellence of the food?
1. Yes 45
2. No 15
Mean 30
Median 30
Mode 0
Q4. Did the value of food and services of Balti Palace is reasonable?
Yes 35
No 25
Mean 30
No
Q8. Which location you want to start their new restaurant?
Prime location
Country side
Q9. Did you want to receive unique on festivals?
Agree
Disagree
Q10. Feel free by providing personnel opinion?
Ans:..
TASK 2
2.1 Interpretation of data collected:
Q1. Did you visit Balti Palace ever?
1. Yes 40
2. No 20
Mean 30
Median 30
Mode 0
Q2. According to you, which attracts to you the most in Balti Palace?
1. Services 20
2. Food 35
3. Surrounding
Mean 20
Median 20
Mode 0
Q3. Did you fulfil with the excellence of the food?
1. Yes 45
2. No 15
Mean 30
Median 30
Mode 0
Q4. Did the value of food and services of Balti Palace is reasonable?
Yes 35
No 25
Mean 30
⊘ This is a preview!⊘
Do you want full access?
Subscribe today to unlock all pages.
Trusted by 1+ million students worldwide
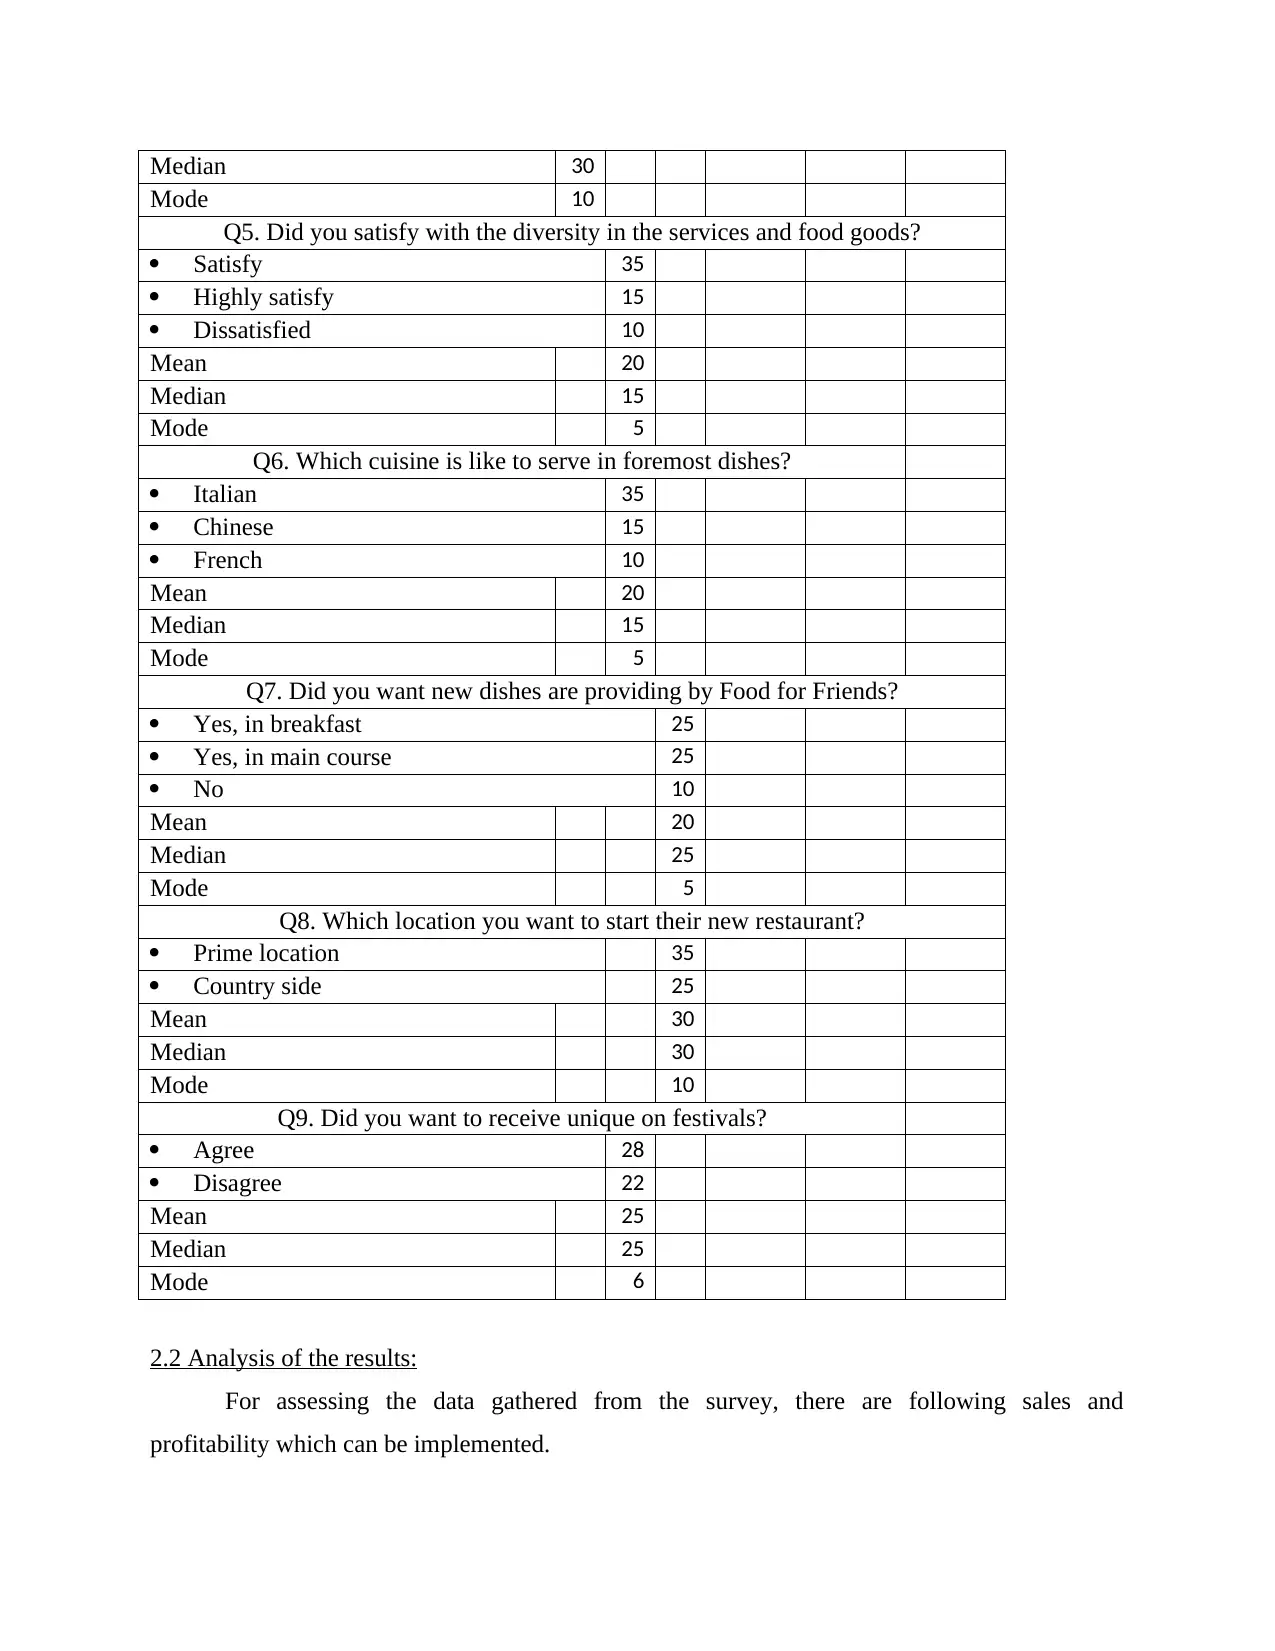
Median 30
Mode 10
Q5. Did you satisfy with the diversity in the services and food goods?
Satisfy 35
Highly satisfy 15
Dissatisfied 10
Mean 20
Median 15
Mode 5
Q6. Which cuisine is like to serve in foremost dishes?
Italian 35
Chinese 15
French 10
Mean 20
Median 15
Mode 5
Q7. Did you want new dishes are providing by Food for Friends?
Yes, in breakfast 25
Yes, in main course 25
No 10
Mean 20
Median 25
Mode 5
Q8. Which location you want to start their new restaurant?
Prime location 35
Country side 25
Mean 30
Median 30
Mode 10
Q9. Did you want to receive unique on festivals?
Agree 28
Disagree 22
Mean 25
Median 25
Mode 6
2.2 Analysis of the results:
For assessing the data gathered from the survey, there are following sales and
profitability which can be implemented.
Mode 10
Q5. Did you satisfy with the diversity in the services and food goods?
Satisfy 35
Highly satisfy 15
Dissatisfied 10
Mean 20
Median 15
Mode 5
Q6. Which cuisine is like to serve in foremost dishes?
Italian 35
Chinese 15
French 10
Mean 20
Median 15
Mode 5
Q7. Did you want new dishes are providing by Food for Friends?
Yes, in breakfast 25
Yes, in main course 25
No 10
Mean 20
Median 25
Mode 5
Q8. Which location you want to start their new restaurant?
Prime location 35
Country side 25
Mean 30
Median 30
Mode 10
Q9. Did you want to receive unique on festivals?
Agree 28
Disagree 22
Mean 25
Median 25
Mode 6
2.2 Analysis of the results:
For assessing the data gathered from the survey, there are following sales and
profitability which can be implemented.
Paraphrase This Document
Need a fresh take? Get an instant paraphrase of this document with our AI Paraphraser
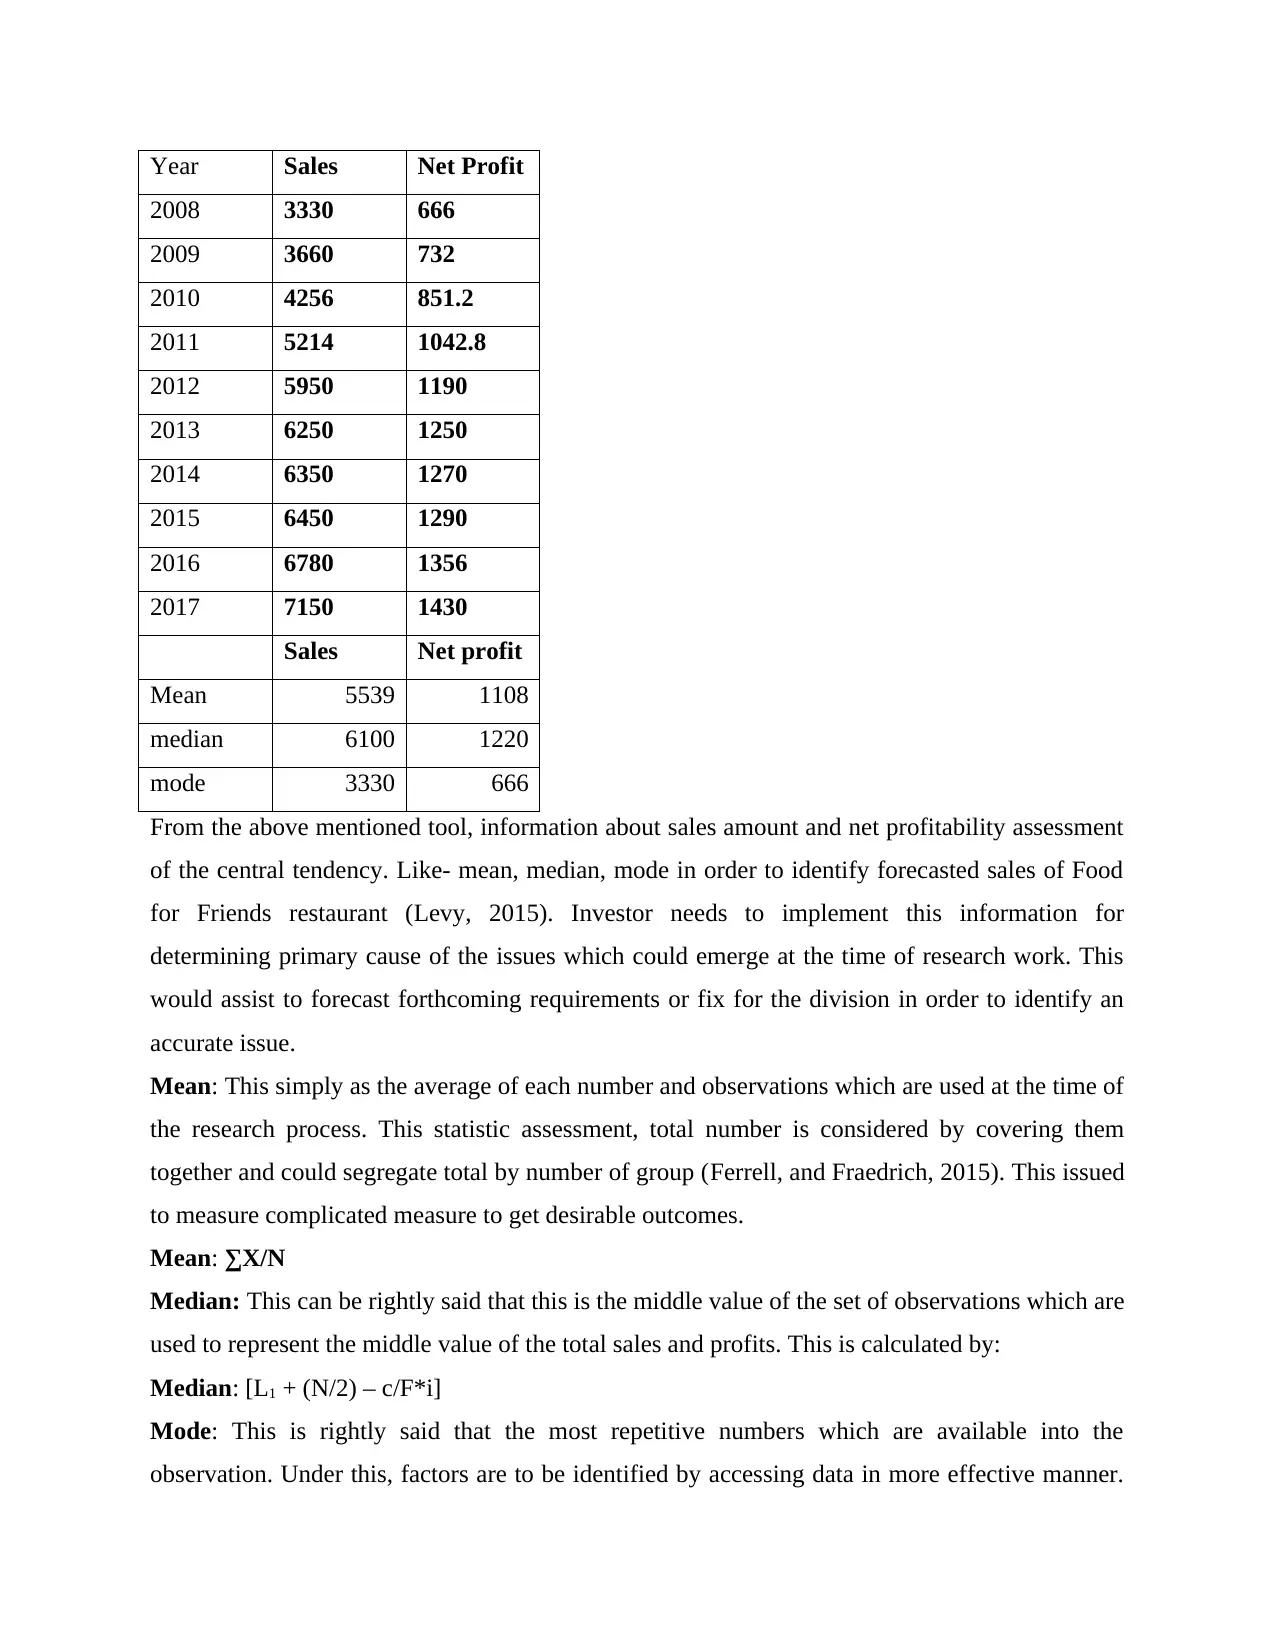
Year Sales Net Profit
2008 3330 666
2009 3660 732
2010 4256 851.2
2011 5214 1042.8
2012 5950 1190
2013 6250 1250
2014 6350 1270
2015 6450 1290
2016 6780 1356
2017 7150 1430
Sales Net profit
Mean 5539 1108
median 6100 1220
mode 3330 666
From the above mentioned tool, information about sales amount and net profitability assessment
of the central tendency. Like- mean, median, mode in order to identify forecasted sales of Food
for Friends restaurant (Levy, 2015). Investor needs to implement this information for
determining primary cause of the issues which could emerge at the time of research work. This
would assist to forecast forthcoming requirements or fix for the division in order to identify an
accurate issue.
Mean: This simply as the average of each number and observations which are used at the time of
the research process. This statistic assessment, total number is considered by covering them
together and could segregate total by number of group (Ferrell, and Fraedrich, 2015). This issued
to measure complicated measure to get desirable outcomes.
Mean: ∑X/N
Median: This can be rightly said that this is the middle value of the set of observations which are
used to represent the middle value of the total sales and profits. This is calculated by:
Median: [L1 + (N/2) – c/F*i]
Mode: This is rightly said that the most repetitive numbers which are available into the
observation. Under this, factors are to be identified by accessing data in more effective manner.
via evaluating mode, information could assist them to assess decisions making. As per the
gathered information from sales and profits.
Mode: L + h ( fm – f1 / 2fm – f1 - f2 )
2.3: Analysis of measure of dispersion
Year Sales Net Profit
2008 3330 666
2009 3660 732
2010 4256 851.2
2011 5214 1042.8
2012 5950 1190
2013 6250 1250
2014 6350 1270
2015 6450 1290
2016 6780 1356
2017 7150 1430
Sales Net profit
Maximum
range
7150 1430
Minimum
range
3330 666
Standard
deviation
1352.34 270.47
Correlation
coefficient
1
2.4 Advantages of using quartile, percentile and coefficient correlation:
Quartiles: There are several segments which are demonstrates in the firm and for this aim, it is
crucial to segregates the company into diverse groups. Quartiles are of the three kinds that are
highly implemented in the firm. In upper quartile, 75% of the section of the firm comprised and
lower quartiles 25% share. In the upper quartile, 75% of the section of the firm is comprised and
in lower quartile 25% share is comprised. There is likewise one additional concept called inter
⊘ This is a preview!⊘
Do you want full access?
Subscribe today to unlock all pages.
Trusted by 1+ million students worldwide
quartile that comprises 50% of the organization. If decisions are emerged on relying of such
limits then the project is assessed to be accepted if the data is fallen between the limit of upper
quartile and lower quartile (Aharoni, Tihanyi and Connelly, 2011).
Percentiles: This is the crucial tool that assist in conversion of the data in percentage form. For
this, calculation of percentiles, this is a requirement to form one figure as base. Decision is to be
considered only when percentage is maximum but in the limit of 100%. This decision is to be
considered only during percentage is optimum but in the limit 100%. This tool has vast
contribution in the enhancement of the decision making power.
Correlation coefficient: This shows the relationship between the two variables. The value of the
correlation coefficient range is -1 to +1. The value more than 0 is said to positive manner.
TASK 3
Q1. Did you visit Balti Palace ever?
Q2. According to you, which attracts to you the most in Balti Palace?
Paraphrase This Document
Need a fresh take? Get an instant paraphrase of this document with our AI Paraphraser
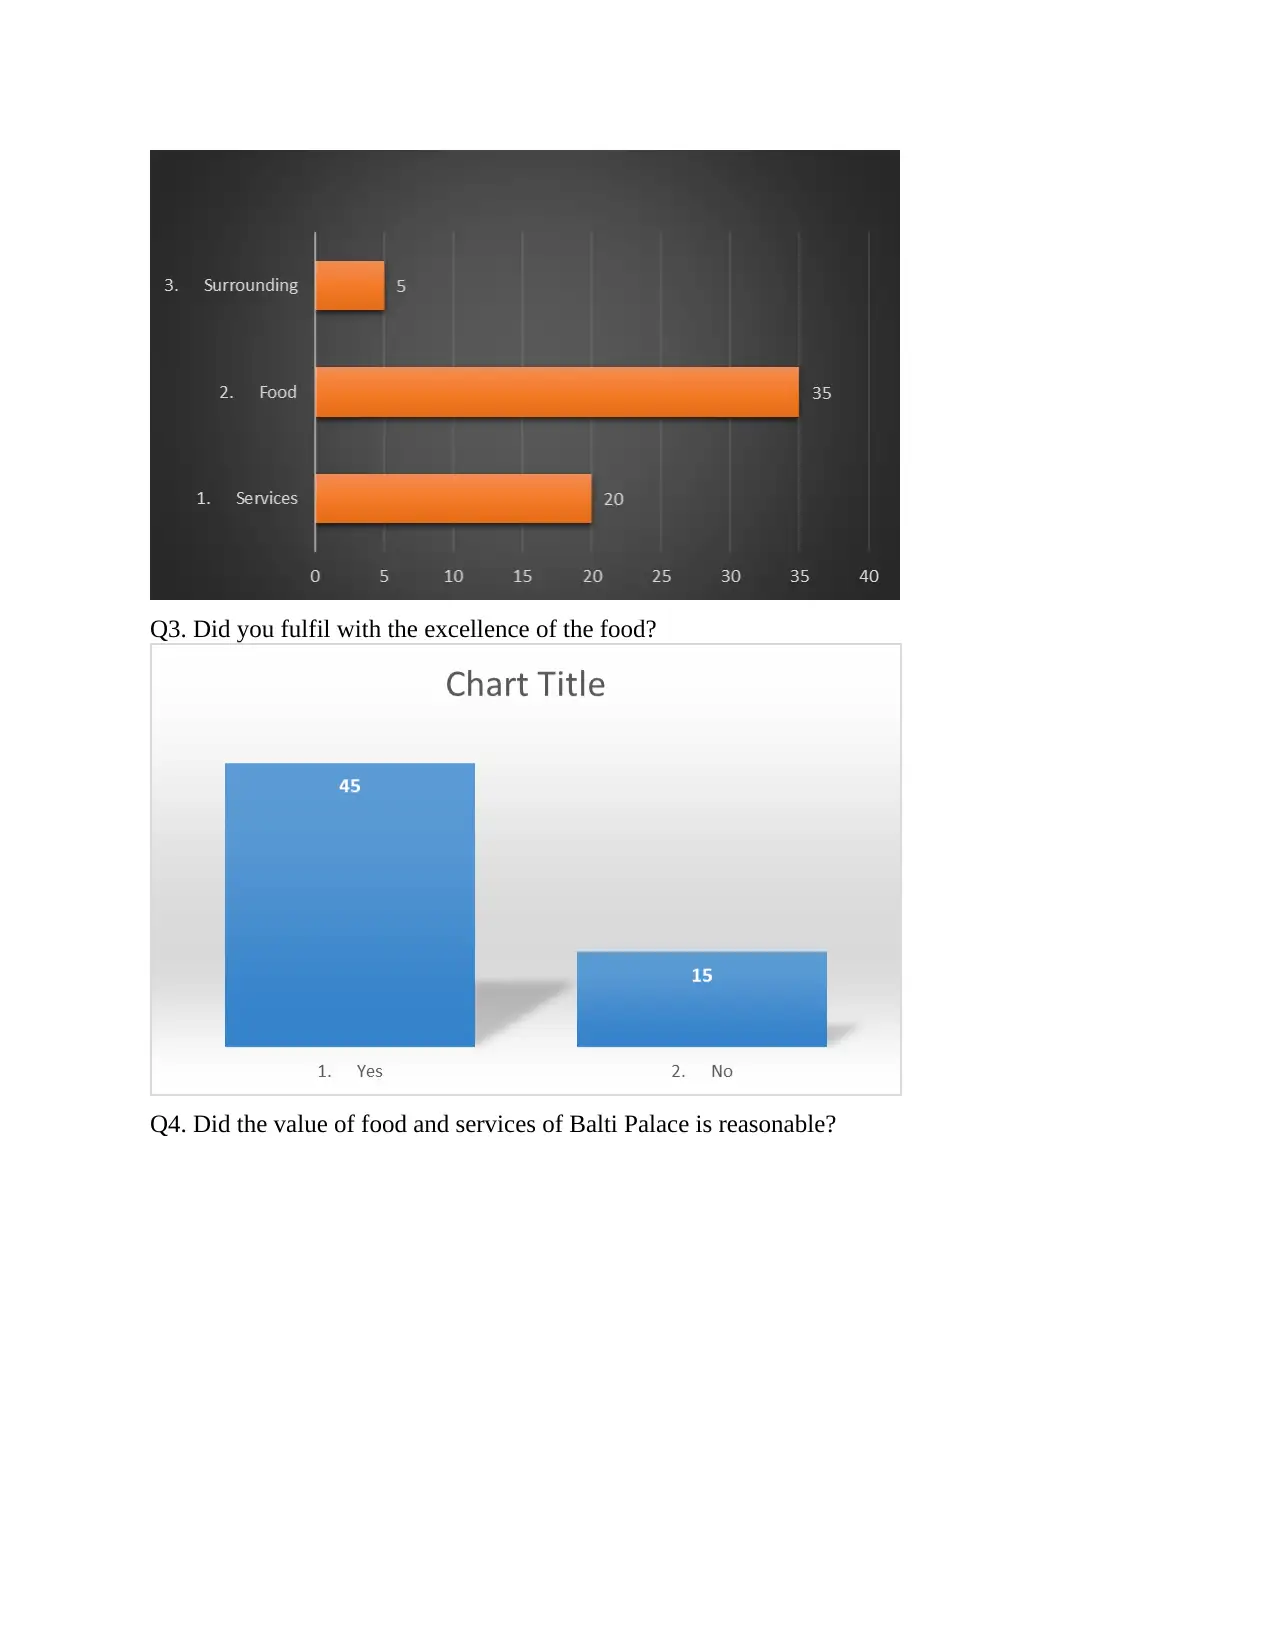
Q3. Did you fulfil with the excellence of the food?
Q4. Did the value of food and services of Balti Palace is reasonable?
Q4. Did the value of food and services of Balti Palace is reasonable?
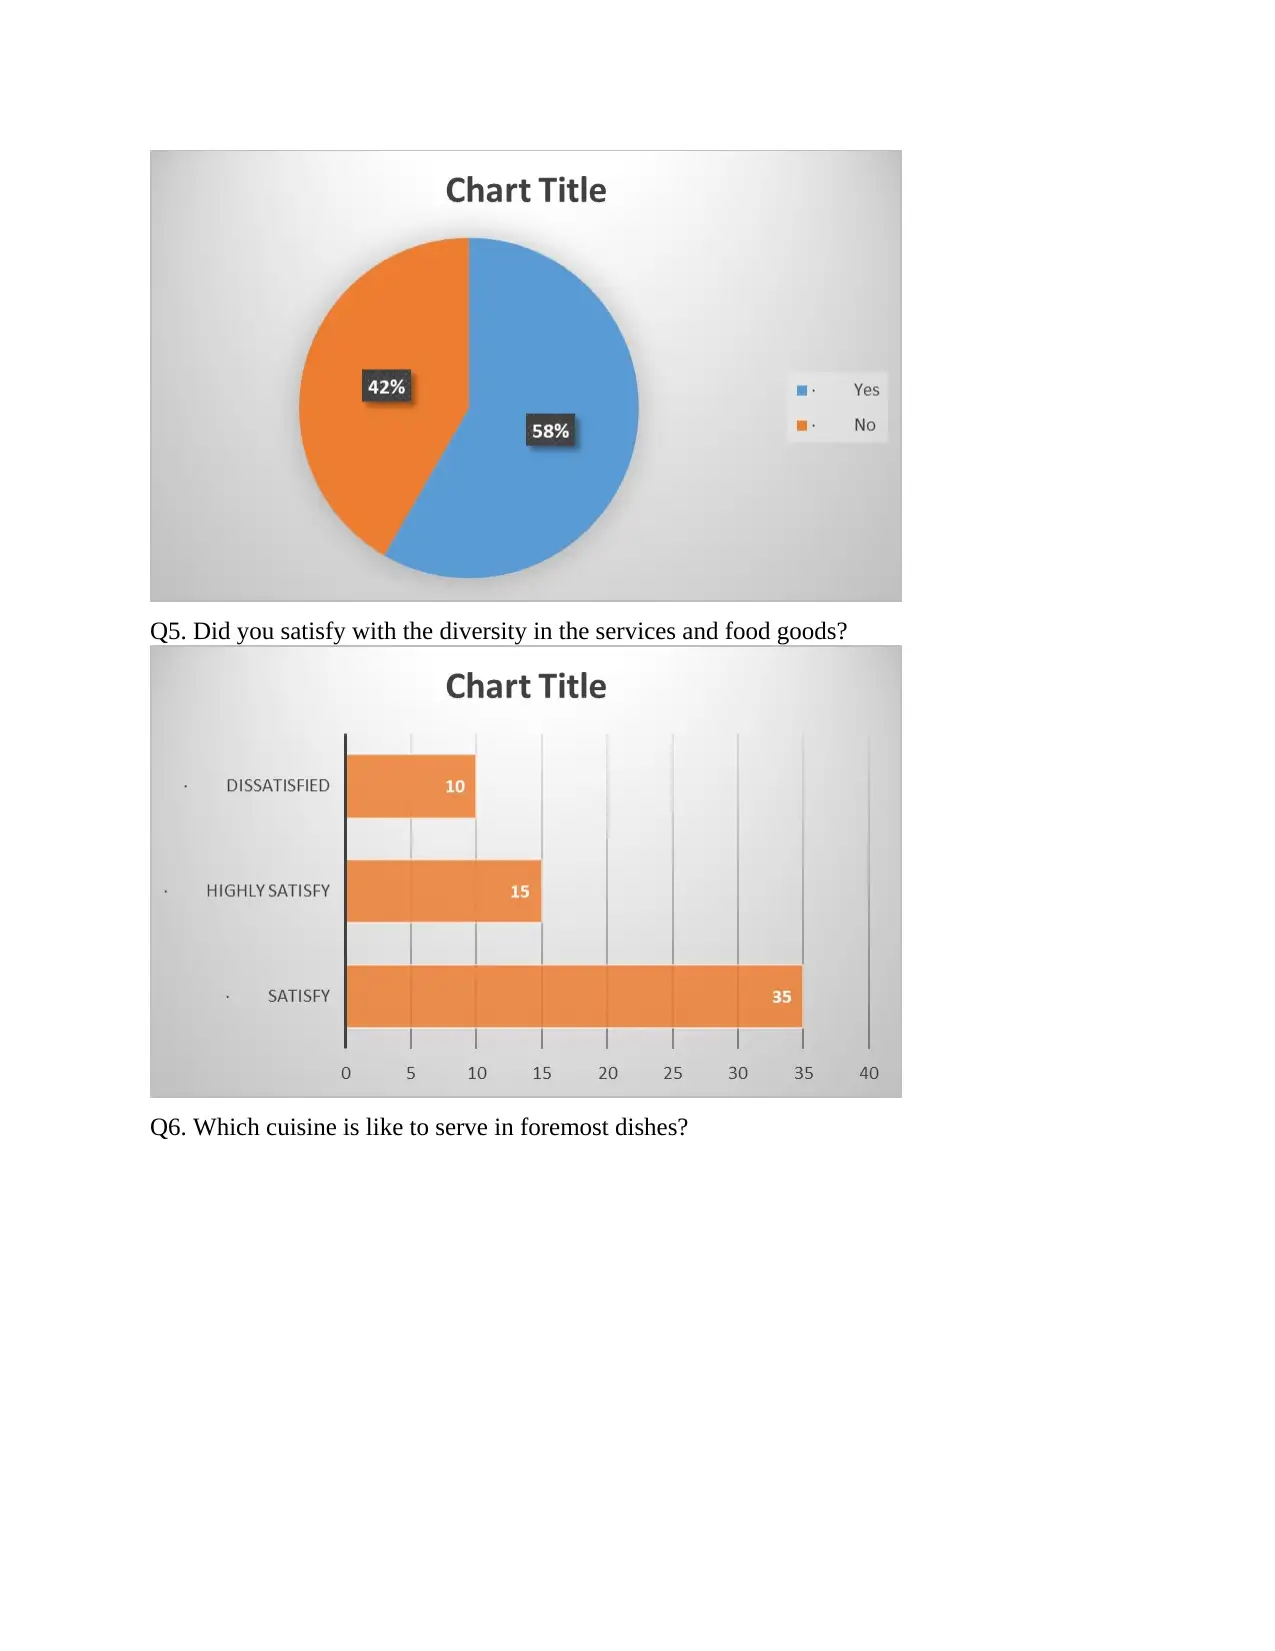
Q5. Did you satisfy with the diversity in the services and food goods?
Q6. Which cuisine is like to serve in foremost dishes?
Q6. Which cuisine is like to serve in foremost dishes?
⊘ This is a preview!⊘
Do you want full access?
Subscribe today to unlock all pages.
Trusted by 1+ million students worldwide
1 out of 20
Related Documents


Your All-in-One AI-Powered Toolkit for Academic Success.
+13062052269
info@desklib.com
Available 24*7 on WhatsApp / Email
![[object Object]](/_next/static/media/star-bottom.7253800d.svg)
Unlock your academic potential
Copyright © 2020–2026 A2Z Services. All Rights Reserved. Developed and managed by ZUCOL.