Business Decision Making Report: Data Analysis for Business Growth
VerifiedAdded on 2020/06/04
|18
|3846
|428
Report
AI Summary
This report delves into the crucial aspects of business decision-making, focusing on data collection, analysis, and presentation. The report begins by outlining the creation of plans for gathering both primary and secondary data, including survey methodologies, sampling frames, and questionnaire design. It then progresses to data analysis techniques, covering measures of central tendency, dispersion, and the use of quartiles, percentiles, and correlation coefficients. Furthermore, the report demonstrates the production of graphs using spreadsheets, the formulation of trend lines, and the creation of business presentations and formal reports to disseminate information. The final sections discuss the application of appropriate information tools and the preparation of project plans and financial tools in the decision-making process, providing a comprehensive overview of data-driven business strategies.

Business Decision Making
Paraphrase This Document
Need a fresh take? Get an instant paraphrase of this document with our AI Paraphraser
Table of Contents
INTRODUCTION...........................................................................................................................1
TASK 1............................................................................................................................................1
1.1 Creation of plan for collecting primary and secondary data.................................................1
1.2 Survey methodology and sample framing used for research................................................2
1.3 Designing of a questionnaire for collection of information..................................................3
2.1 Creation of information on the basis of collected data.........................................................4
2.2 Use of measure of central tendency in relation to derive an appropriate result....................4
2.3 Analysis of measure of dispersion with standard deviation..................................................5
2.4 Use of quartile, percentile and correlation coefficient for data calculation..........................6
TASK 2............................................................................................................................................6
3.1 Graph production through using spreadsheet........................................................................6
3.2 Formulation of trend lines in order to determine the result..................................................8
3.3 Business presentation for dissemination of information.....................................................10
3.4 Produce a formal business report........................................................................................11
TASK 3..........................................................................................................................................12
4.1 Use of appropriate information tool....................................................................................12
4.2 Prepare a project plan for an activity to determine the time frame.....................................13
4.3 Use financial tools in decision making process..................................................................14
CONCLUSION..............................................................................................................................15
REFERENCES..............................................................................................................................16
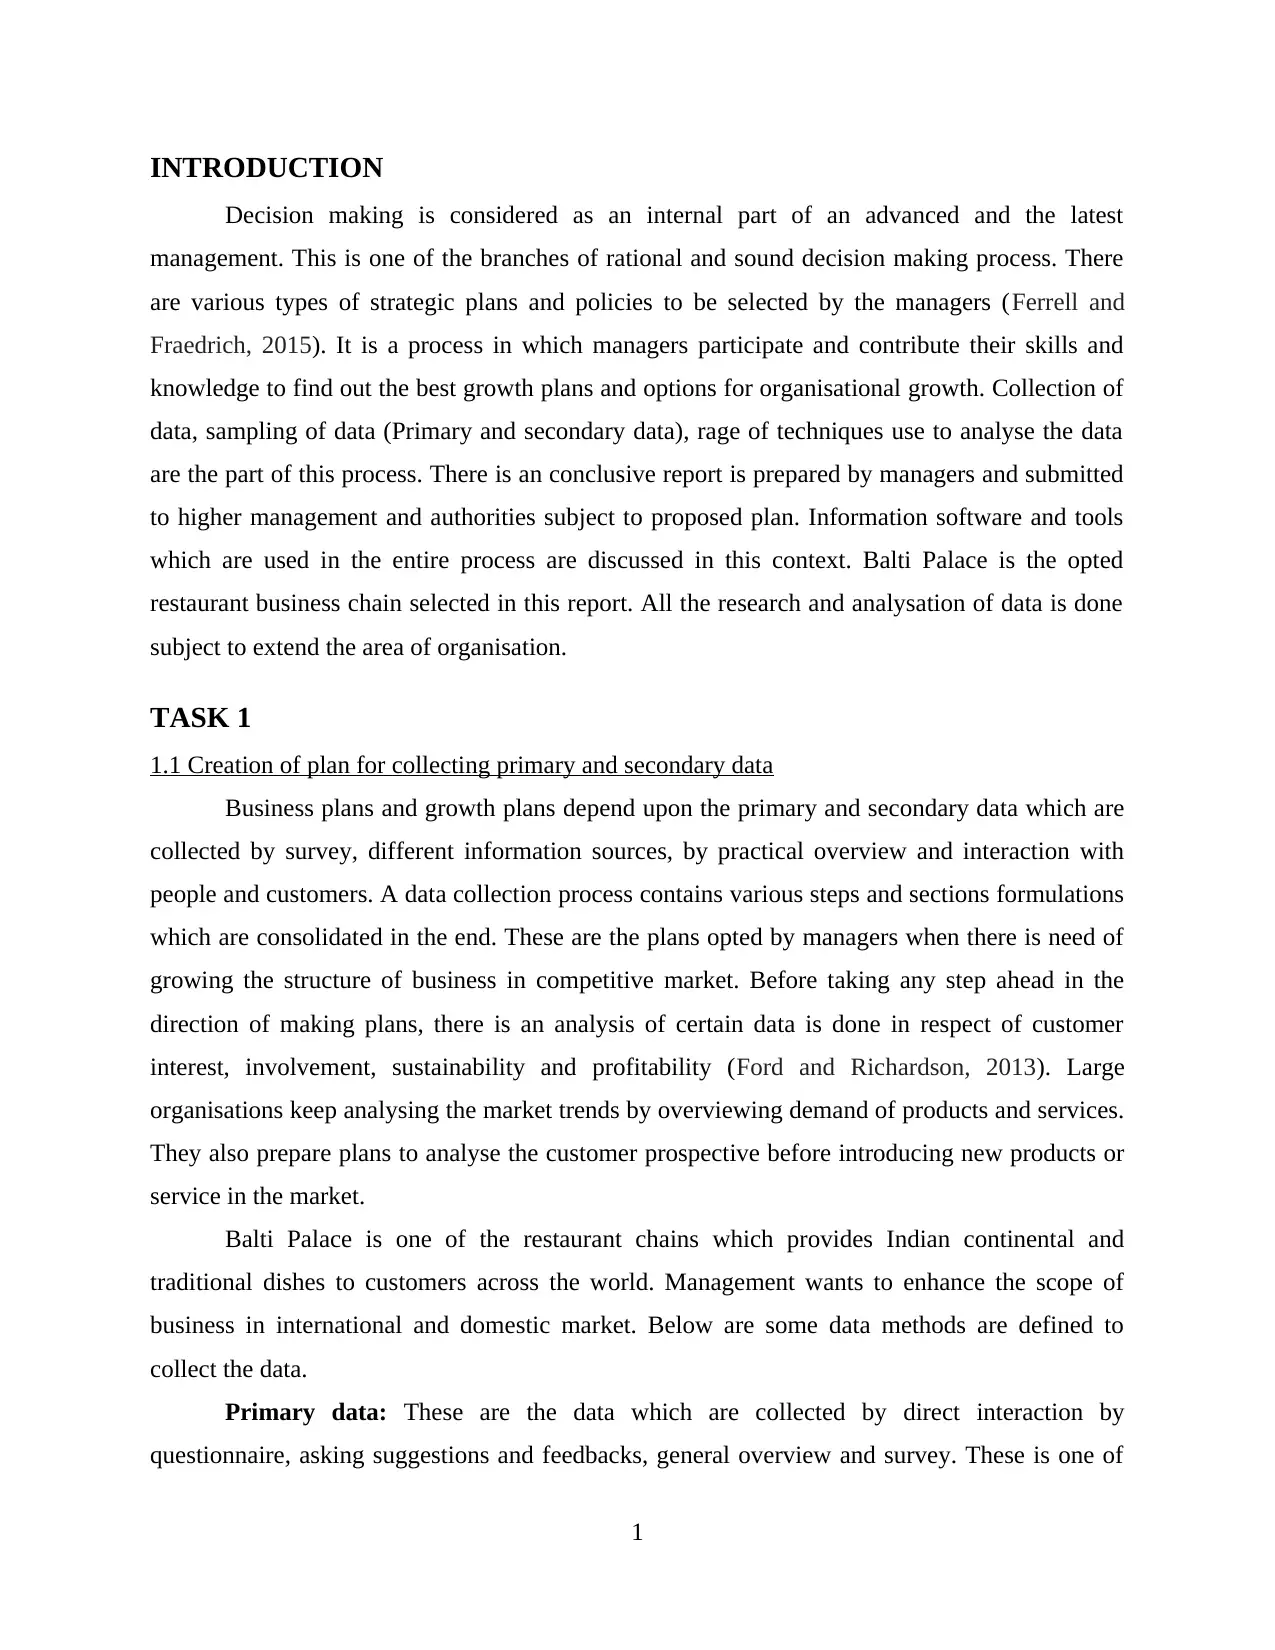
INTRODUCTION
Decision making is considered as an internal part of an advanced and the latest
management. This is one of the branches of rational and sound decision making process. There
are various types of strategic plans and policies to be selected by the managers (Ferrell and
Fraedrich, 2015). It is a process in which managers participate and contribute their skills and
knowledge to find out the best growth plans and options for organisational growth. Collection of
data, sampling of data (Primary and secondary data), rage of techniques use to analyse the data
are the part of this process. There is an conclusive report is prepared by managers and submitted
to higher management and authorities subject to proposed plan. Information software and tools
which are used in the entire process are discussed in this context. Balti Palace is the opted
restaurant business chain selected in this report. All the research and analysation of data is done
subject to extend the area of organisation.
TASK 1
1.1 Creation of plan for collecting primary and secondary data
Business plans and growth plans depend upon the primary and secondary data which are
collected by survey, different information sources, by practical overview and interaction with
people and customers. A data collection process contains various steps and sections formulations
which are consolidated in the end. These are the plans opted by managers when there is need of
growing the structure of business in competitive market. Before taking any step ahead in the
direction of making plans, there is an analysis of certain data is done in respect of customer
interest, involvement, sustainability and profitability (Ford and Richardson, 2013). Large
organisations keep analysing the market trends by overviewing demand of products and services.
They also prepare plans to analyse the customer prospective before introducing new products or
service in the market.
Balti Palace is one of the restaurant chains which provides Indian continental and
traditional dishes to customers across the world. Management wants to enhance the scope of
business in international and domestic market. Below are some data methods are defined to
collect the data.
Primary data: These are the data which are collected by direct interaction by
questionnaire, asking suggestions and feedbacks, general overview and survey. These is one of
1
⊘ This is a preview!⊘
Do you want full access?
Subscribe today to unlock all pages.
Trusted by 1+ million students worldwide
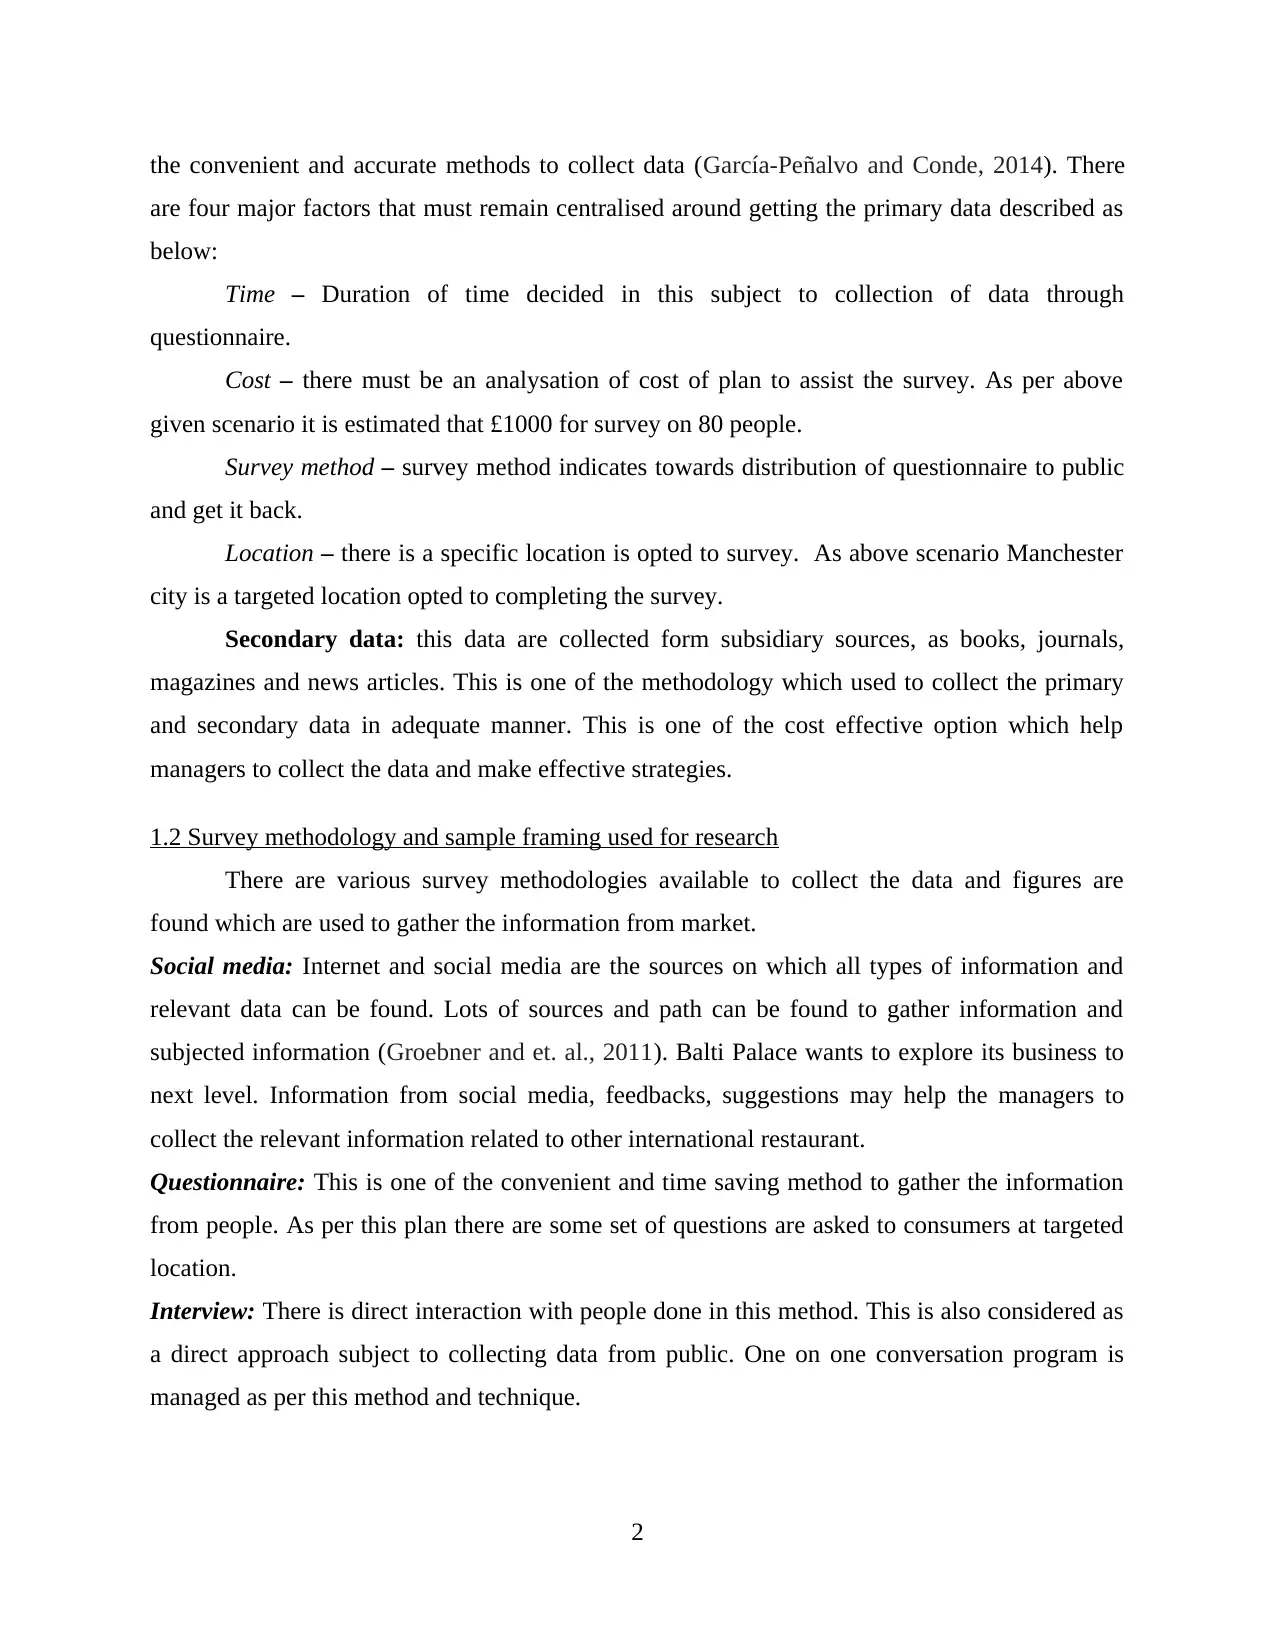
the convenient and accurate methods to collect data (García-Peñalvo and Conde, 2014). There
are four major factors that must remain centralised around getting the primary data described as
below:
Time – Duration of time decided in this subject to collection of data through
questionnaire.
Cost – there must be an analysation of cost of plan to assist the survey. As per above
given scenario it is estimated that £1000 for survey on 80 people.
Survey method – survey method indicates towards distribution of questionnaire to public
and get it back.
Location – there is a specific location is opted to survey. As above scenario Manchester
city is a targeted location opted to completing the survey.
Secondary data: this data are collected form subsidiary sources, as books, journals,
magazines and news articles. This is one of the methodology which used to collect the primary
and secondary data in adequate manner. This is one of the cost effective option which help
managers to collect the data and make effective strategies.
1.2 Survey methodology and sample framing used for research
There are various survey methodologies available to collect the data and figures are
found which are used to gather the information from market.
Social media: Internet and social media are the sources on which all types of information and
relevant data can be found. Lots of sources and path can be found to gather information and
subjected information (Groebner and et. al., 2011). Balti Palace wants to explore its business to
next level. Information from social media, feedbacks, suggestions may help the managers to
collect the relevant information related to other international restaurant.
Questionnaire: This is one of the convenient and time saving method to gather the information
from people. As per this plan there are some set of questions are asked to consumers at targeted
location.
Interview: There is direct interaction with people done in this method. This is also considered as
a direct approach subject to collecting data from public. One on one conversation program is
managed as per this method and technique.
2
Paraphrase This Document
Need a fresh take? Get an instant paraphrase of this document with our AI Paraphraser
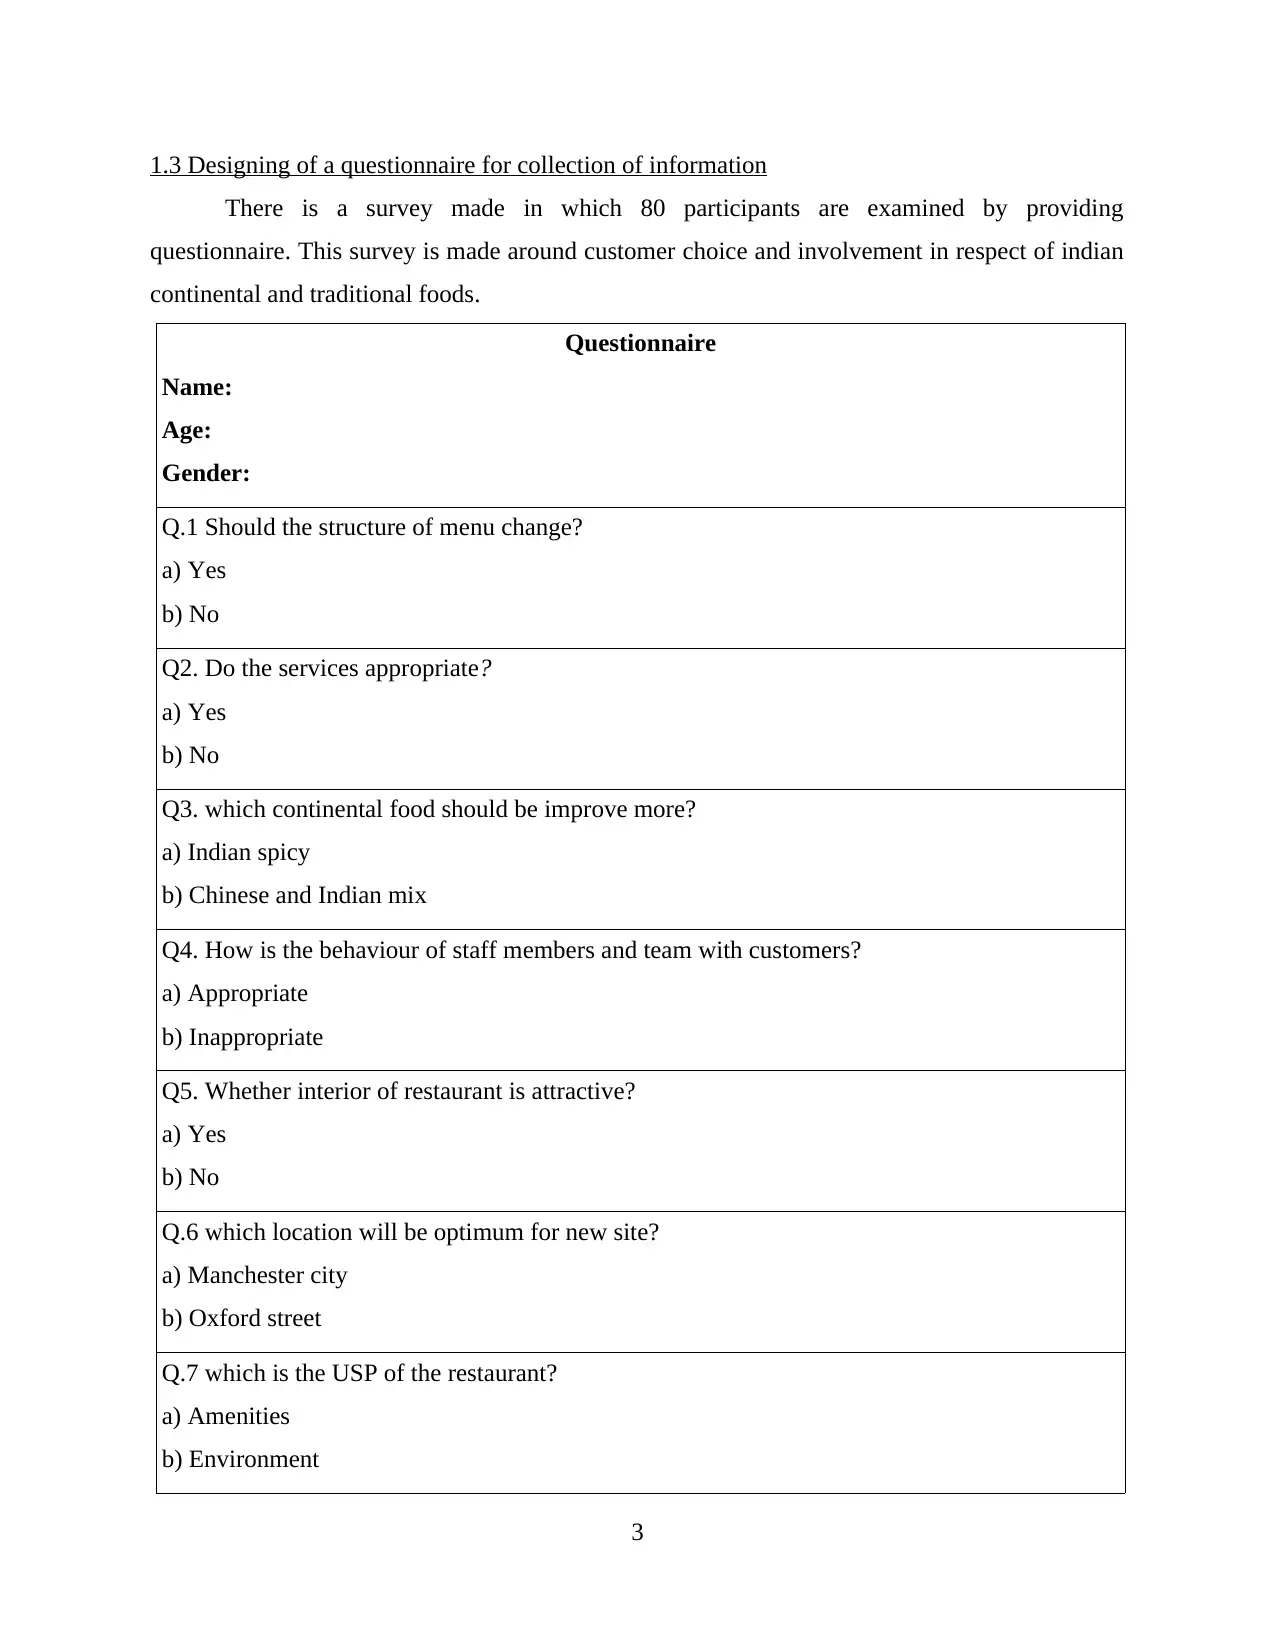
1.3 Designing of a questionnaire for collection of information
There is a survey made in which 80 participants are examined by providing
questionnaire. This survey is made around customer choice and involvement in respect of indian
continental and traditional foods.
Questionnaire
Name:
Age:
Gender:
Q.1 Should the structure of menu change?
a) Yes
b) No
Q2. Do the services appropriate?
a) Yes
b) No
Q3. which continental food should be improve more?
a) Indian spicy
b) Chinese and Indian mix
Q4. How is the behaviour of staff members and team with customers?
a) Appropriate
b) Inappropriate
Q5. Whether interior of restaurant is attractive?
a) Yes
b) No
Q.6 which location will be optimum for new site?
a) Manchester city
b) Oxford street
Q.7 which is the USP of the restaurant?
a) Amenities
b) Environment
3
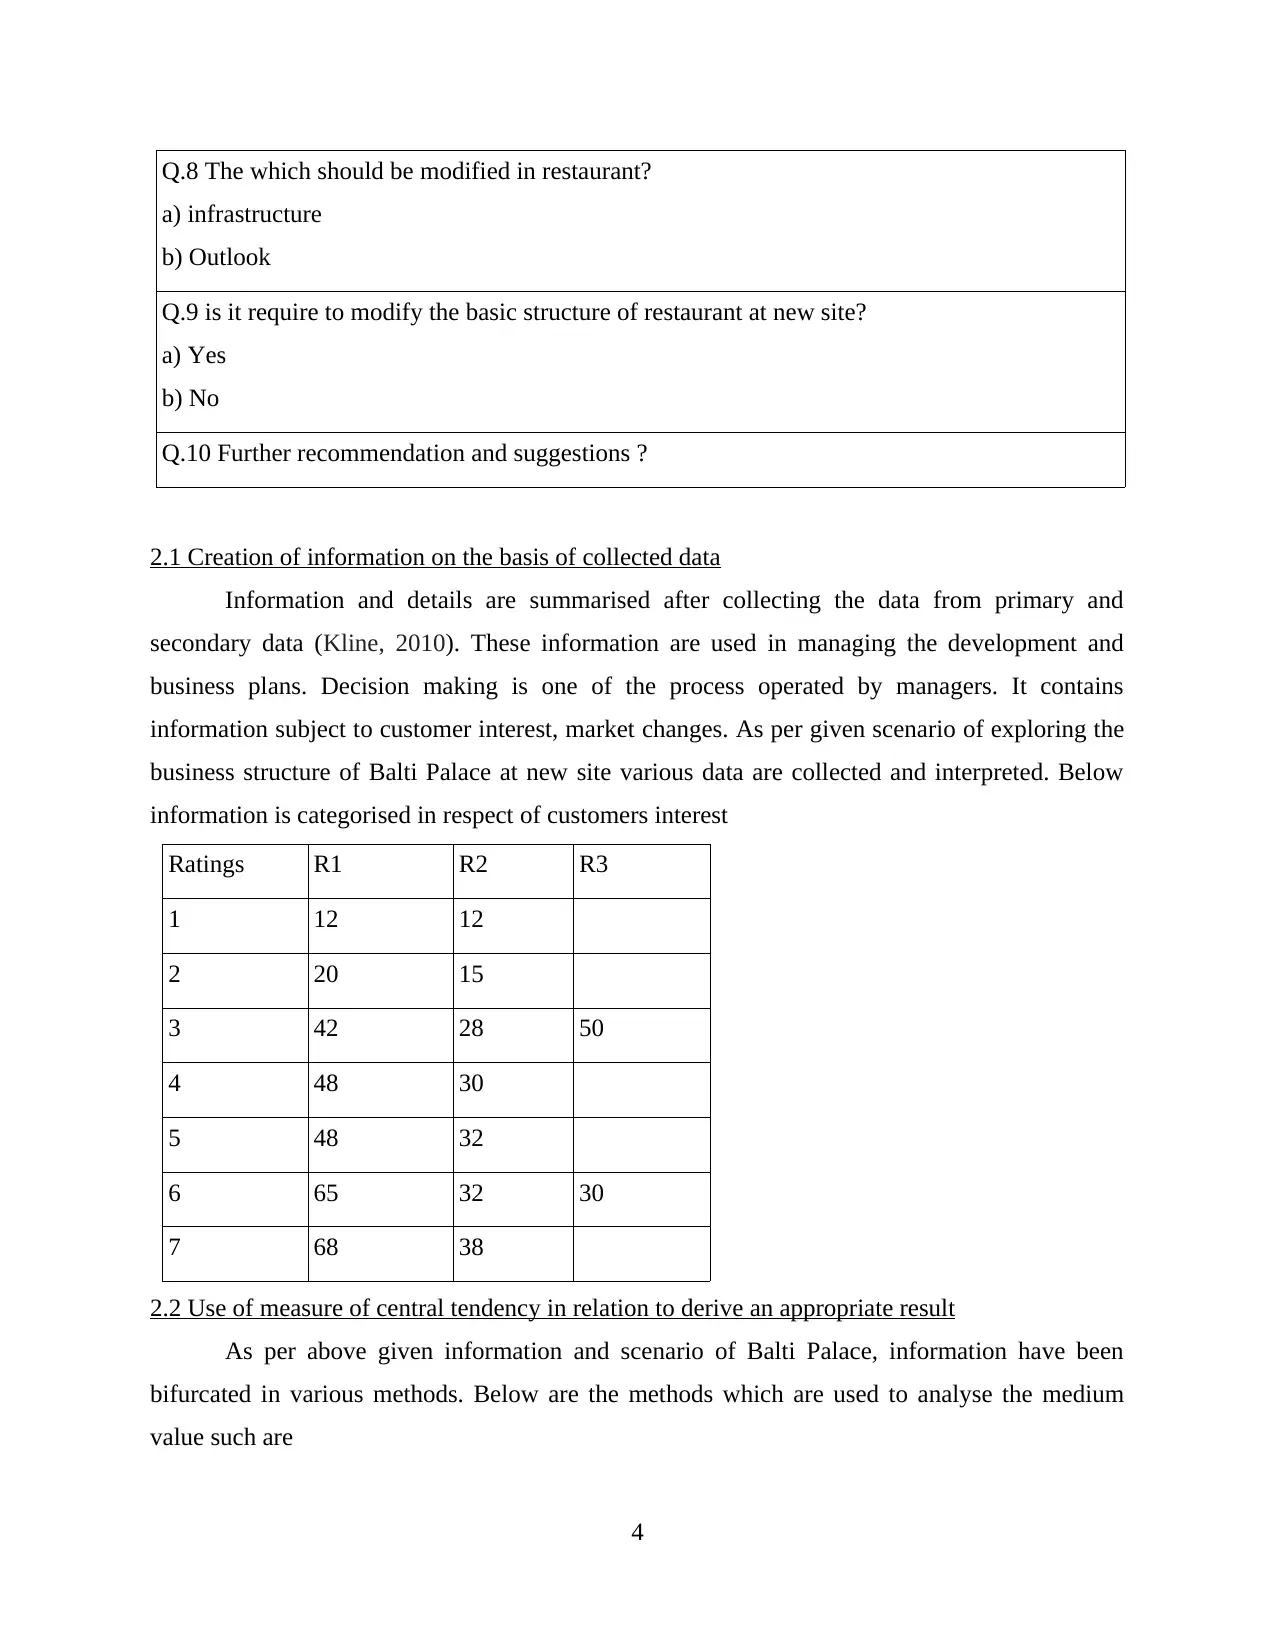
Q.8 The which should be modified in restaurant?
a) infrastructure
b) Outlook
Q.9 is it require to modify the basic structure of restaurant at new site?
a) Yes
b) No
Q.10 Further recommendation and suggestions ?
2.1 Creation of information on the basis of collected data
Information and details are summarised after collecting the data from primary and
secondary data (Kline, 2010). These information are used in managing the development and
business plans. Decision making is one of the process operated by managers. It contains
information subject to customer interest, market changes. As per given scenario of exploring the
business structure of Balti Palace at new site various data are collected and interpreted. Below
information is categorised in respect of customers interest
Ratings R1 R2 R3
1 12 12
2 20 15
3 42 28 50
4 48 30
5 48 32
6 65 32 30
7 68 38
2.2 Use of measure of central tendency in relation to derive an appropriate result
As per above given information and scenario of Balti Palace, information have been
bifurcated in various methods. Below are the methods which are used to analyse the medium
value such are
4
⊘ This is a preview!⊘
Do you want full access?
Subscribe today to unlock all pages.
Trusted by 1+ million students worldwide
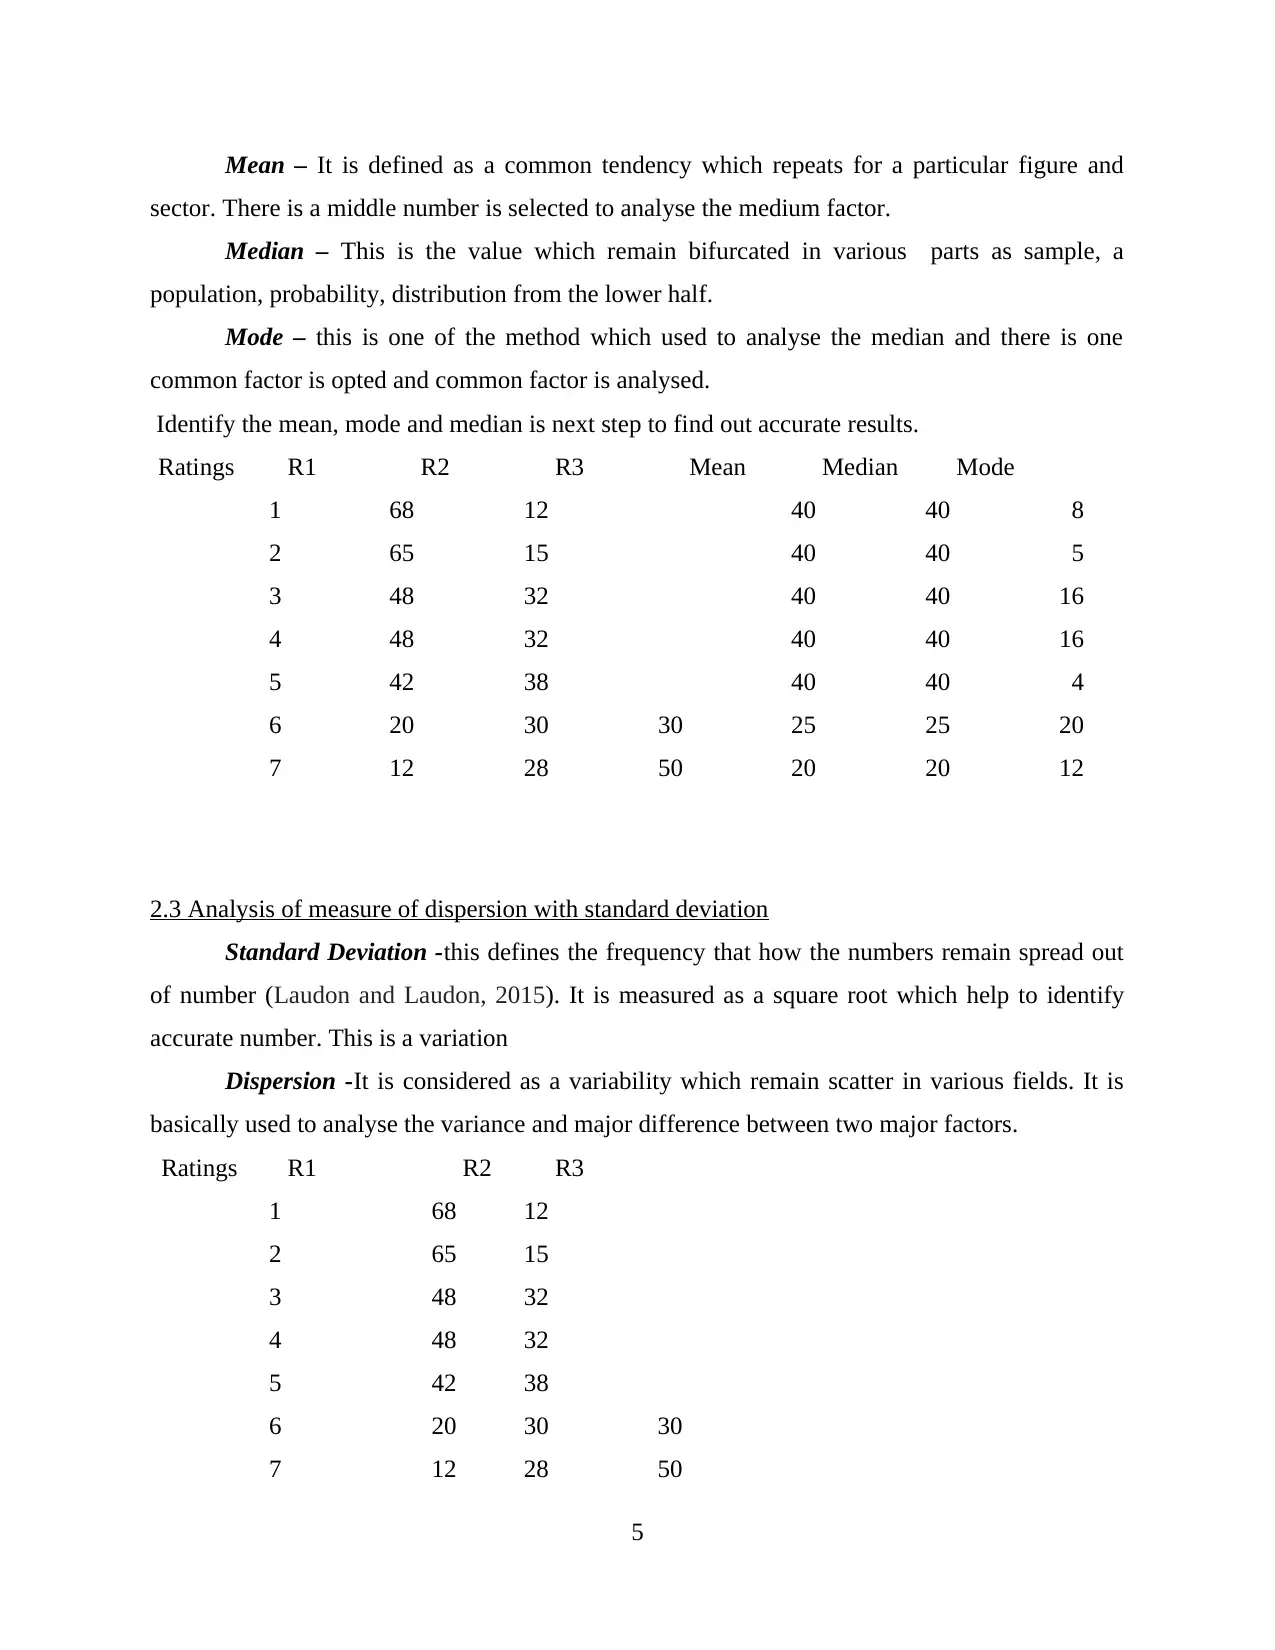
Mean – It is defined as a common tendency which repeats for a particular figure and
sector. There is a middle number is selected to analyse the medium factor.
Median – This is the value which remain bifurcated in various parts as sample, a
population, probability, distribution from the lower half.
Mode – this is one of the method which used to analyse the median and there is one
common factor is opted and common factor is analysed.
Identify the mean, mode and median is next step to find out accurate results.
Ratings R1 R2 R3 Mean Median Mode
1 68 12 40 40 8
2 65 15 40 40 5
3 48 32 40 40 16
4 48 32 40 40 16
5 42 38 40 40 4
6 20 30 30 25 25 20
7 12 28 50 20 20 12
2.3 Analysis of measure of dispersion with standard deviation
Standard Deviation -this defines the frequency that how the numbers remain spread out
of number (Laudon and Laudon, 2015). It is measured as a square root which help to identify
accurate number. This is a variation
Dispersion -It is considered as a variability which remain scatter in various fields. It is
basically used to analyse the variance and major difference between two major factors.
Ratings R1 R2 R3
1 68 12
2 65 15
3 48 32
4 48 32
5 42 38
6 20 30 30
7 12 28 50
5
Paraphrase This Document
Need a fresh take? Get an instant paraphrase of this document with our AI Paraphraser
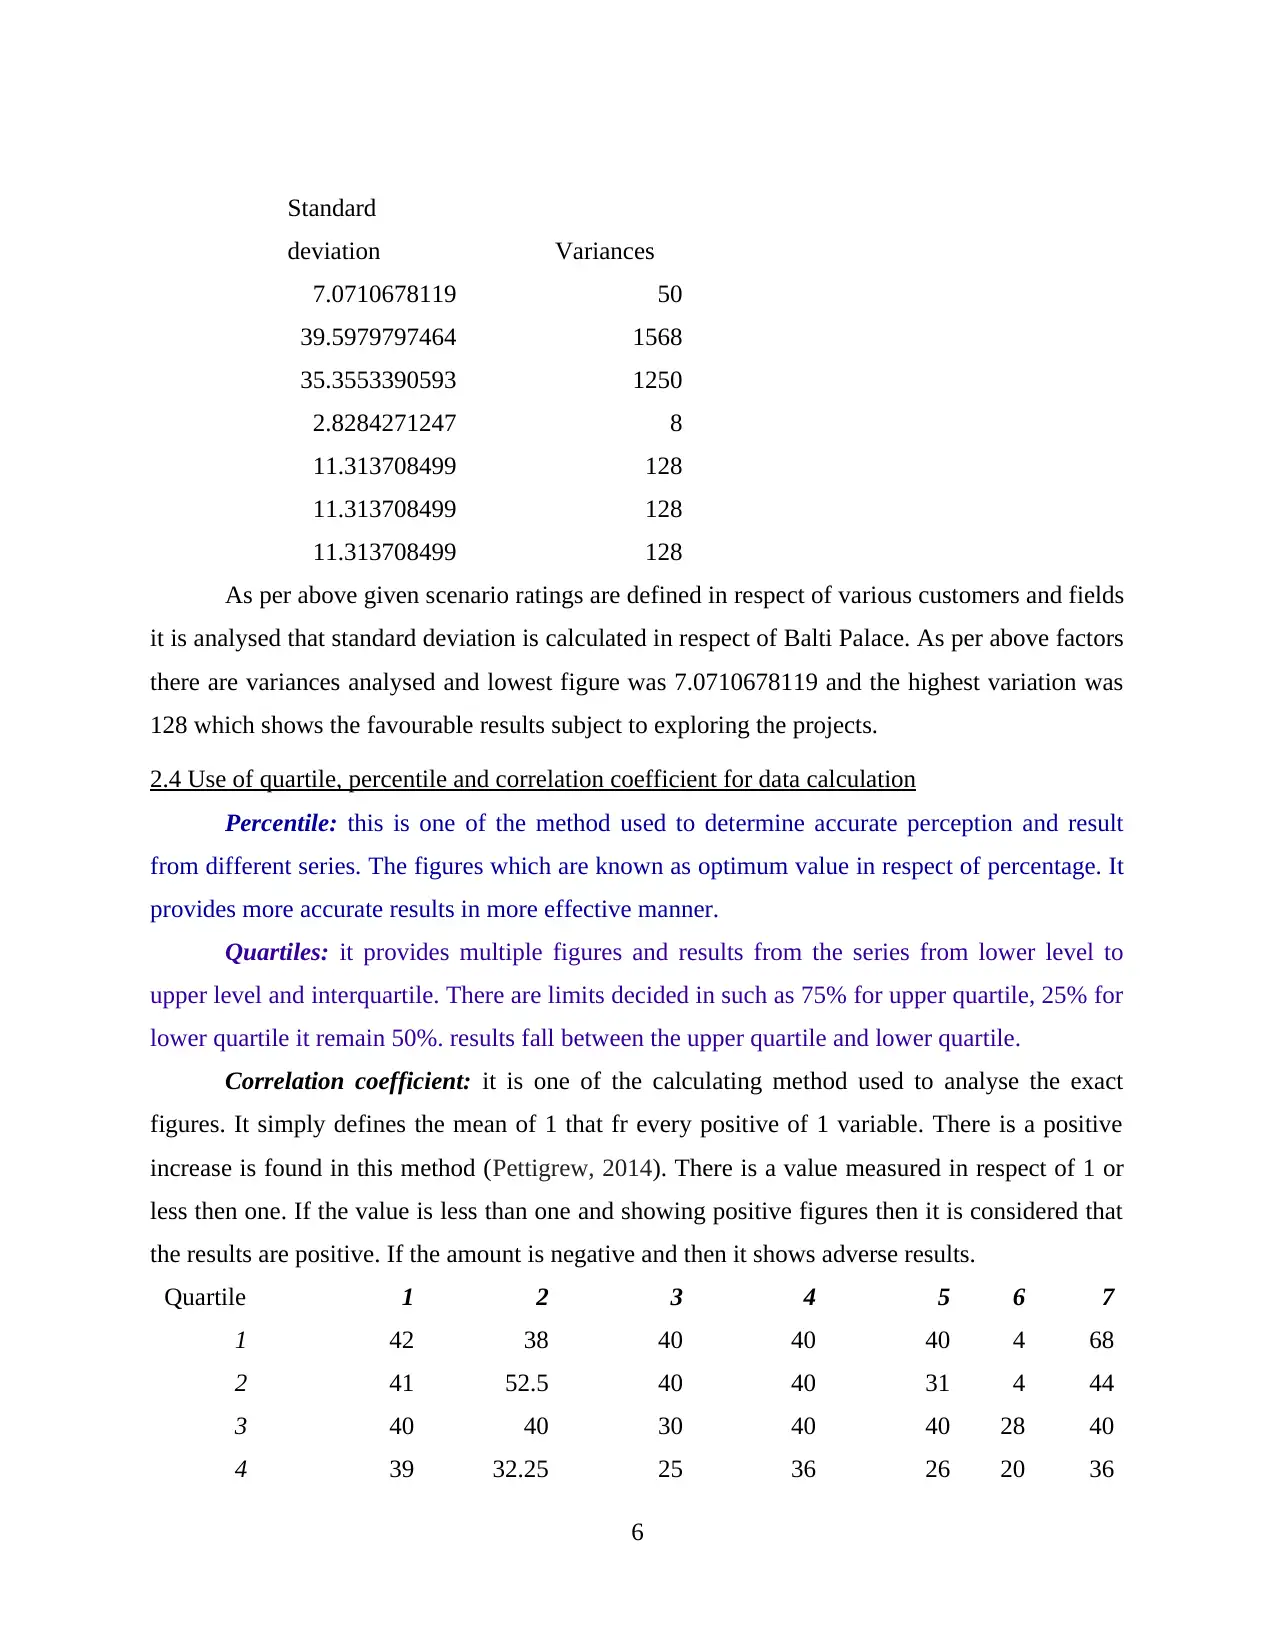
Standard
deviation Variances
7.0710678119 50
39.5979797464 1568
35.3553390593 1250
2.8284271247 8
11.313708499 128
11.313708499 128
11.313708499 128
As per above given scenario ratings are defined in respect of various customers and fields
it is analysed that standard deviation is calculated in respect of Balti Palace. As per above factors
there are variances analysed and lowest figure was 7.0710678119 and the highest variation was
128 which shows the favourable results subject to exploring the projects.
2.4 Use of quartile, percentile and correlation coefficient for data calculation
Percentile: this is one of the method used to determine accurate perception and result
from different series. The figures which are known as optimum value in respect of percentage. It
provides more accurate results in more effective manner.
Quartiles: it provides multiple figures and results from the series from lower level to
upper level and interquartile. There are limits decided in such as 75% for upper quartile, 25% for
lower quartile it remain 50%. results fall between the upper quartile and lower quartile.
Correlation coefficient: it is one of the calculating method used to analyse the exact
figures. It simply defines the mean of 1 that fr every positive of 1 variable. There is a positive
increase is found in this method (Pettigrew, 2014). There is a value measured in respect of 1 or
less then one. If the value is less than one and showing positive figures then it is considered that
the results are positive. If the amount is negative and then it shows adverse results.
Quartile 1 2 3 4 5 6 7
1 42 38 40 40 40 4 68
2 41 52.5 40 40 31 4 44
3 40 40 30 40 40 28 40
4 39 32.25 25 36 26 20 36
6
Correlation
coefficient
1 and 2 1
3 and 6 1
4 and 5
0.81705716
91
TASK 2
3.1 Graph production through using spreadsheet
1.
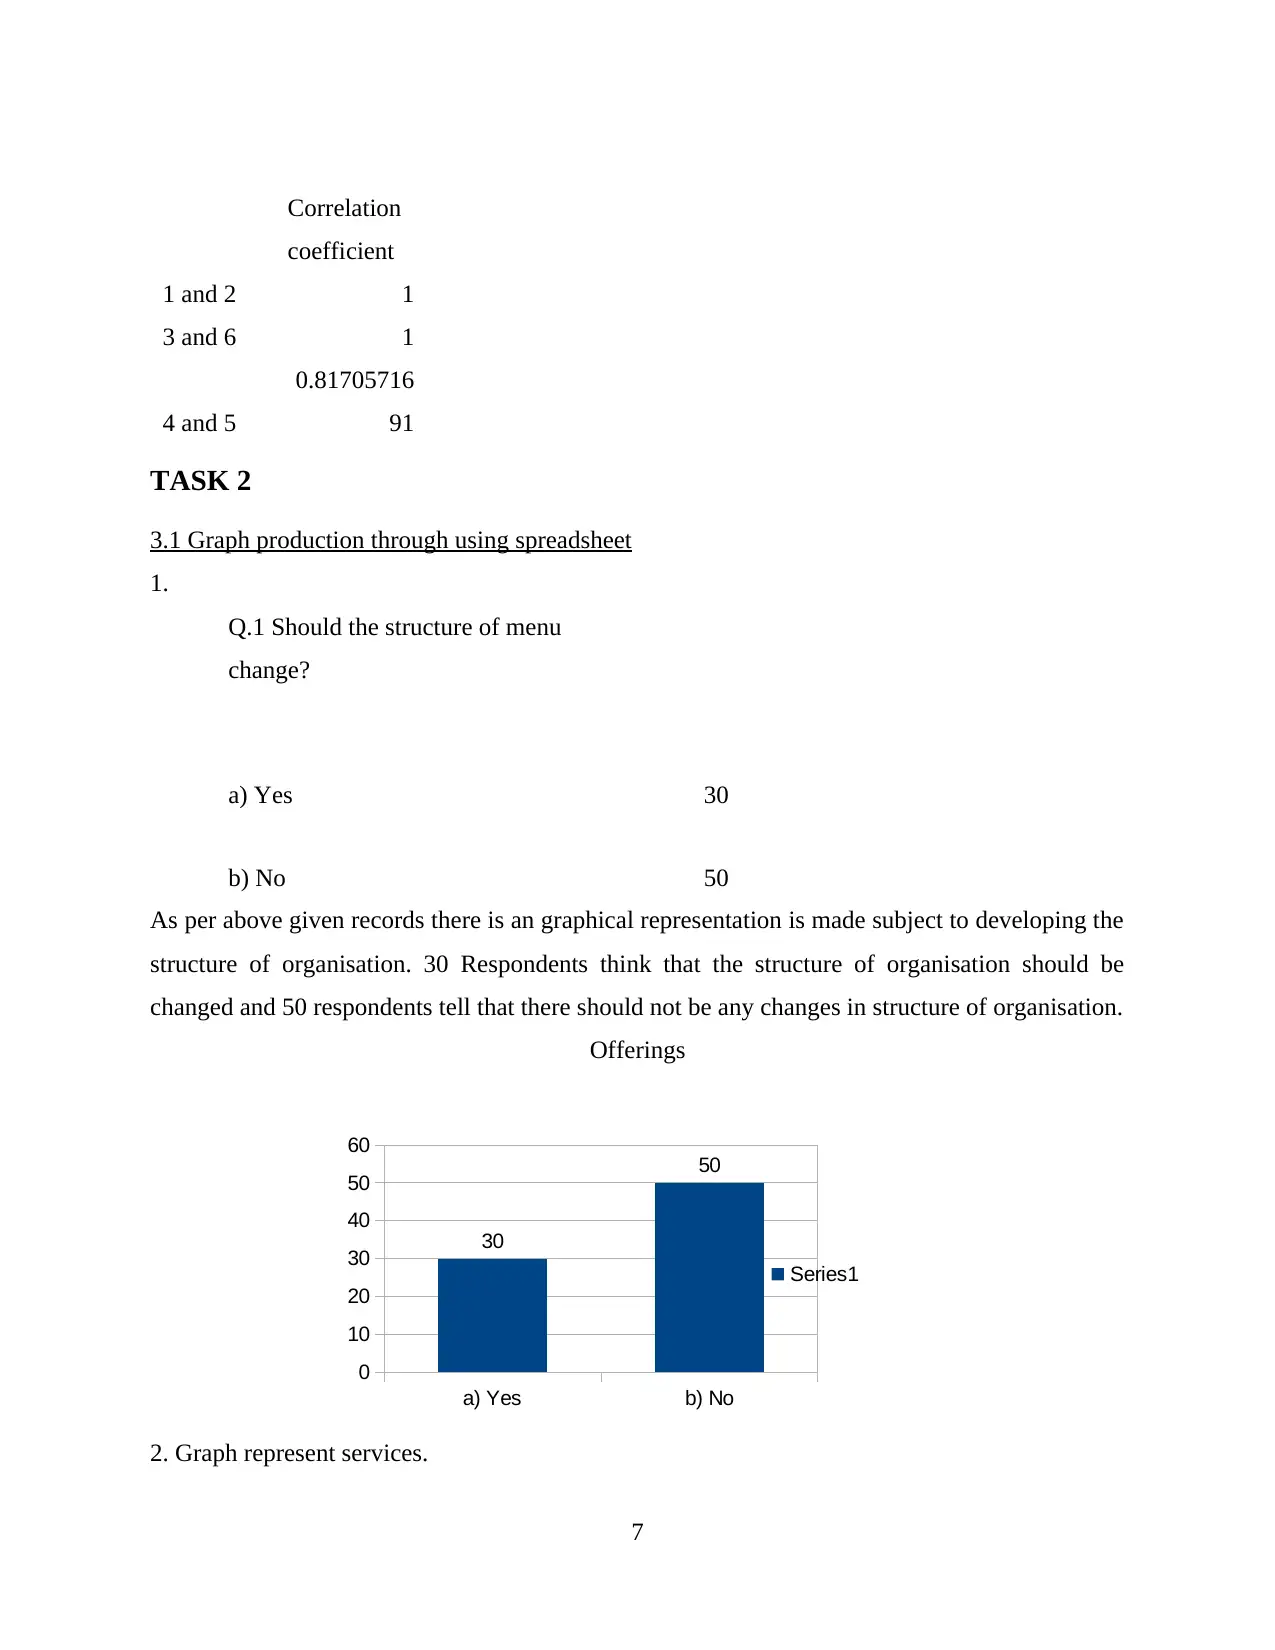
Q.1 Should the structure of menu
change?
a) Yes 30
b) No 50
As per above given records there is an graphical representation is made subject to developing the
structure of organisation. 30 Respondents think that the structure of organisation should be
changed and 50 respondents tell that there should not be any changes in structure of organisation.
Offerings
2. Graph represent services.
7
a) Yes b) No
0
10
20
30
40
50
60
30
50
Series1
coefficient
1 and 2 1
3 and 6 1
4 and 5
0.81705716
91
TASK 2
3.1 Graph production through using spreadsheet
1.
Q.1 Should the structure of menu
change?
a) Yes 30
b) No 50
As per above given records there is an graphical representation is made subject to developing the
structure of organisation. 30 Respondents think that the structure of organisation should be
changed and 50 respondents tell that there should not be any changes in structure of organisation.
Offerings
2. Graph represent services.
7
a) Yes b) No
0
10
20
30
40
50
60
30
50
Series1
⊘ This is a preview!⊘
Do you want full access?
Subscribe today to unlock all pages.
Trusted by 1+ million students worldwide
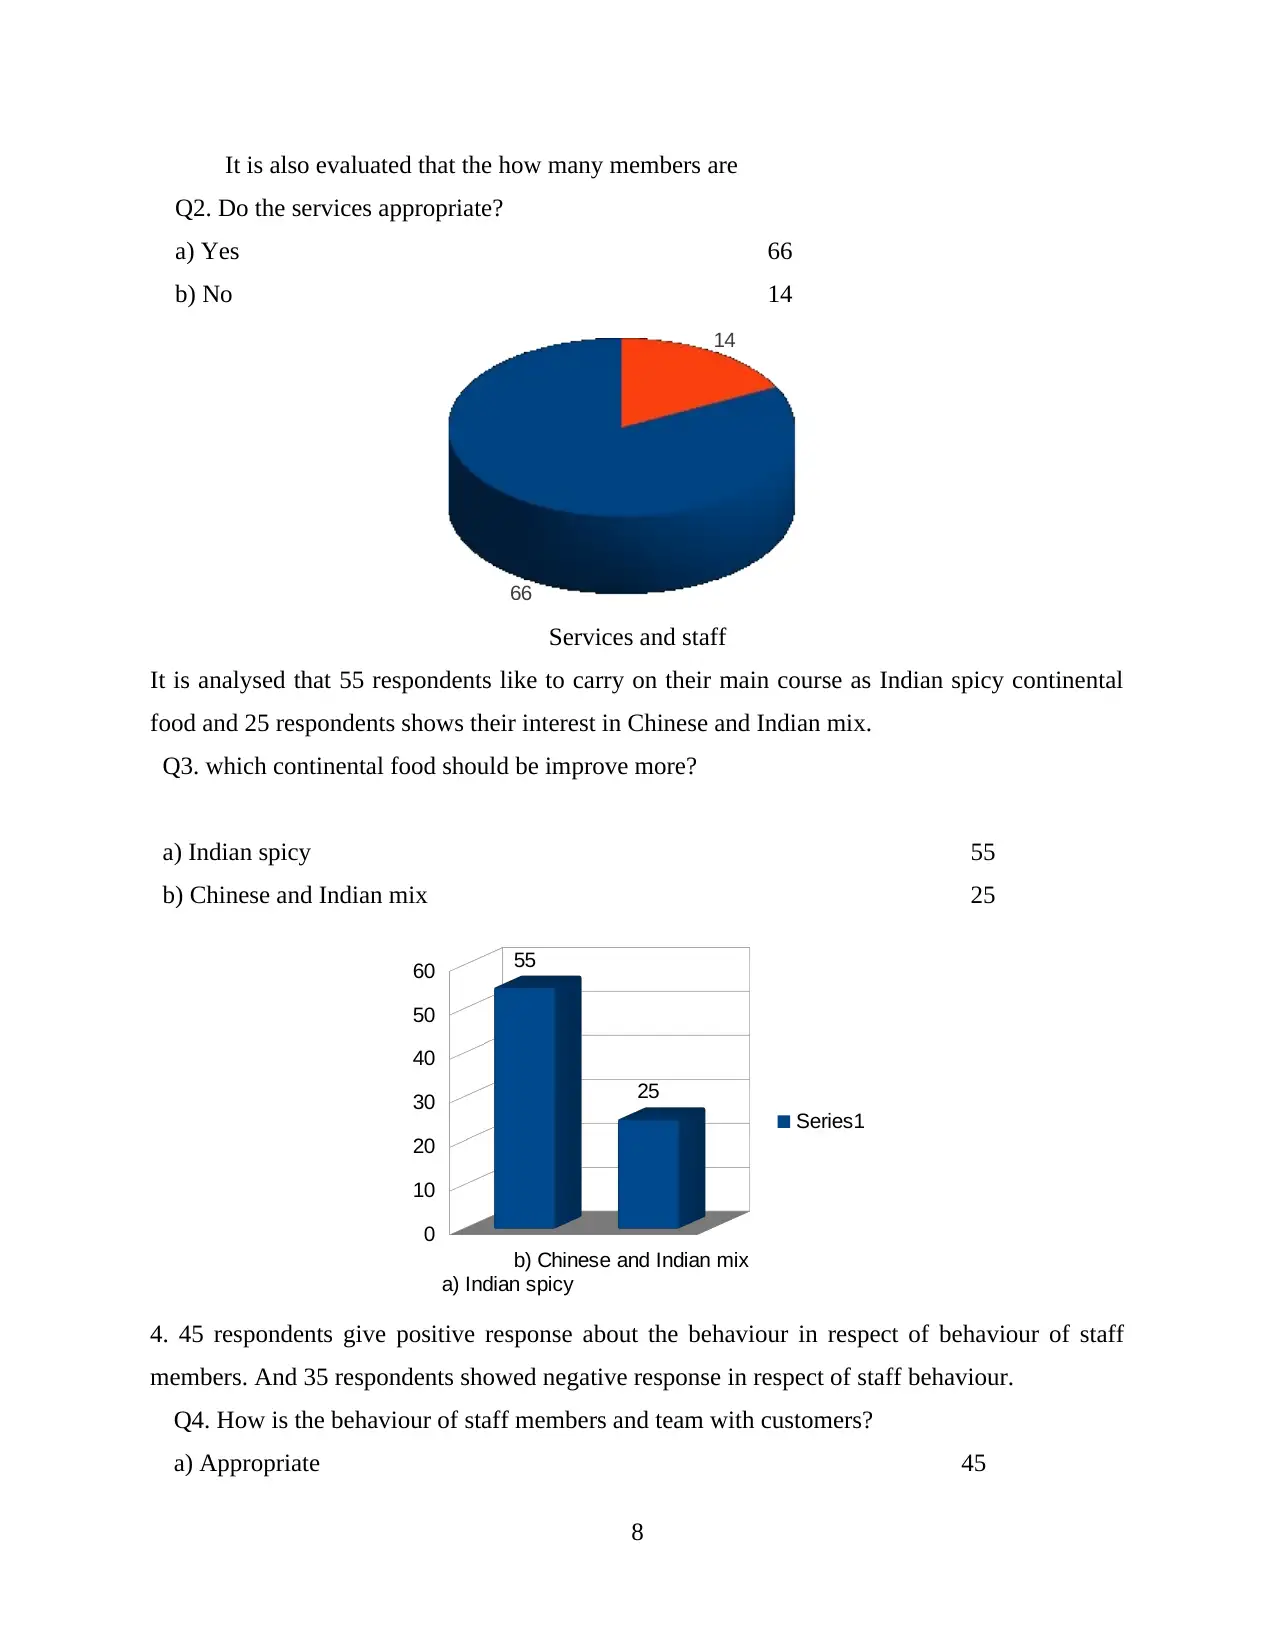
It is also evaluated that the how many members are
Q2. Do the services appropriate?
a) Yes 66
b) No 14
Services and staff
It is analysed that 55 respondents like to carry on their main course as Indian spicy continental
food and 25 respondents shows their interest in Chinese and Indian mix.
Q3. which continental food should be improve more?
a) Indian spicy 55
b) Chinese and Indian mix 25
4. 45 respondents give positive response about the behaviour in respect of behaviour of staff
members. And 35 respondents showed negative response in respect of staff behaviour.
Q4. How is the behaviour of staff members and team with customers?
a) Appropriate 45
8
66
14
a) Indian spicy
b) Chinese and Indian mix
0
10
20
30
40
50
60 55
25
Series1
Paraphrase This Document
Need a fresh take? Get an instant paraphrase of this document with our AI Paraphraser
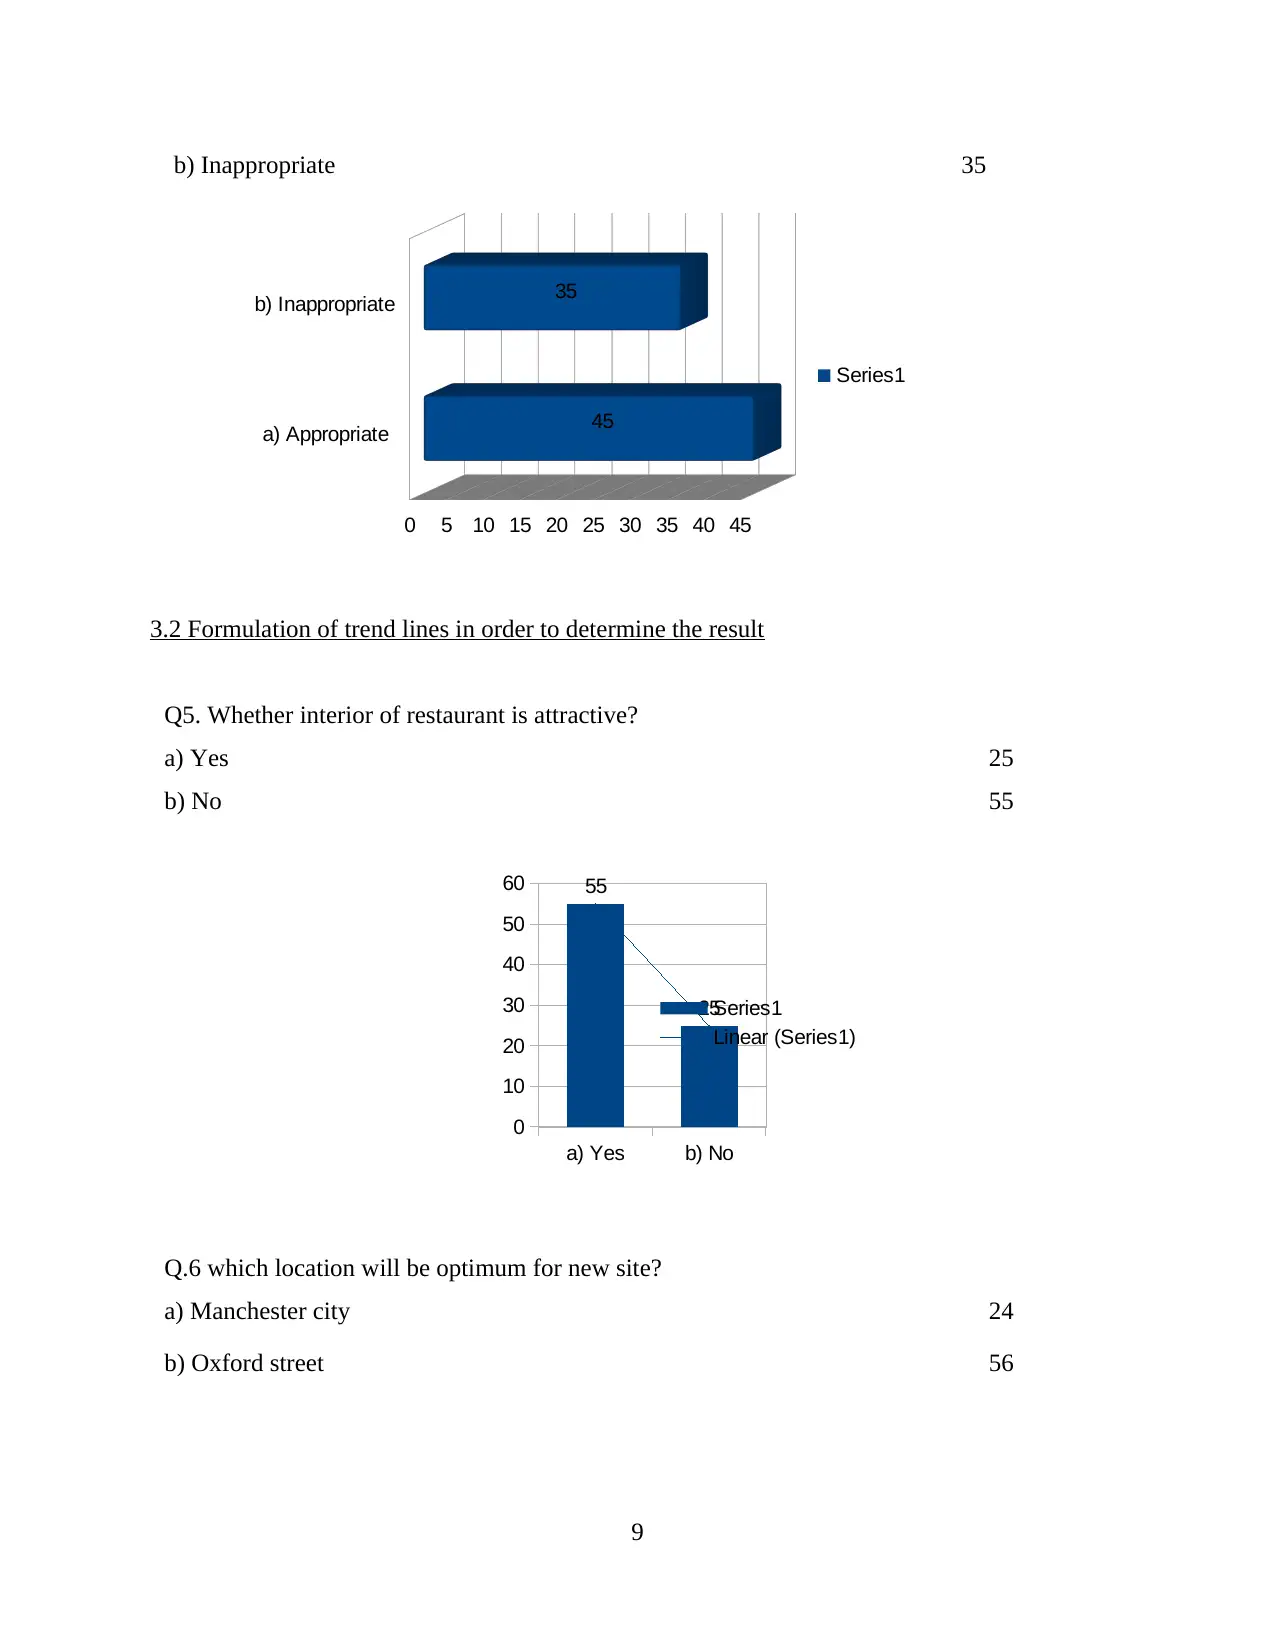
b) Inappropriate 35
3.2 Formulation of trend lines in order to determine the result
Q5. Whether interior of restaurant is attractive?
a) Yes 25
b) No 55
Q.6 which location will be optimum for new site?
a) Manchester city 24
b) Oxford street 56
9
a) Appropriate
b) Inappropriate
0 5 10 15 20 25 30 35 40 45
45
35
Series1
a) Yes b) No
0
10
20
30
40
50
60 55
25Series1
Linear (Series1)
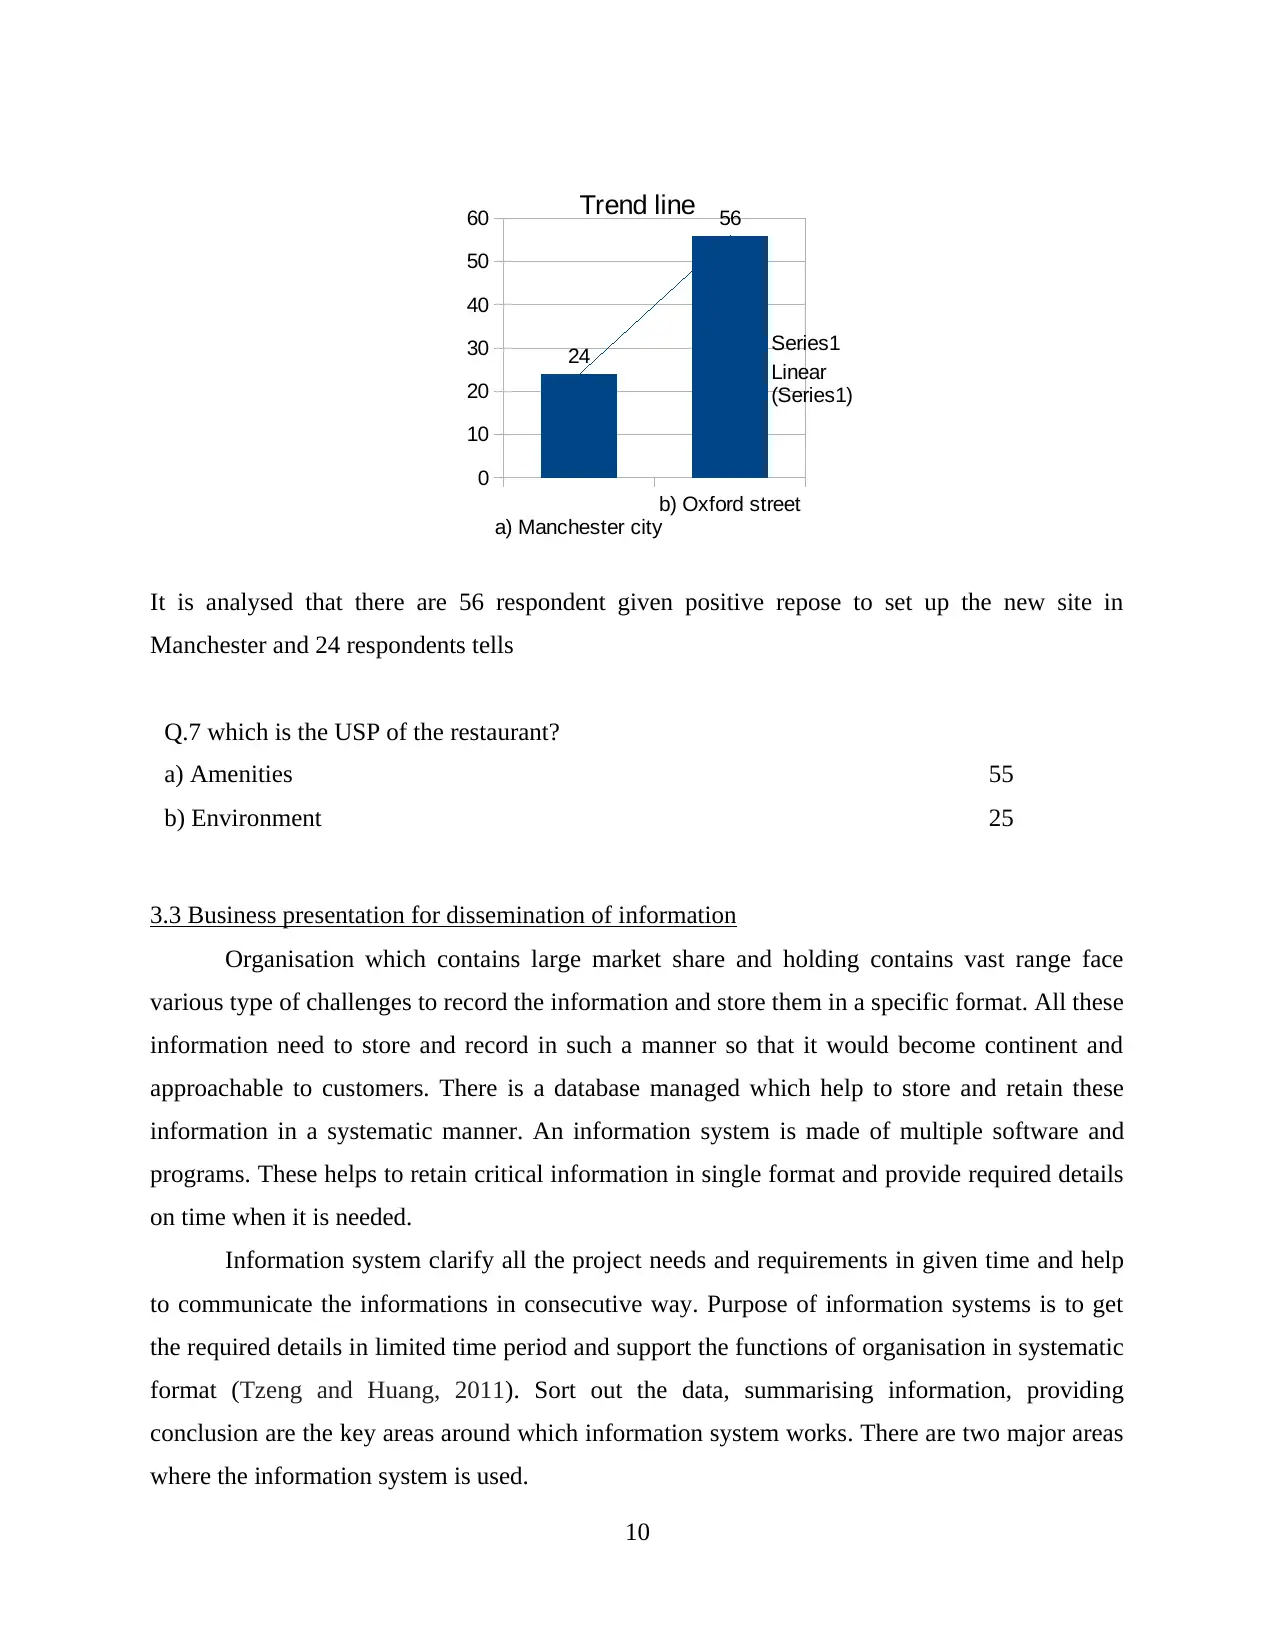
It is analysed that there are 56 respondent given positive repose to set up the new site in
Manchester and 24 respondents tells
Q.7 which is the USP of the restaurant?
a) Amenities 55
b) Environment 25
3.3 Business presentation for dissemination of information
Organisation which contains large market share and holding contains vast range face
various type of challenges to record the information and store them in a specific format. All these
information need to store and record in such a manner so that it would become continent and
approachable to customers. There is a database managed which help to store and retain these
information in a systematic manner. An information system is made of multiple software and
programs. These helps to retain critical information in single format and provide required details
on time when it is needed.
Information system clarify all the project needs and requirements in given time and help
to communicate the informations in consecutive way. Purpose of information systems is to get
the required details in limited time period and support the functions of organisation in systematic
format (Tzeng and Huang, 2011). Sort out the data, summarising information, providing
conclusion are the key areas around which information system works. There are two major areas
where the information system is used.
10
a) Manchester city
b) Oxford street
0
10
20
30
40
50
60
24
56
Trend line
Series1
Linear
(Series1)
⊘ This is a preview!⊘
Do you want full access?
Subscribe today to unlock all pages.
Trusted by 1+ million students worldwide
1 out of 18
Related Documents


Your All-in-One AI-Powered Toolkit for Academic Success.
+13062052269
info@desklib.com
Available 24*7 on WhatsApp / Email
![[object Object]](/_next/static/media/star-bottom.7253800d.svg)
Unlock your academic potential
Copyright © 2020–2026 A2Z Services. All Rights Reserved. Developed and managed by ZUCOL.