Business Decision Making Report: Food for Friends Restaurant Analysis
VerifiedAdded on 2020/06/05
|20
|4360
|113
Report
AI Summary
This report provides a comprehensive analysis of business decision-making for Food for Friends restaurant. It begins with an introduction outlining the objectives of the report, which is to analyze customer feedback and reviews to inform business decisions. Task 1 details data collection sources, including primary (surveys, questionnaires) and secondary sources. It describes research methodologies, sample designing, and questionnaire design. Task 2 focuses on data analysis, including creating data summaries using representative values (mean, median, mode), analyzing collected data, evaluating measures of dispersion, and discussing the benefits of quartile, percentile, and correlation coefficients. Task 3 explores the use of various graphs and charts to visualize data and the application of trend lines. Finally, Task 4 discusses the use of data methods in decision-making, including critical path analysis and investment appraisal tools. The report concludes with a summary of the findings and recommendations for the restaurant.
Business Decision
Making
Table of Contents
Making
Table of Contents
Paraphrase This Document
Need a fresh take? Get an instant paraphrase of this document with our AI Paraphraser
INTRODUCTION...........................................................................................................................1
TASK 1............................................................................................................................................1
1.1 Data collection sources.....................................................................................................1
1.2 Research methodologies and sample designing...............................................................2
1.3 Questionnaire designing...................................................................................................3
TASK 2............................................................................................................................................4
2.1: Creating data by summarising information with the help of representative value..........4
2.2: Analysis of data by collected from the research .............................................................6
2.3: Evaluating measure of dispersion....................................................................................7
2.4: Benefits of using quartile, percentile and coefficient correlation...................................8
TASK 3............................................................................................................................................9
3.1: Various graphs and charts...............................................................................................9
3.2: Trend line.....................................................................................................................13
3.3: Covered in PPT.............................................................................................................14
TASK 4..........................................................................................................................................15
4.1: Use of data methods in decision making ......................................................................15
4.2: Critical path ..................................................................................................................15
4.3: Investment appraisal tools.............................................................................................16
CONCLUSION .............................................................................................................................17
REFERENCES..............................................................................................................................18
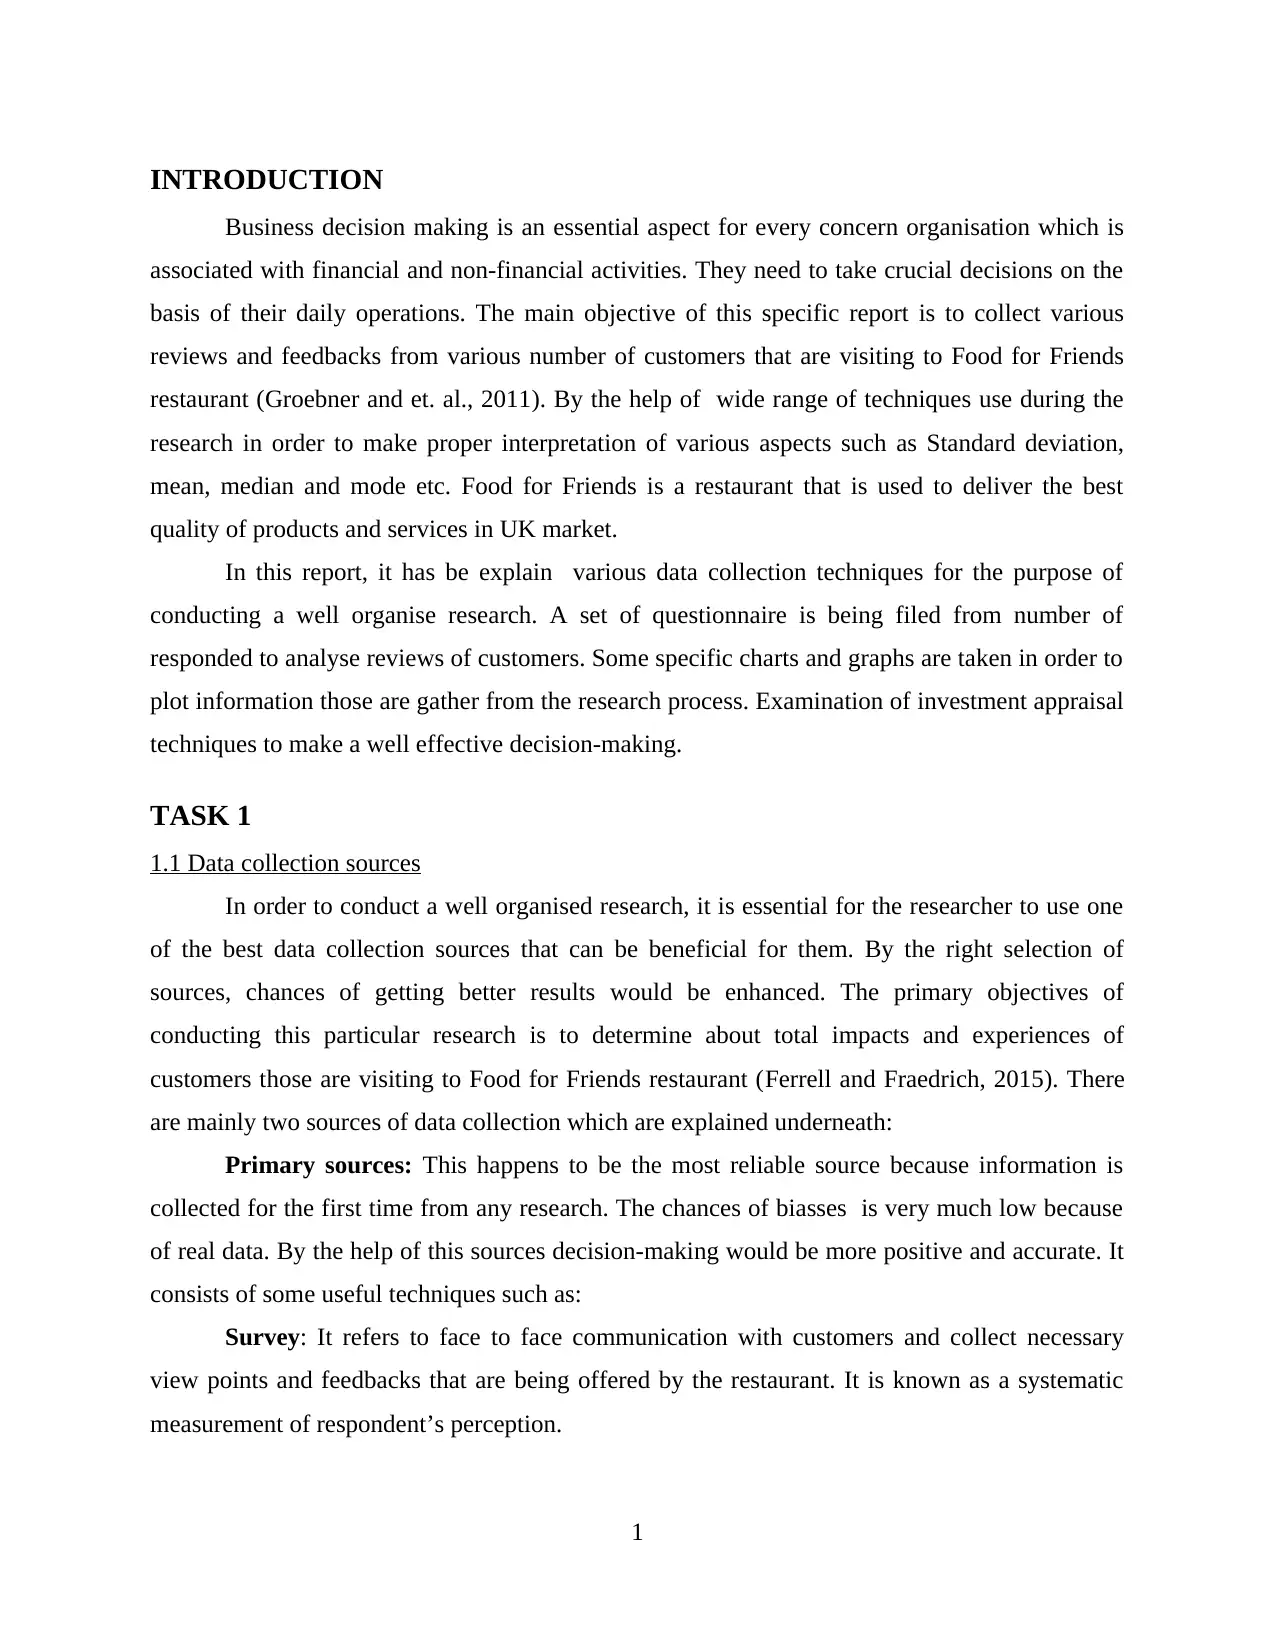
INTRODUCTION
Business decision making is an essential aspect for every concern organisation which is
associated with financial and non-financial activities. They need to take crucial decisions on the
basis of their daily operations. The main objective of this specific report is to collect various
reviews and feedbacks from various number of customers that are visiting to Food for Friends
restaurant (Groebner and et. al., 2011). By the help of wide range of techniques use during the
research in order to make proper interpretation of various aspects such as Standard deviation,
mean, median and mode etc. Food for Friends is a restaurant that is used to deliver the best
quality of products and services in UK market.
In this report, it has be explain various data collection techniques for the purpose of
conducting a well organise research. A set of questionnaire is being filed from number of
responded to analyse reviews of customers. Some specific charts and graphs are taken in order to
plot information those are gather from the research process. Examination of investment appraisal
techniques to make a well effective decision-making.
TASK 1
1.1 Data collection sources
In order to conduct a well organised research, it is essential for the researcher to use one
of the best data collection sources that can be beneficial for them. By the right selection of
sources, chances of getting better results would be enhanced. The primary objectives of
conducting this particular research is to determine about total impacts and experiences of
customers those are visiting to Food for Friends restaurant (Ferrell and Fraedrich, 2015). There
are mainly two sources of data collection which are explained underneath:
Primary sources: This happens to be the most reliable source because information is
collected for the first time from any research. The chances of biasses is very much low because
of real data. By the help of this sources decision-making would be more positive and accurate. It
consists of some useful techniques such as:
Survey: It refers to face to face communication with customers and collect necessary
view points and feedbacks that are being offered by the restaurant. It is known as a systematic
measurement of respondent’s perception.
1
⊘ This is a preview!⊘
Do you want full access?
Subscribe today to unlock all pages.
Trusted by 1+ million students worldwide
Questionnaire: It is a set of written questions that consist of multiple choice options that
provide customers certain right to present their view as per their thinking.
Online: It refers as data collection by the way of voting certain comments over online
mode. It covers wide range of areas in order to get valuable details.
Secondary sources: This is said to be a crucial process of collecting data from various
sources such as articles, magazines and newspaper in which information is already presented
(Shapiro and Stefkovich, 2016). These are termed as second hand data which is only used to
compare current research with the past one.
1.2 Research methodologies and sample designing
It is vital for researchers to use suitable techniques of data collection methods so that the
results can be achieved in an economical manner. All the information gather during research
work is use for the purpose of making decision regarding betterment of restaurant business. In
order to make attractive report, it is crucial to conduct primary research because it is free from
any biases and unethical means (Tufféry, 2011). The problems which is being face by customers
during visiting Food for Friend restaurant can easily be resolved through using customer
feedbacks. For this purpose, questionnaire is the best option to collect information in best
suitable way. Types of research methods:
Descriptive vs Analytical: It consists of surveys and fact or enquiries of various kind of
issues. Whereas, analytical method uses facts or data those are already presented and evalute
those to make critical analysis of the material.
Quantitative vs Qualitative: For the purpose of making measurement of total quantity
or amount of results from the research quantitative research method is being used. While, the
other one is related with quality of kind arises in a research-practice.
Sampling designing: In order to identify outcomes in best manner, they needs to collect
few samples from selected number of group. This can be categories into various modes such as:
Random sampling: This techniques is utilise over selected number of group out of a
population (Xu, 2015). It is unbiased survey techniques which is going to be use under this
specific research.
There are some other sample techniques are also those are helpful in research work such
as Quota, stratified, cluster sampling and so on. In this research work total of 60 respondents is
2
Paraphrase This Document
Need a fresh take? Get an instant paraphrase of this document with our AI Paraphraser
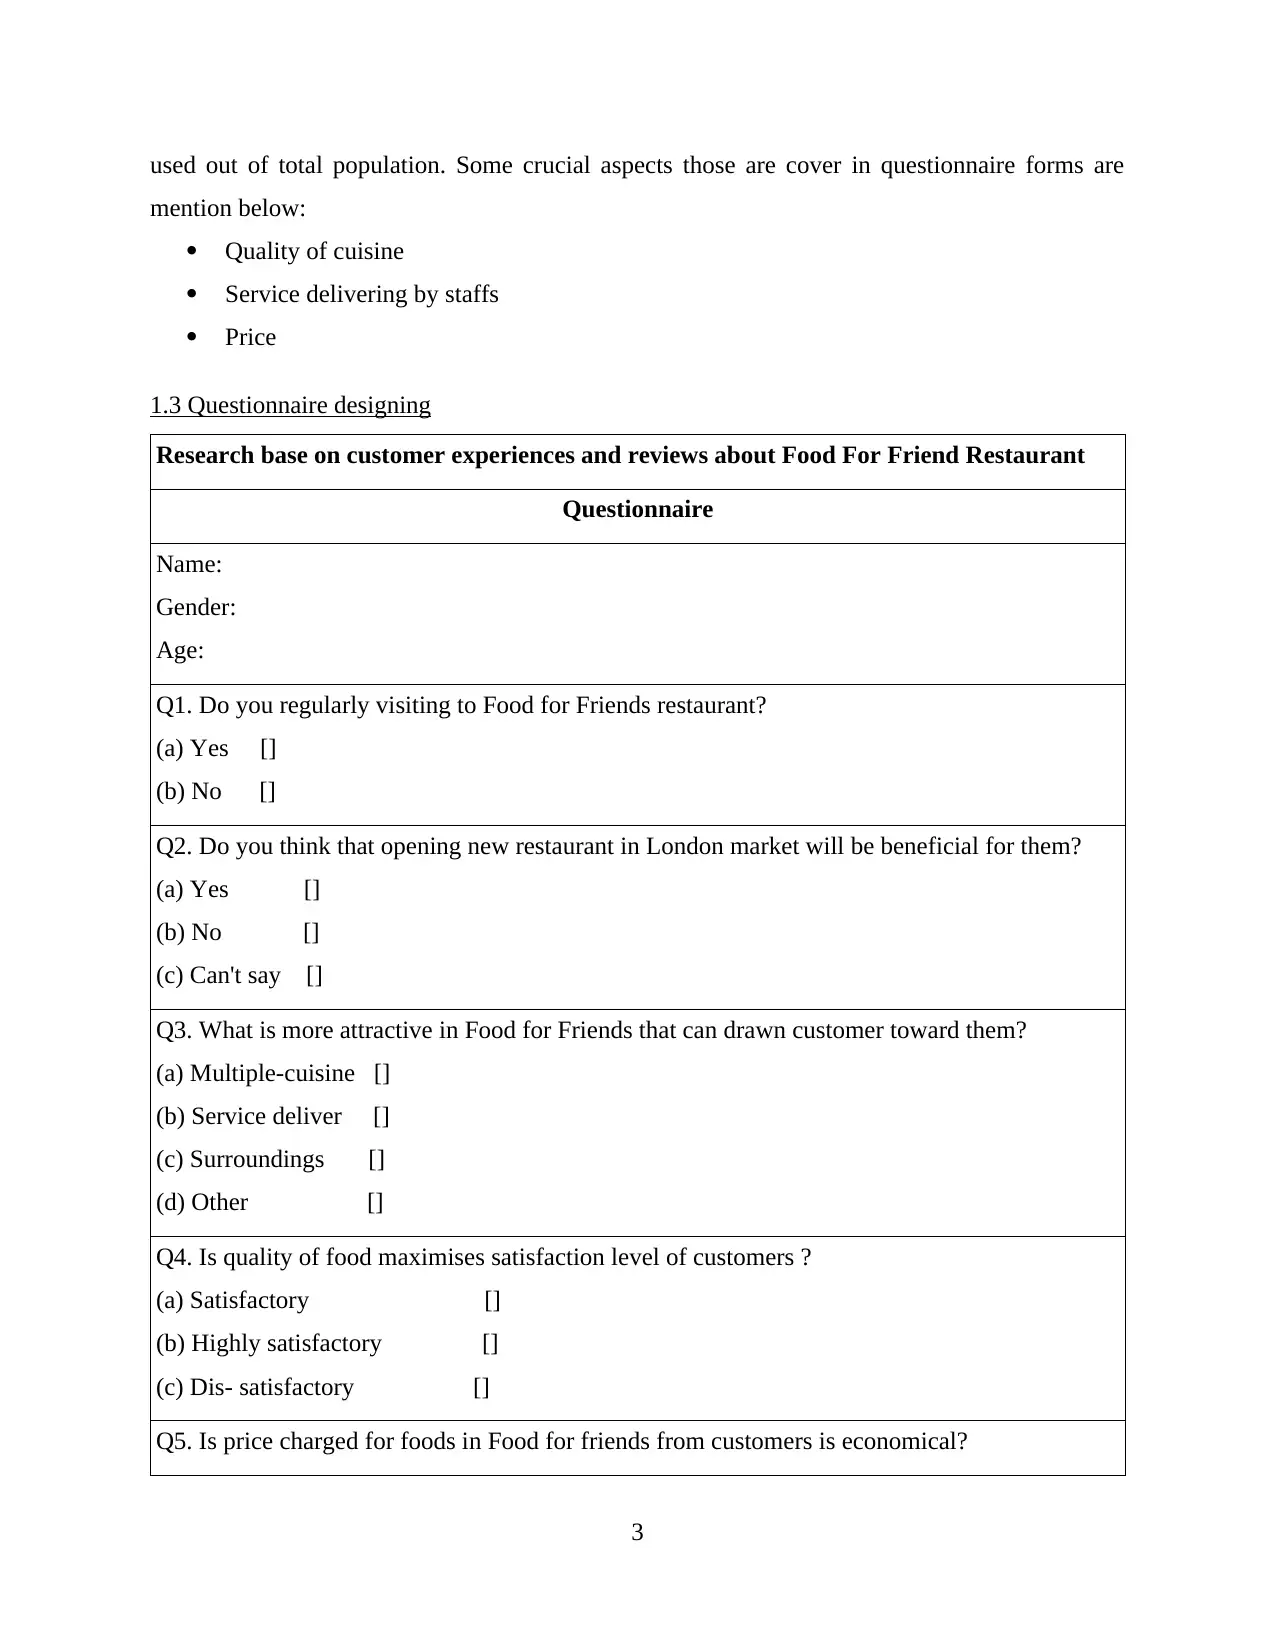
used out of total population. Some crucial aspects those are cover in questionnaire forms are
mention below:
Quality of cuisine
Service delivering by staffs
Price
1.3 Questionnaire designing
Research base on customer experiences and reviews about Food For Friend Restaurant
Questionnaire
Name:
Gender:
Age:
Q1. Do you regularly visiting to Food for Friends restaurant?
(a) Yes []
(b) No []
Q2. Do you think that opening new restaurant in London market will be beneficial for them?
(a) Yes []
(b) No []
(c) Can't say []
Q3. What is more attractive in Food for Friends that can drawn customer toward them?
(a) Multiple-cuisine []
(b) Service deliver []
(c) Surroundings []
(d) Other []
Q4. Is quality of food maximises satisfaction level of customers ?
(a) Satisfactory []
(b) Highly satisfactory []
(c) Dis- satisfactory []
Q5. Is price charged for foods in Food for friends from customers is economical?
3
(a) Yes []
(b) No []
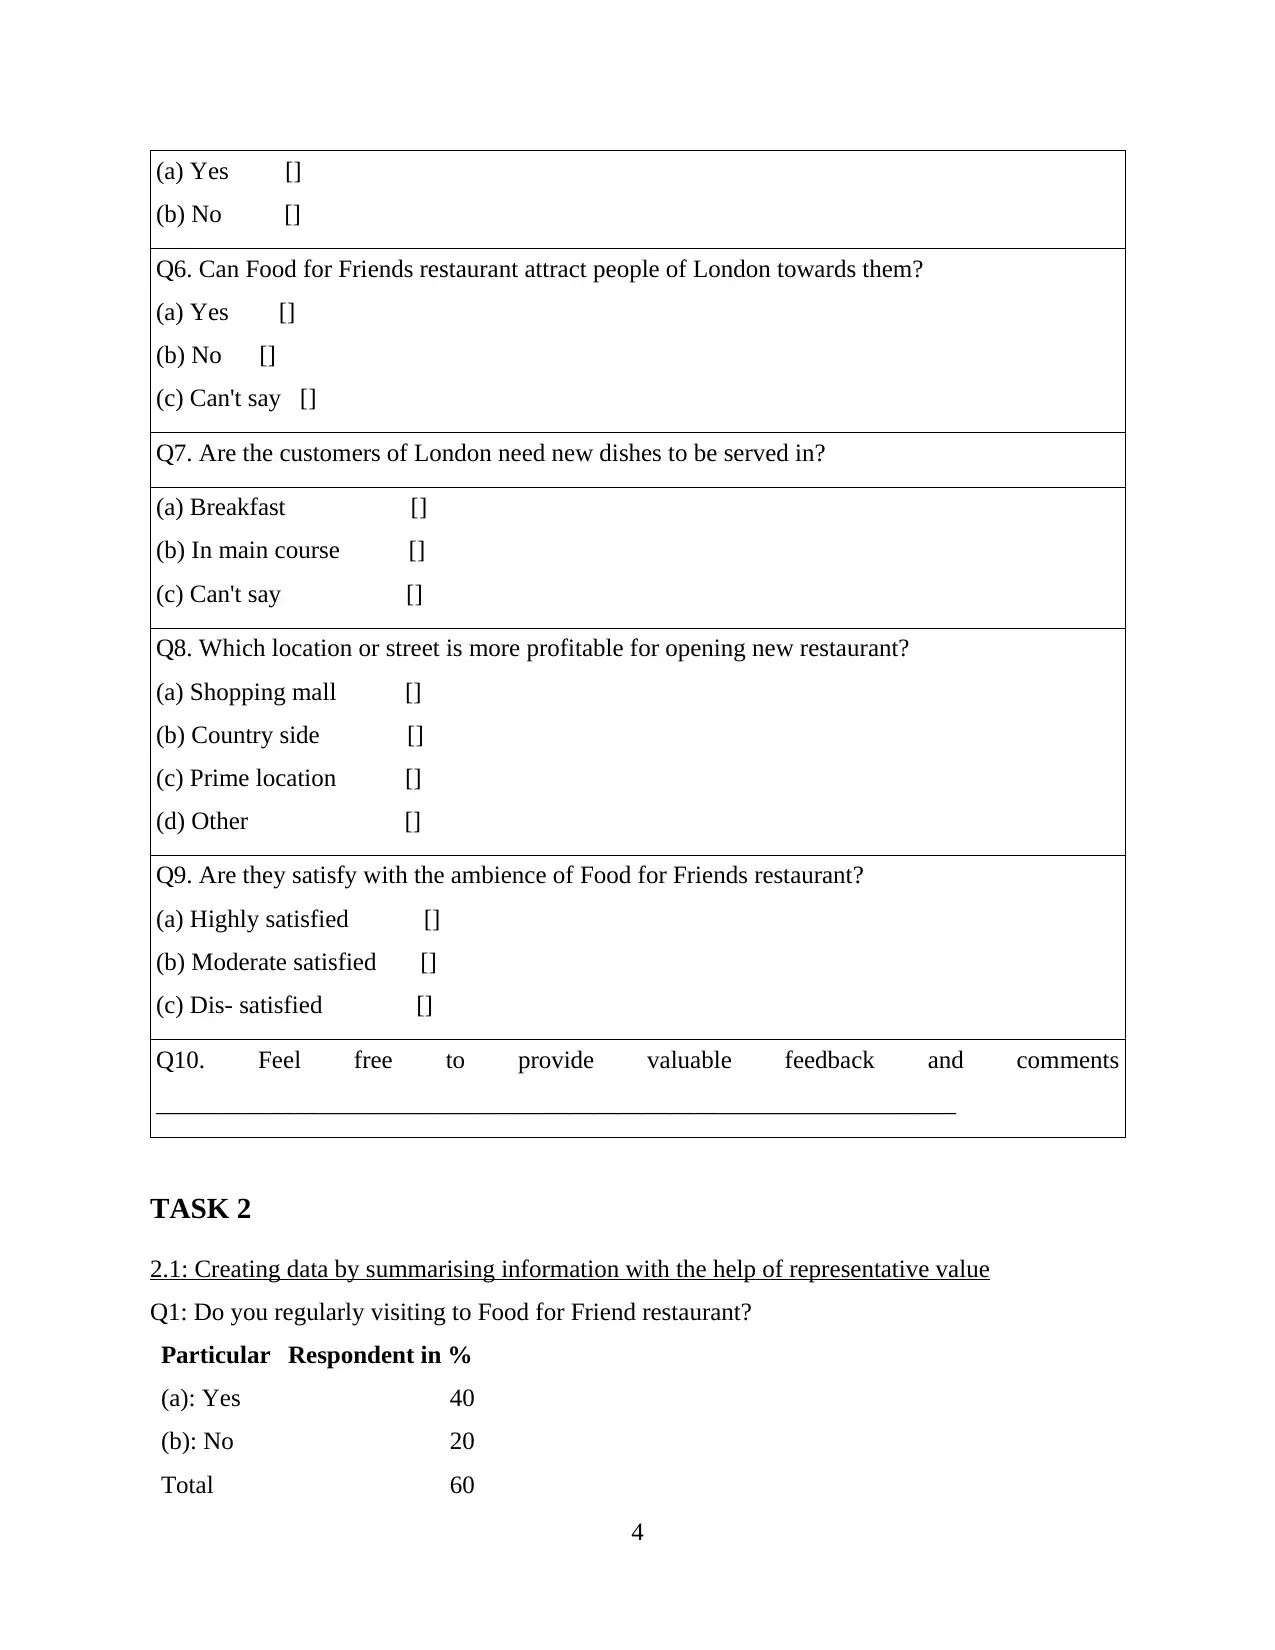
Q6. Can Food for Friends restaurant attract people of London towards them?
(a) Yes []
(b) No []
(c) Can't say []
Q7. Are the customers of London need new dishes to be served in?
(a) Breakfast []
(b) In main course []
(c) Can't say []
Q8. Which location or street is more profitable for opening new restaurant?
(a) Shopping mall []
(b) Country side []
(c) Prime location []
(d) Other []
Q9. Are they satisfy with the ambience of Food for Friends restaurant?
(a) Highly satisfied []
(b) Moderate satisfied []
(c) Dis- satisfied []
Q10. Feel free to provide valuable feedback and comments
________________________________________________________________
TASK 2
2.1: Creating data by summarising information with the help of representative value
Q1: Do you regularly visiting to Food for Friend restaurant?
Particular Respondent in %
(a): Yes 40
(b): No 20
Total 60
4
(b) No []
Q6. Can Food for Friends restaurant attract people of London towards them?
(a) Yes []
(b) No []
(c) Can't say []
Q7. Are the customers of London need new dishes to be served in?
(a) Breakfast []
(b) In main course []
(c) Can't say []
Q8. Which location or street is more profitable for opening new restaurant?
(a) Shopping mall []
(b) Country side []
(c) Prime location []
(d) Other []
Q9. Are they satisfy with the ambience of Food for Friends restaurant?
(a) Highly satisfied []
(b) Moderate satisfied []
(c) Dis- satisfied []
Q10. Feel free to provide valuable feedback and comments
________________________________________________________________
TASK 2
2.1: Creating data by summarising information with the help of representative value
Q1: Do you regularly visiting to Food for Friend restaurant?
Particular Respondent in %
(a): Yes 40
(b): No 20
Total 60
4
⊘ This is a preview!⊘
Do you want full access?
Subscribe today to unlock all pages.
Trusted by 1+ million students worldwide
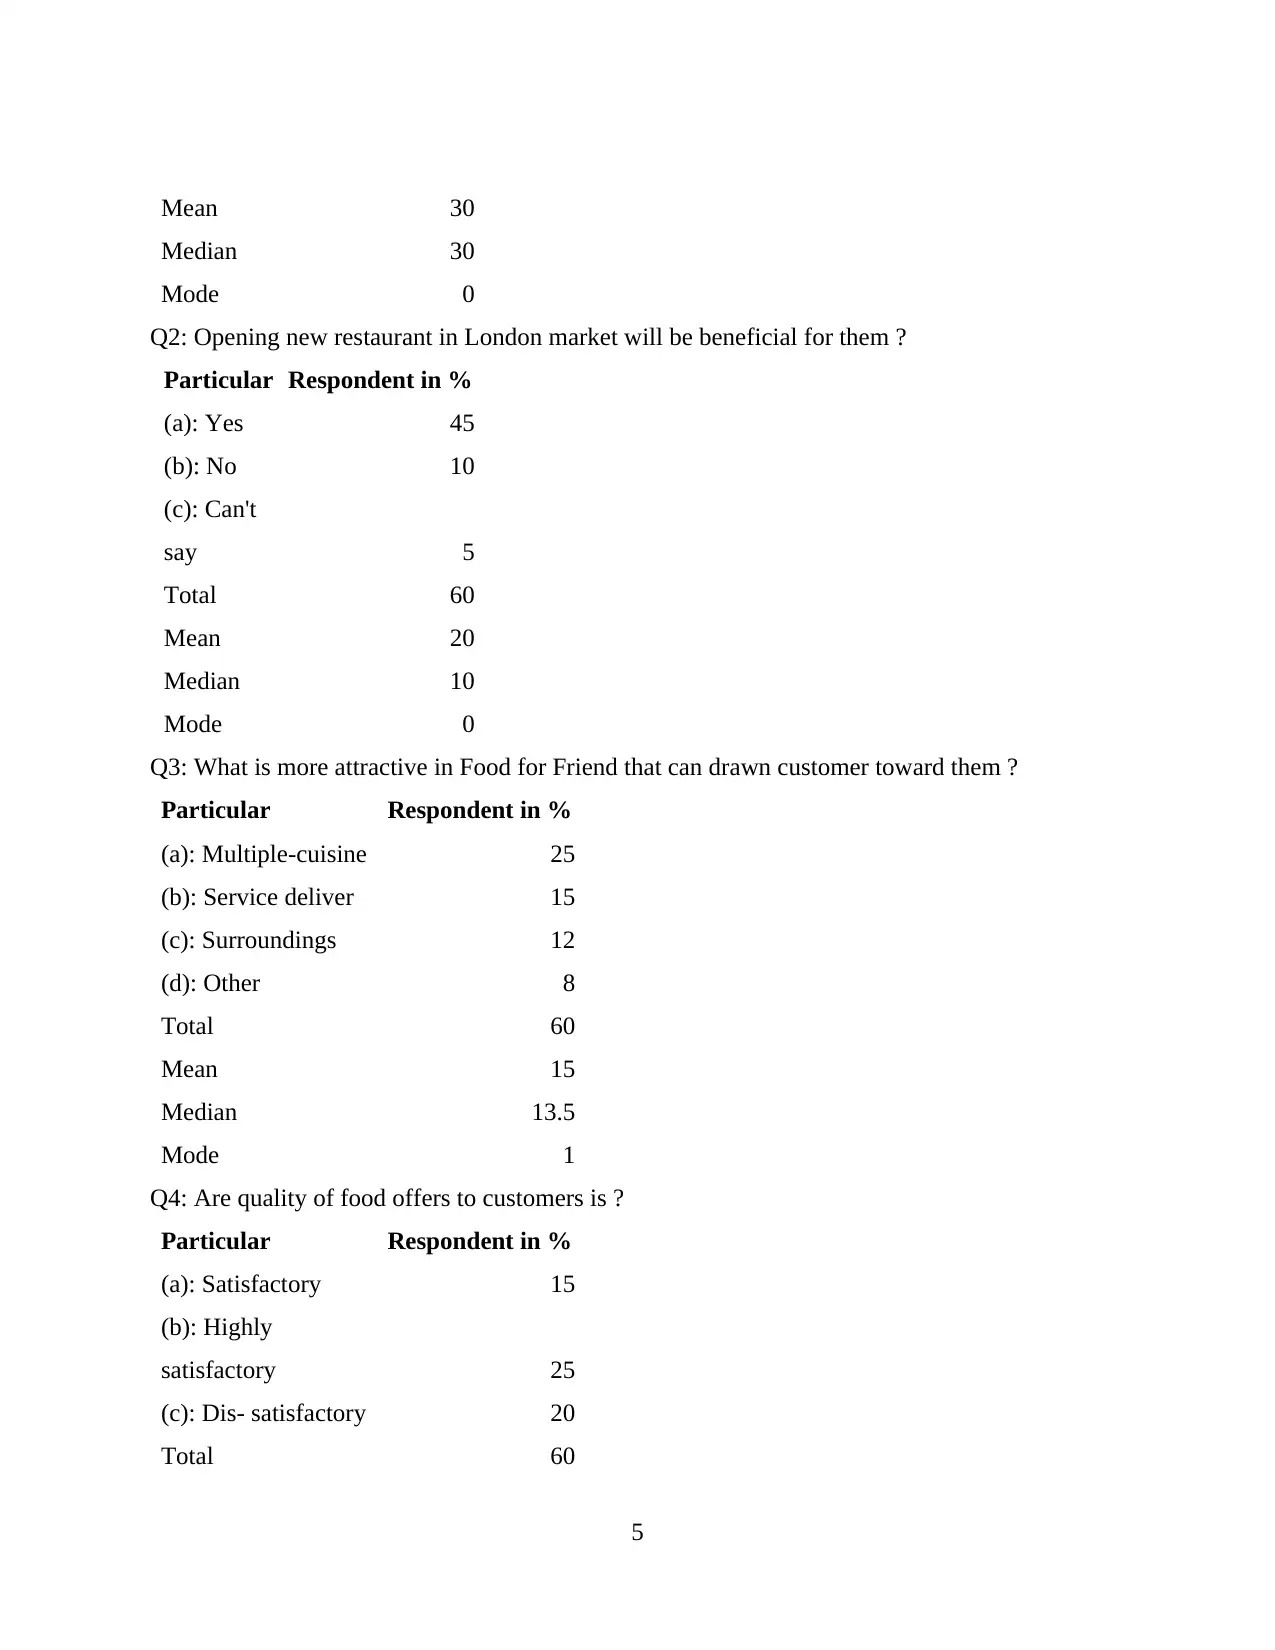
Mean 30
Median 30
Mode 0
Q2: Opening new restaurant in London market will be beneficial for them ?
Particular Respondent in %
(a): Yes 45
(b): No 10
(c): Can't
say 5
Total 60
Mean 20
Median 10
Mode 0
Q3: What is more attractive in Food for Friend that can drawn customer toward them ?
Particular Respondent in %
(a): Multiple-cuisine 25
(b): Service deliver 15
(c): Surroundings 12
(d): Other 8
Total 60
Mean 15
Median 13.5
Mode 1
Q4: Are quality of food offers to customers is ?
Particular Respondent in %
(a): Satisfactory 15
(b): Highly
satisfactory 25
(c): Dis- satisfactory 20
Total 60
5
Paraphrase This Document
Need a fresh take? Get an instant paraphrase of this document with our AI Paraphraser
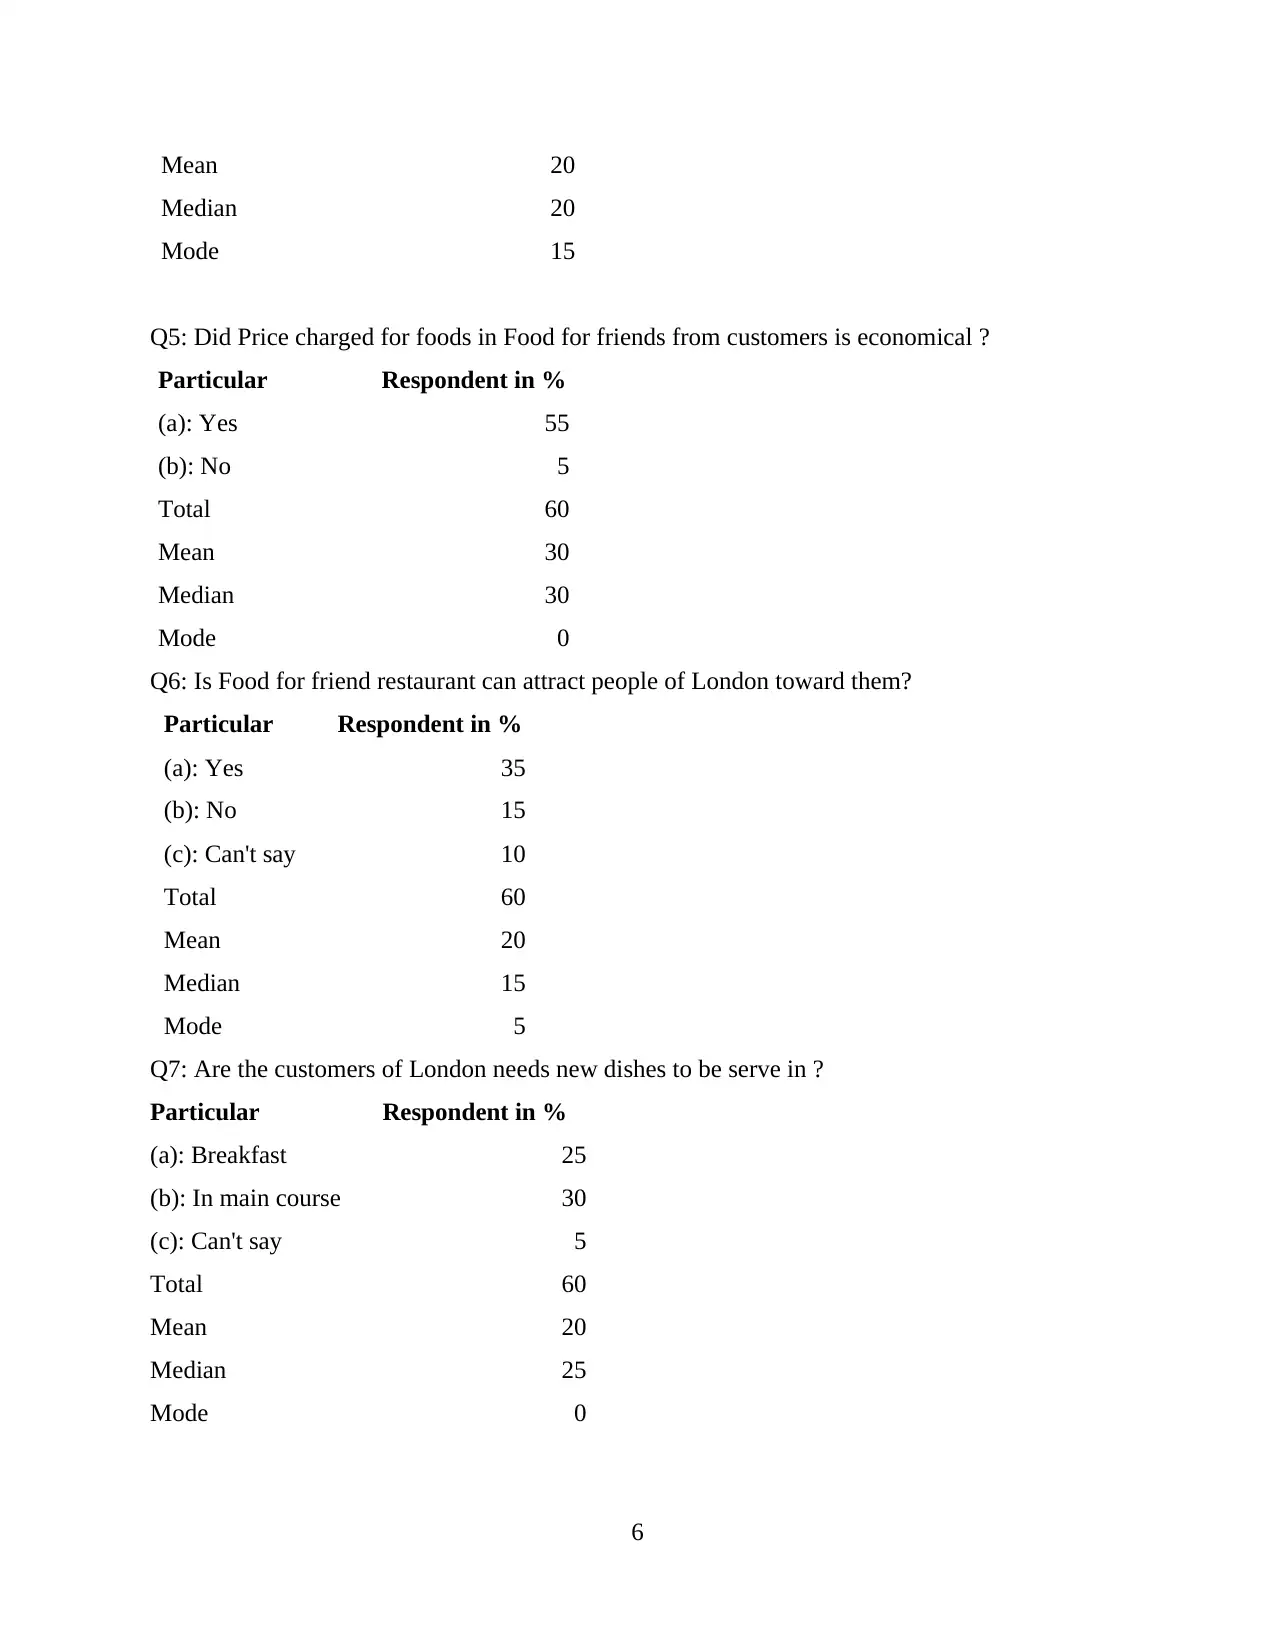
Mean 20
Median 20
Mode 15
Q5: Did Price charged for foods in Food for friends from customers is economical ?
Particular Respondent in %
(a): Yes 55
(b): No 5
Total 60
Mean 30
Median 30
Mode 0
Q6: Is Food for friend restaurant can attract people of London toward them?
Particular Respondent in %
(a): Yes 35
(b): No 15
(c): Can't say 10
Total 60
Mean 20
Median 15
Mode 5
Q7: Are the customers of London needs new dishes to be serve in ?
Particular Respondent in %
(a): Breakfast 25
(b): In main course 30
(c): Can't say 5
Total 60
Mean 20
Median 25
Mode 0
6
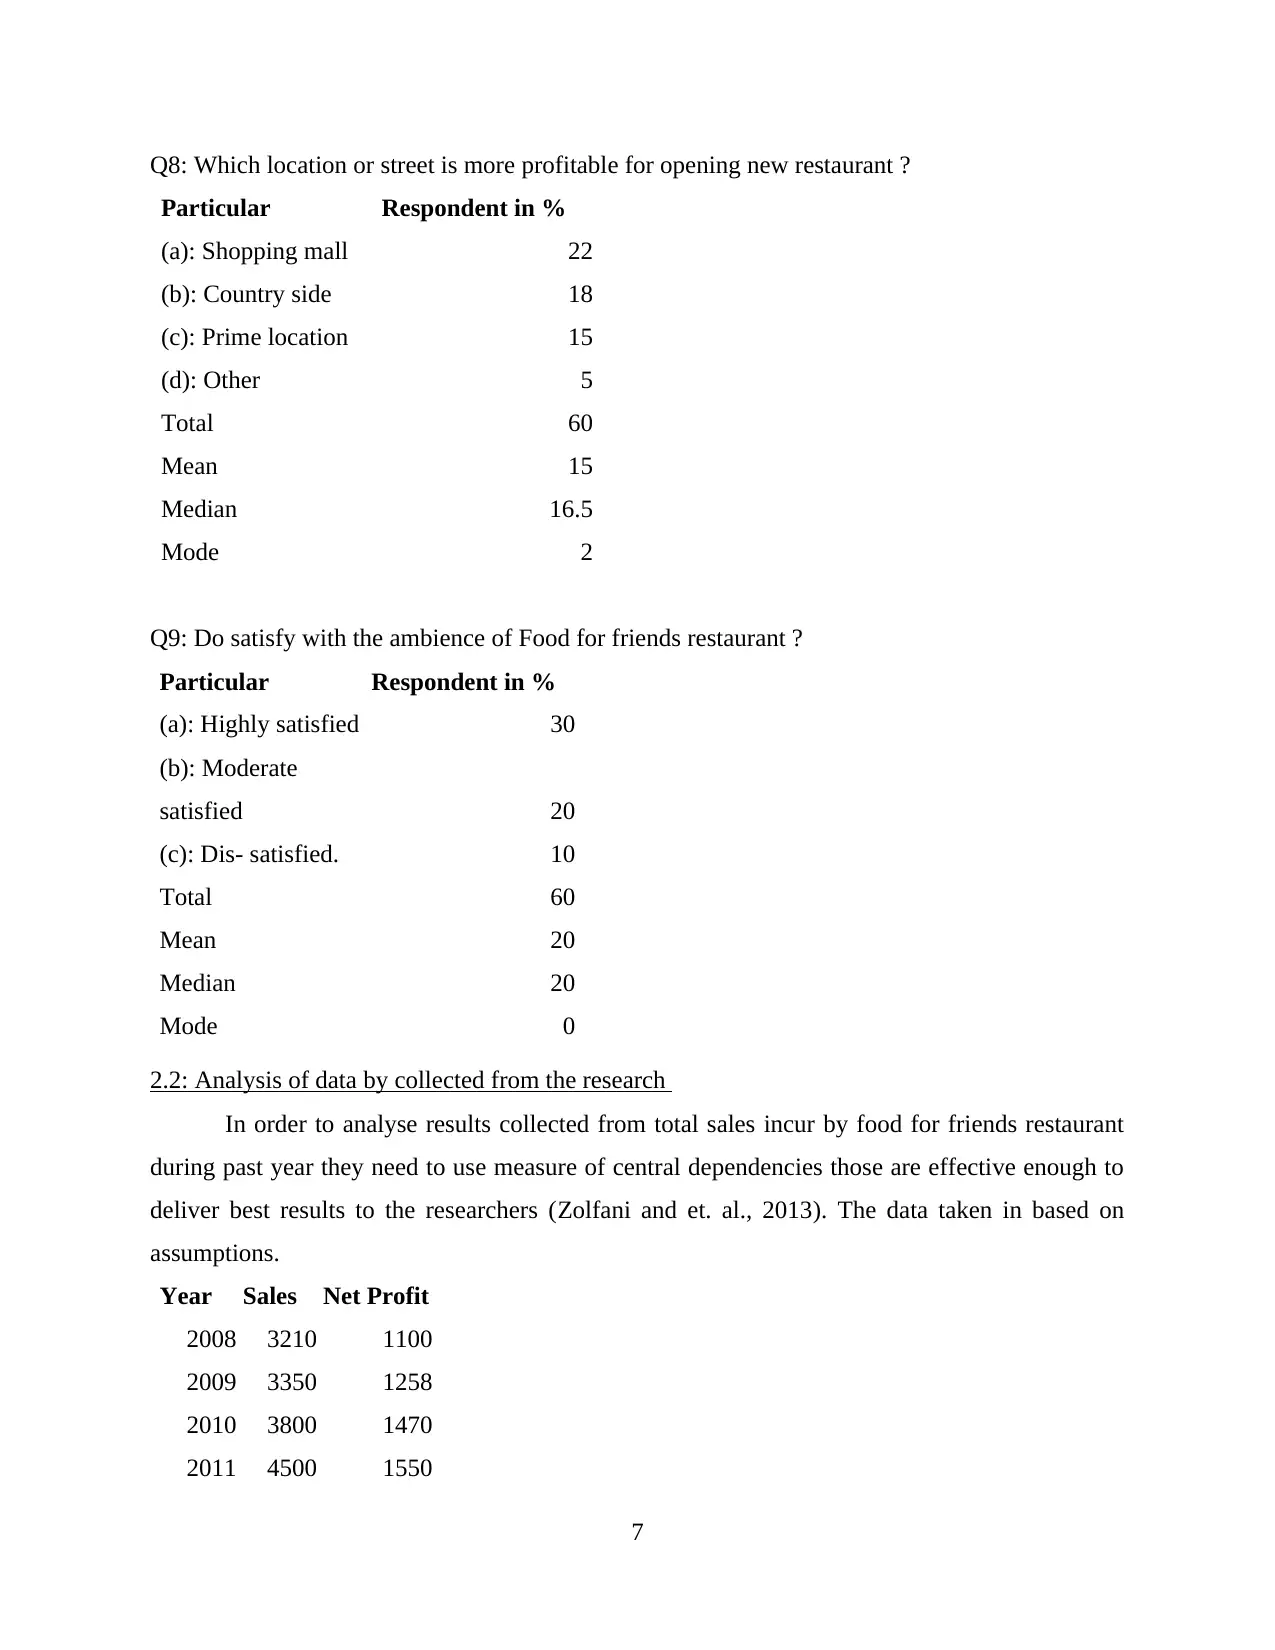
Q8: Which location or street is more profitable for opening new restaurant ?
Particular Respondent in %
(a): Shopping mall 22
(b): Country side 18
(c): Prime location 15
(d): Other 5
Total 60
Mean 15
Median 16.5
Mode 2
Q9: Do satisfy with the ambience of Food for friends restaurant ?
Particular Respondent in %
(a): Highly satisfied 30
(b): Moderate
satisfied 20
(c): Dis- satisfied. 10
Total 60
Mean 20
Median 20
Mode 0
2.2: Analysis of data by collected from the research
In order to analyse results collected from total sales incur by food for friends restaurant
during past year they need to use measure of central dependencies those are effective enough to
deliver best results to the researchers (Zolfani and et. al., 2013). The data taken in based on
assumptions.
Year Sales Net Profit
2008 3210 1100
2009 3350 1258
2010 3800 1470
2011 4500 1550
7
Particular Respondent in %
(a): Shopping mall 22
(b): Country side 18
(c): Prime location 15
(d): Other 5
Total 60
Mean 15
Median 16.5
Mode 2
Q9: Do satisfy with the ambience of Food for friends restaurant ?
Particular Respondent in %
(a): Highly satisfied 30
(b): Moderate
satisfied 20
(c): Dis- satisfied. 10
Total 60
Mean 20
Median 20
Mode 0
2.2: Analysis of data by collected from the research
In order to analyse results collected from total sales incur by food for friends restaurant
during past year they need to use measure of central dependencies those are effective enough to
deliver best results to the researchers (Zolfani and et. al., 2013). The data taken in based on
assumptions.
Year Sales Net Profit
2008 3210 1100
2009 3350 1258
2010 3800 1470
2011 4500 1550
7
⊘ This is a preview!⊘
Do you want full access?
Subscribe today to unlock all pages.
Trusted by 1+ million students worldwide
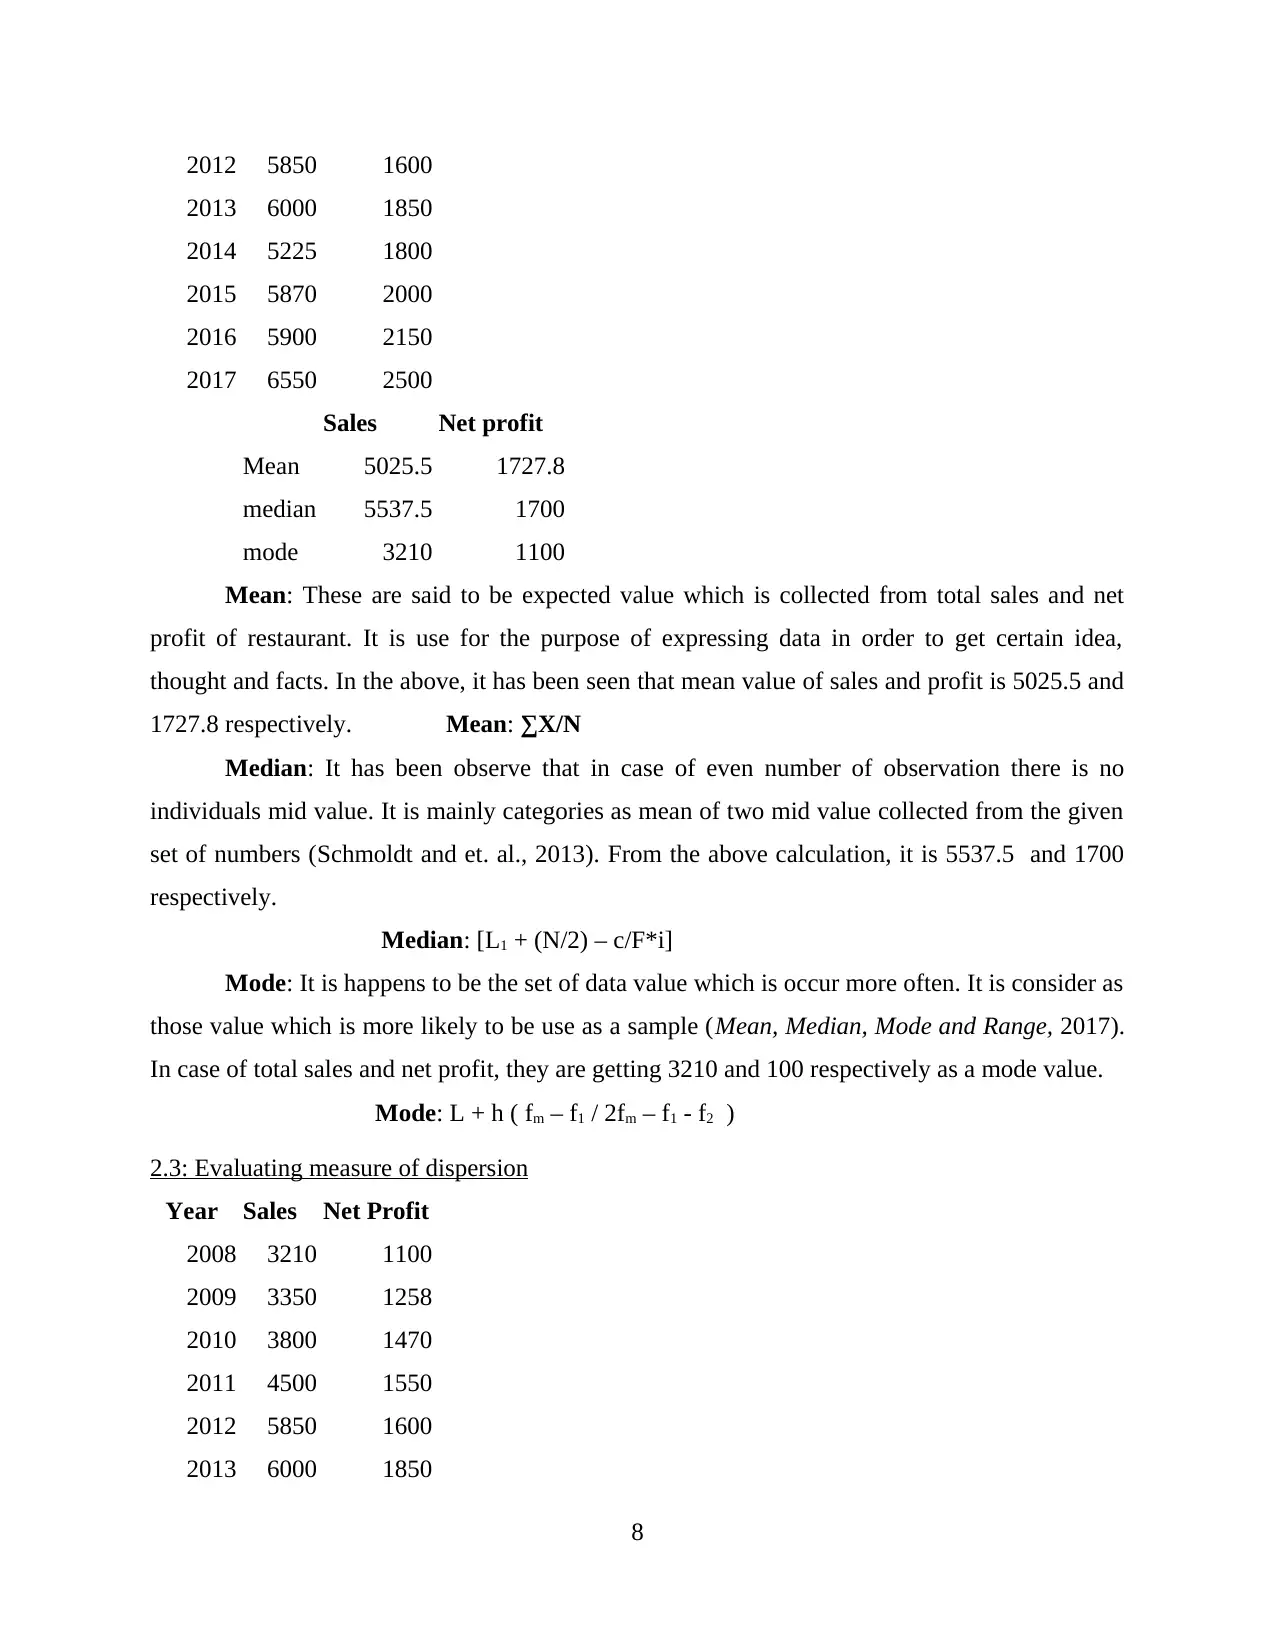
2012 5850 1600
2013 6000 1850
2014 5225 1800
2015 5870 2000
2016 5900 2150
2017 6550 2500
Sales Net profit
Mean 5025.5 1727.8
median 5537.5 1700
mode 3210 1100
Mean: These are said to be expected value which is collected from total sales and net
profit of restaurant. It is use for the purpose of expressing data in order to get certain idea,
thought and facts. In the above, it has been seen that mean value of sales and profit is 5025.5 and
1727.8 respectively. Mean: ∑X/N
Median: It has been observe that in case of even number of observation there is no
individuals mid value. It is mainly categories as mean of two mid value collected from the given
set of numbers (Schmoldt and et. al., 2013). From the above calculation, it is 5537.5 and 1700
respectively.
Median: [L1 + (N/2) – c/F*i]
Mode: It is happens to be the set of data value which is occur more often. It is consider as
those value which is more likely to be use as a sample (Mean, Median, Mode and Range, 2017).
In case of total sales and net profit, they are getting 3210 and 100 respectively as a mode value.
Mode: L + h ( fm – f1 / 2fm – f1 - f2 )
2.3: Evaluating measure of dispersion
Year Sales Net Profit
2008 3210 1100
2009 3350 1258
2010 3800 1470
2011 4500 1550
2012 5850 1600
2013 6000 1850
8
2013 6000 1850
2014 5225 1800
2015 5870 2000
2016 5900 2150
2017 6550 2500
Sales Net profit
Mean 5025.5 1727.8
median 5537.5 1700
mode 3210 1100
Mean: These are said to be expected value which is collected from total sales and net
profit of restaurant. It is use for the purpose of expressing data in order to get certain idea,
thought and facts. In the above, it has been seen that mean value of sales and profit is 5025.5 and
1727.8 respectively. Mean: ∑X/N
Median: It has been observe that in case of even number of observation there is no
individuals mid value. It is mainly categories as mean of two mid value collected from the given
set of numbers (Schmoldt and et. al., 2013). From the above calculation, it is 5537.5 and 1700
respectively.
Median: [L1 + (N/2) – c/F*i]
Mode: It is happens to be the set of data value which is occur more often. It is consider as
those value which is more likely to be use as a sample (Mean, Median, Mode and Range, 2017).
In case of total sales and net profit, they are getting 3210 and 100 respectively as a mode value.
Mode: L + h ( fm – f1 / 2fm – f1 - f2 )
2.3: Evaluating measure of dispersion
Year Sales Net Profit
2008 3210 1100
2009 3350 1258
2010 3800 1470
2011 4500 1550
2012 5850 1600
2013 6000 1850
8
Paraphrase This Document
Need a fresh take? Get an instant paraphrase of this document with our AI Paraphraser
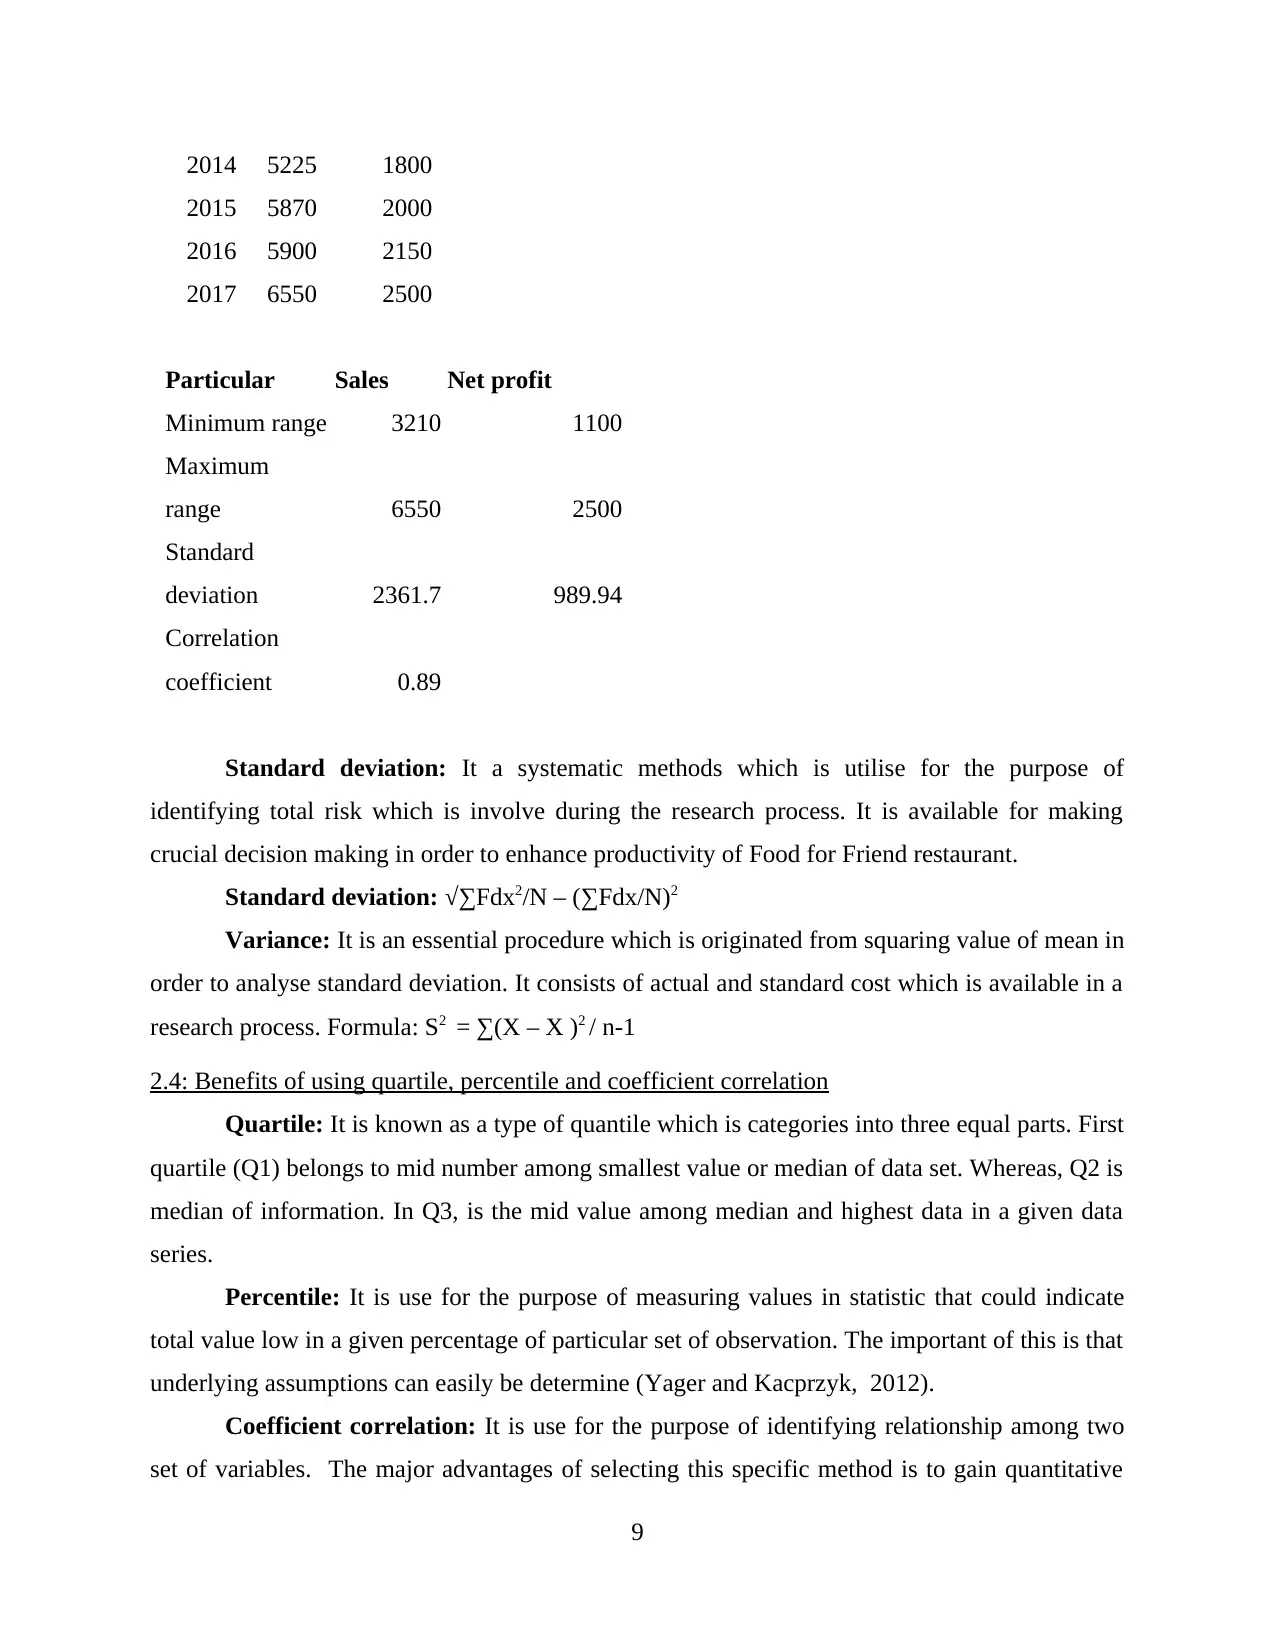
2014 5225 1800
2015 5870 2000
2016 5900 2150
2017 6550 2500
Particular Sales Net profit
Minimum range 3210 1100
Maximum
range 6550 2500
Standard
deviation 2361.7 989.94
Correlation
coefficient 0.89
Standard deviation: It a systematic methods which is utilise for the purpose of
identifying total risk which is involve during the research process. It is available for making
crucial decision making in order to enhance productivity of Food for Friend restaurant.
Standard deviation: √∑Fdx2/N – (∑Fdx/N)2
Variance: It is an essential procedure which is originated from squaring value of mean in
order to analyse standard deviation. It consists of actual and standard cost which is available in a
research process. Formula: S2 = ∑(X – X )2 / n-1
2.4: Benefits of using quartile, percentile and coefficient correlation
Quartile: It is known as a type of quantile which is categories into three equal parts. First
quartile (Q1) belongs to mid number among smallest value or median of data set. Whereas, Q2 is
median of information. In Q3, is the mid value among median and highest data in a given data
series.
Percentile: It is use for the purpose of measuring values in statistic that could indicate
total value low in a given percentage of particular set of observation. The important of this is that
underlying assumptions can easily be determine (Yager and Kacprzyk, 2012).
Coefficient correlation: It is use for the purpose of identifying relationship among two
set of variables. The major advantages of selecting this specific method is to gain quantitative
9
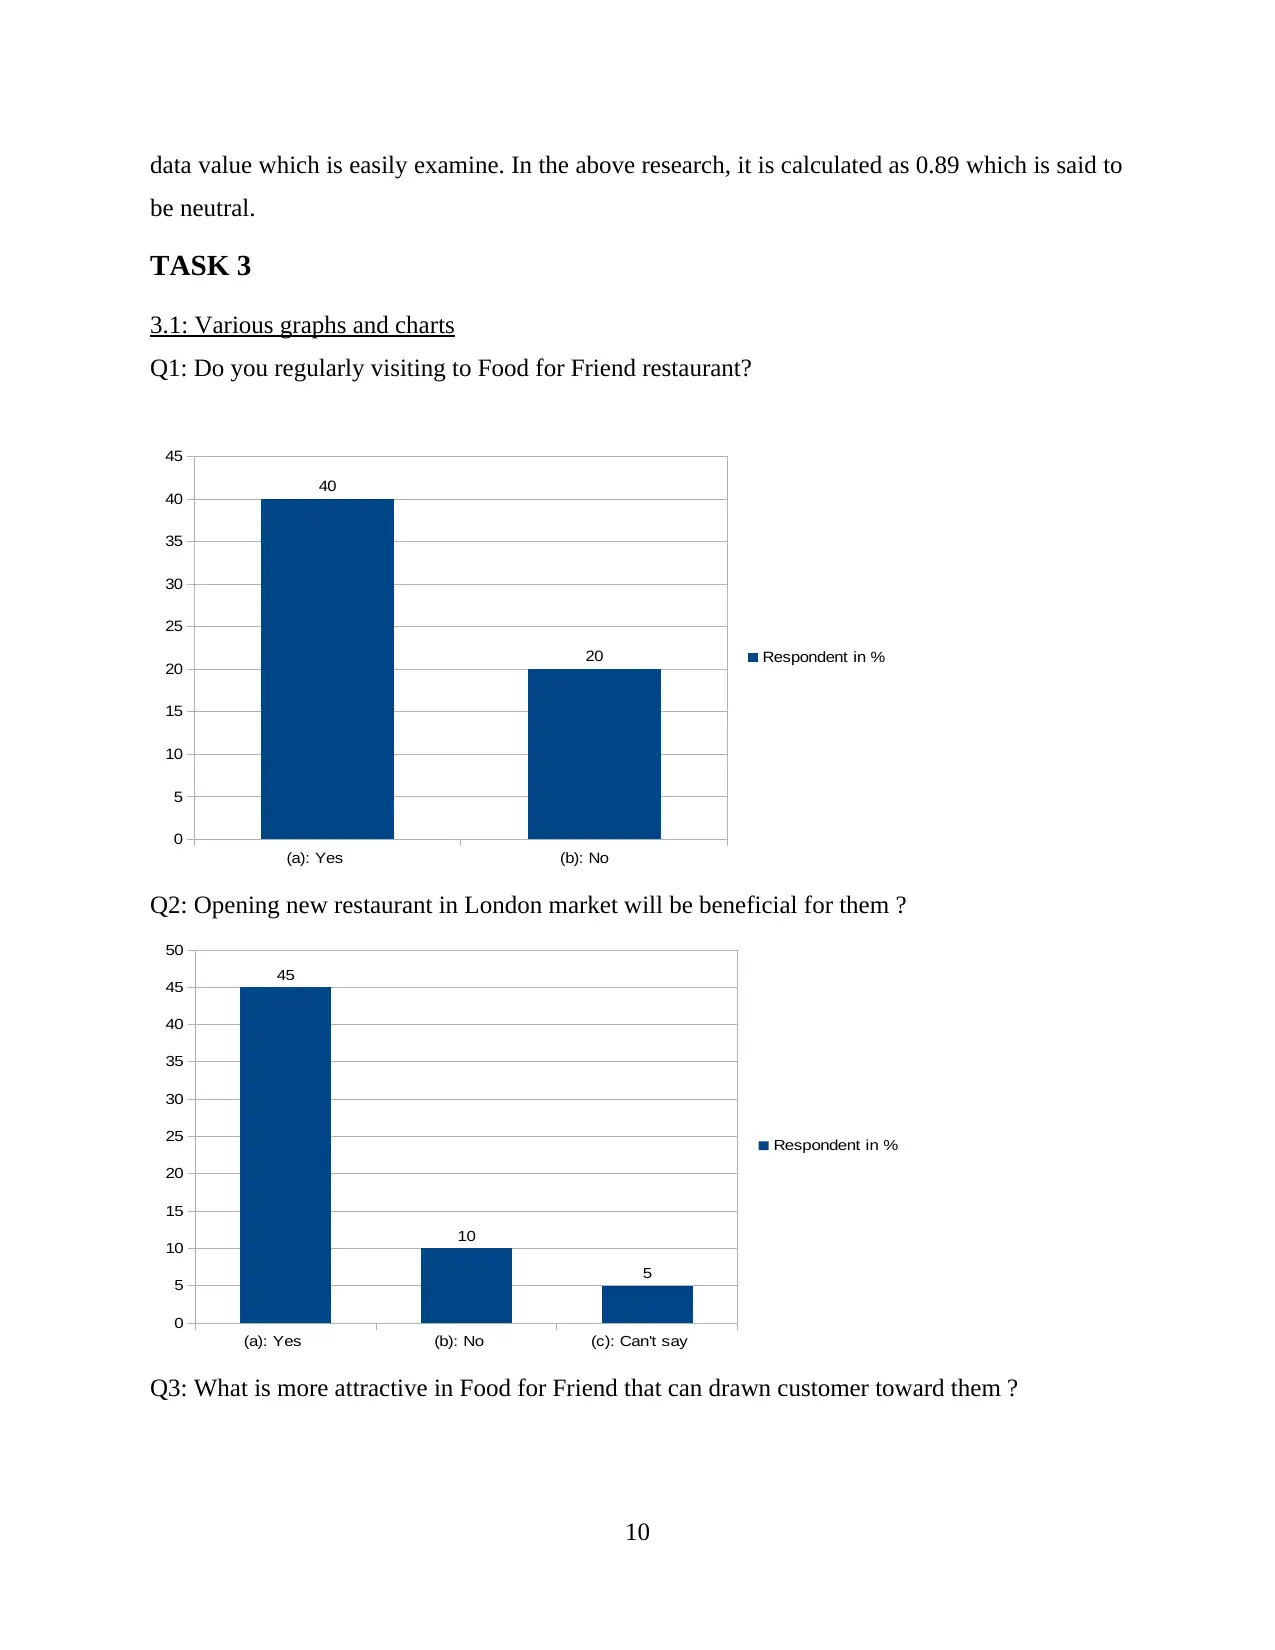
data value which is easily examine. In the above research, it is calculated as 0.89 which is said to
be neutral.
TASK 3
3.1: Various graphs and charts
Q1: Do you regularly visiting to Food for Friend restaurant?
(a): Yes (b): No
0
5
10
15
20
25
30
35
40
45
40
20 Respondent in %
Q2: Opening new restaurant in London market will be beneficial for them ?
(a): Yes (b): No (c): Can't say
0
5
10
15
20
25
30
35
40
45
50
45
10
5
Respondent in %
Q3: What is more attractive in Food for Friend that can drawn customer toward them ?
10
⊘ This is a preview!⊘
Do you want full access?
Subscribe today to unlock all pages.
Trusted by 1+ million students worldwide
1 out of 20
Related Documents


Your All-in-One AI-Powered Toolkit for Academic Success.
+13062052269
info@desklib.com
Available 24*7 on WhatsApp / Email
![[object Object]](/_next/static/media/star-bottom.7253800d.svg)
Unlock your academic potential
Copyright © 2020–2026 A2Z Services. All Rights Reserved. Developed and managed by ZUCOL.