Business Decision Making Report: Food for Friends Analysis
VerifiedAdded on 2020/07/22
|24
|4270
|40
Report
AI Summary
This report analyzes the business decision-making process for a restaurant, Food for Friends, aiming to open a new branch in London. The report details the use of primary and secondary data collection methods, including questionnaires and surveys, to gather customer feedback and market insights. It covers survey methodologies, sample framing, and questionnaire design to address business problems. The analysis includes summarizing data using mean, median, and mode, along with measures of dispersion to draw valid conclusions. Furthermore, the report explores information processing tools, critical path analysis, and financial tools like NPV and IRR to enhance decision-making. The findings and conclusions are presented to aid the restaurant's expansion strategy.

BDM
Paraphrase This Document
Need a fresh take? Get an instant paraphrase of this document with our AI Paraphraser
Table of Contents
INTRODUCTION...........................................................................................................................1
TASK 1............................................................................................................................................1
1.1 Creation of plan.....................................................................................................................1
1.2 Survey methodologies and sample framing..........................................................................2
1.3 Questionnaire........................................................................................................................3
TASK 2............................................................................................................................................4
2.1: Creating data by summarising information with the help of representative value..............4
2.2: Analysis of data by collected from the research .................................................................8
2.3: Evaluating measure of dispersion........................................................................................9
2.4 Use of quartiles, percentiles and correlation coefficient.......................................................9
TASK 3..........................................................................................................................................10
3.1 Presentation of graph to provide information.....................................................................10
3.2 Trend line............................................................................................................................16
3.3 Covered in PPT...................................................................................................................17
3.4 Formal business report........................................................................................................17
TASK 4..........................................................................................................................................18
4.1 Information processing tools...............................................................................................18
4.2 Analysis of critical path .....................................................................................................19
4.3 Financial tools in decision-making.....................................................................................19
CONCLUSION..............................................................................................................................20
REFERENCES..............................................................................................................................21
INTRODUCTION
Decision-making is integral part of every organisation which helps to accomplish their
business objectives and targets within stipulated period of time. To make their business
operations successful in future need to plan their daily operations in continuous basis. Research
plays an important role in collection of important information regarding different aspects which
indirectly enhance decision making power of management. NPV and IRR such financial tools
which helps in selection of most profitable project. Food for Friends is a restaurant which
provides their services in UK. The main aim of restaurant is to open another branch in London
(Groebner and et. al., 2011).
In the present report explain about, use of primary and secondary method of data
collection in creation of plan, survey methodologies and sample framing, designing of
questionnaire to address business problems, interpretation of data by use of mean, median and
mode and draw important conclusions by use of different methods of dispersion. Also, use of
information processing and financial tools to enhance decision-making.
TASK 1
1.1 Creation of plan
Food for Friends is restaurant which provides different kinds of foods in London. This
restaurant is specialised in providence of snacks, seafood and cheese. Due to having successful
business operations, management wants to open new branch in London. To check the viability of
their move they want to know the views and feedbacks customers. For this purpose, management
of Food for friend decided to carry out research by the use of primary and secondary methods of
data collection to enhance their decision making power.
⊘ This is a preview!⊘
Do you want full access?
Subscribe today to unlock all pages.
Trusted by 1+ million students worldwide
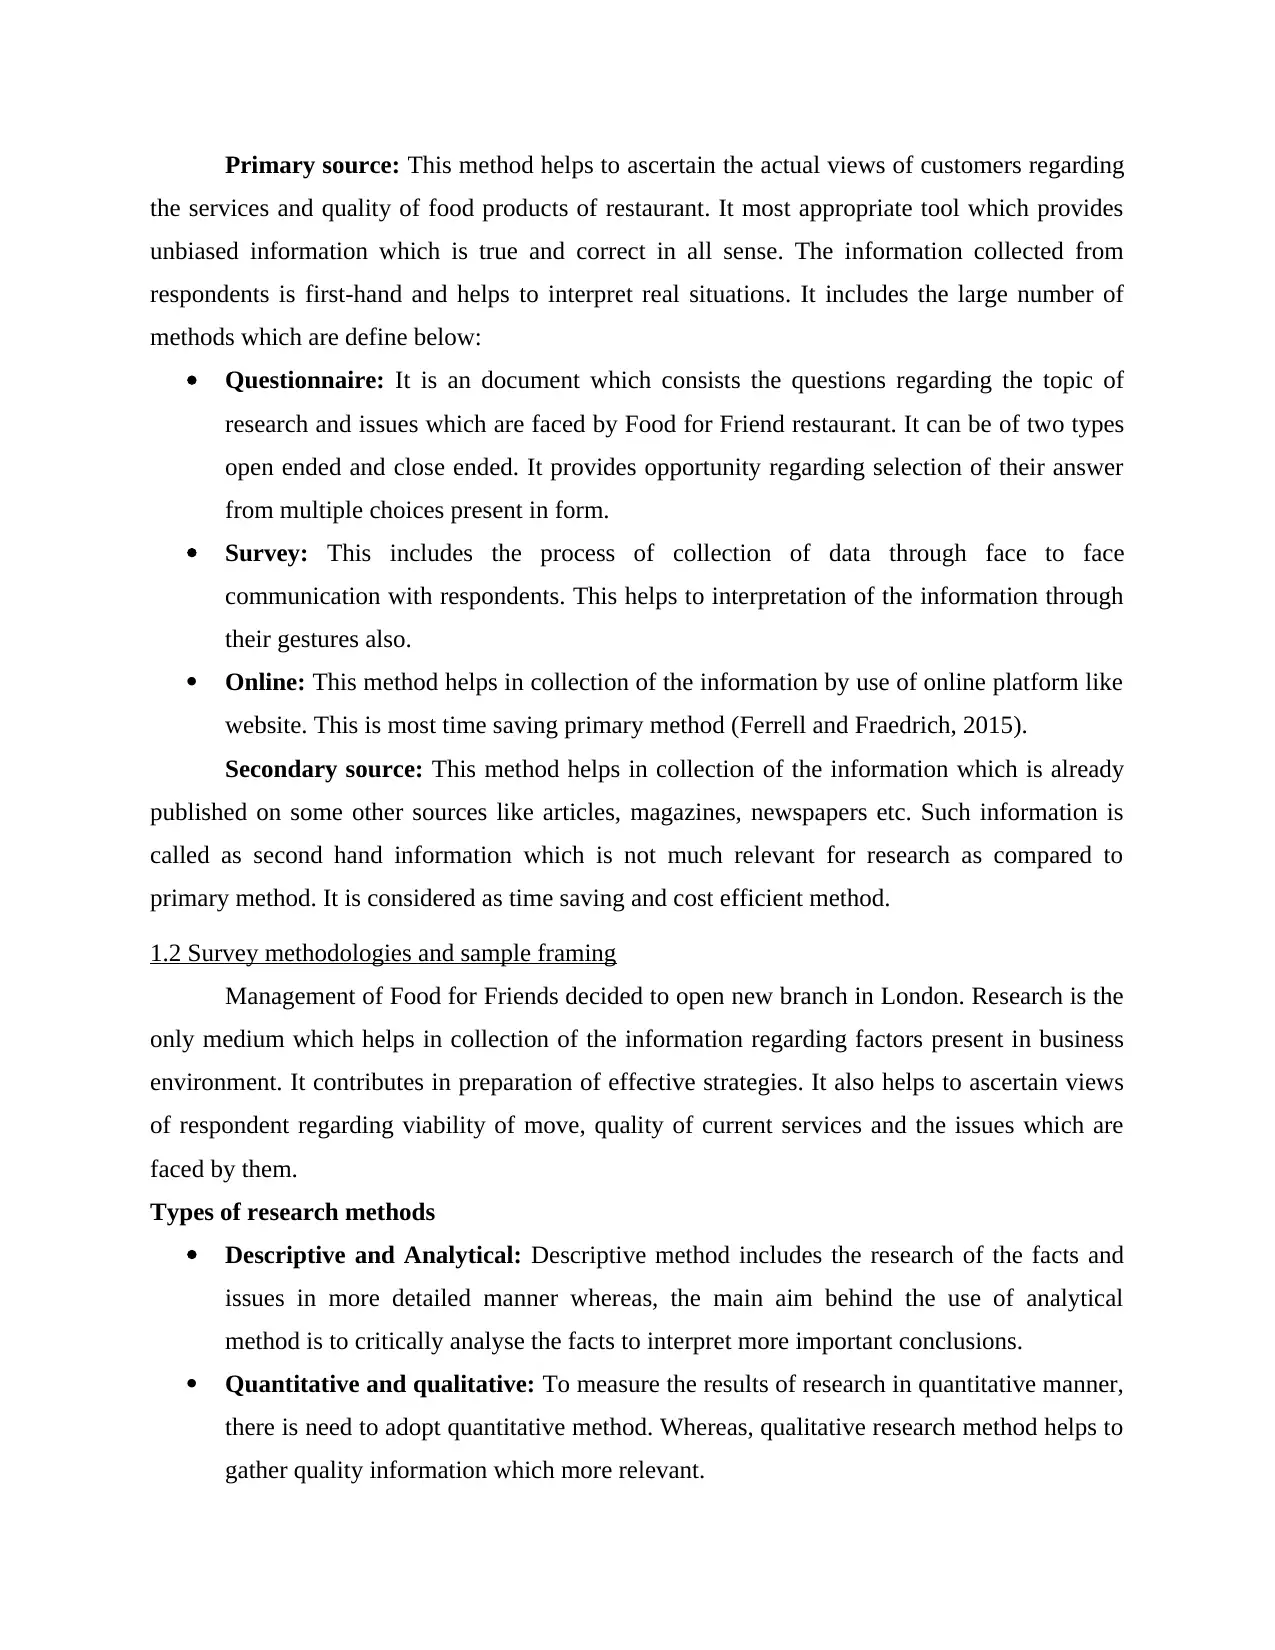
Primary source: This method helps to ascertain the actual views of customers regarding
the services and quality of food products of restaurant. It most appropriate tool which provides
unbiased information which is true and correct in all sense. The information collected from
respondents is first-hand and helps to interpret real situations. It includes the large number of
methods which are define below:
Questionnaire: It is an document which consists the questions regarding the topic of
research and issues which are faced by Food for Friend restaurant. It can be of two types
open ended and close ended. It provides opportunity regarding selection of their answer
from multiple choices present in form.
Survey: This includes the process of collection of data through face to face
communication with respondents. This helps to interpretation of the information through
their gestures also.
Online: This method helps in collection of the information by use of online platform like
website. This is most time saving primary method (Ferrell and Fraedrich, 2015).
Secondary source: This method helps in collection of the information which is already
published on some other sources like articles, magazines, newspapers etc. Such information is
called as second hand information which is not much relevant for research as compared to
primary method. It is considered as time saving and cost efficient method.
1.2 Survey methodologies and sample framing
Management of Food for Friends decided to open new branch in London. Research is the
only medium which helps in collection of the information regarding factors present in business
environment. It contributes in preparation of effective strategies. It also helps to ascertain views
of respondent regarding viability of move, quality of current services and the issues which are
faced by them.
Types of research methods
Descriptive and Analytical: Descriptive method includes the research of the facts and
issues in more detailed manner whereas, the main aim behind the use of analytical
method is to critically analyse the facts to interpret more important conclusions.
Quantitative and qualitative: To measure the results of research in quantitative manner,
there is need to adopt quantitative method. Whereas, qualitative research method helps to
gather quality information which more relevant.
Paraphrase This Document
Need a fresh take? Get an instant paraphrase of this document with our AI Paraphraser
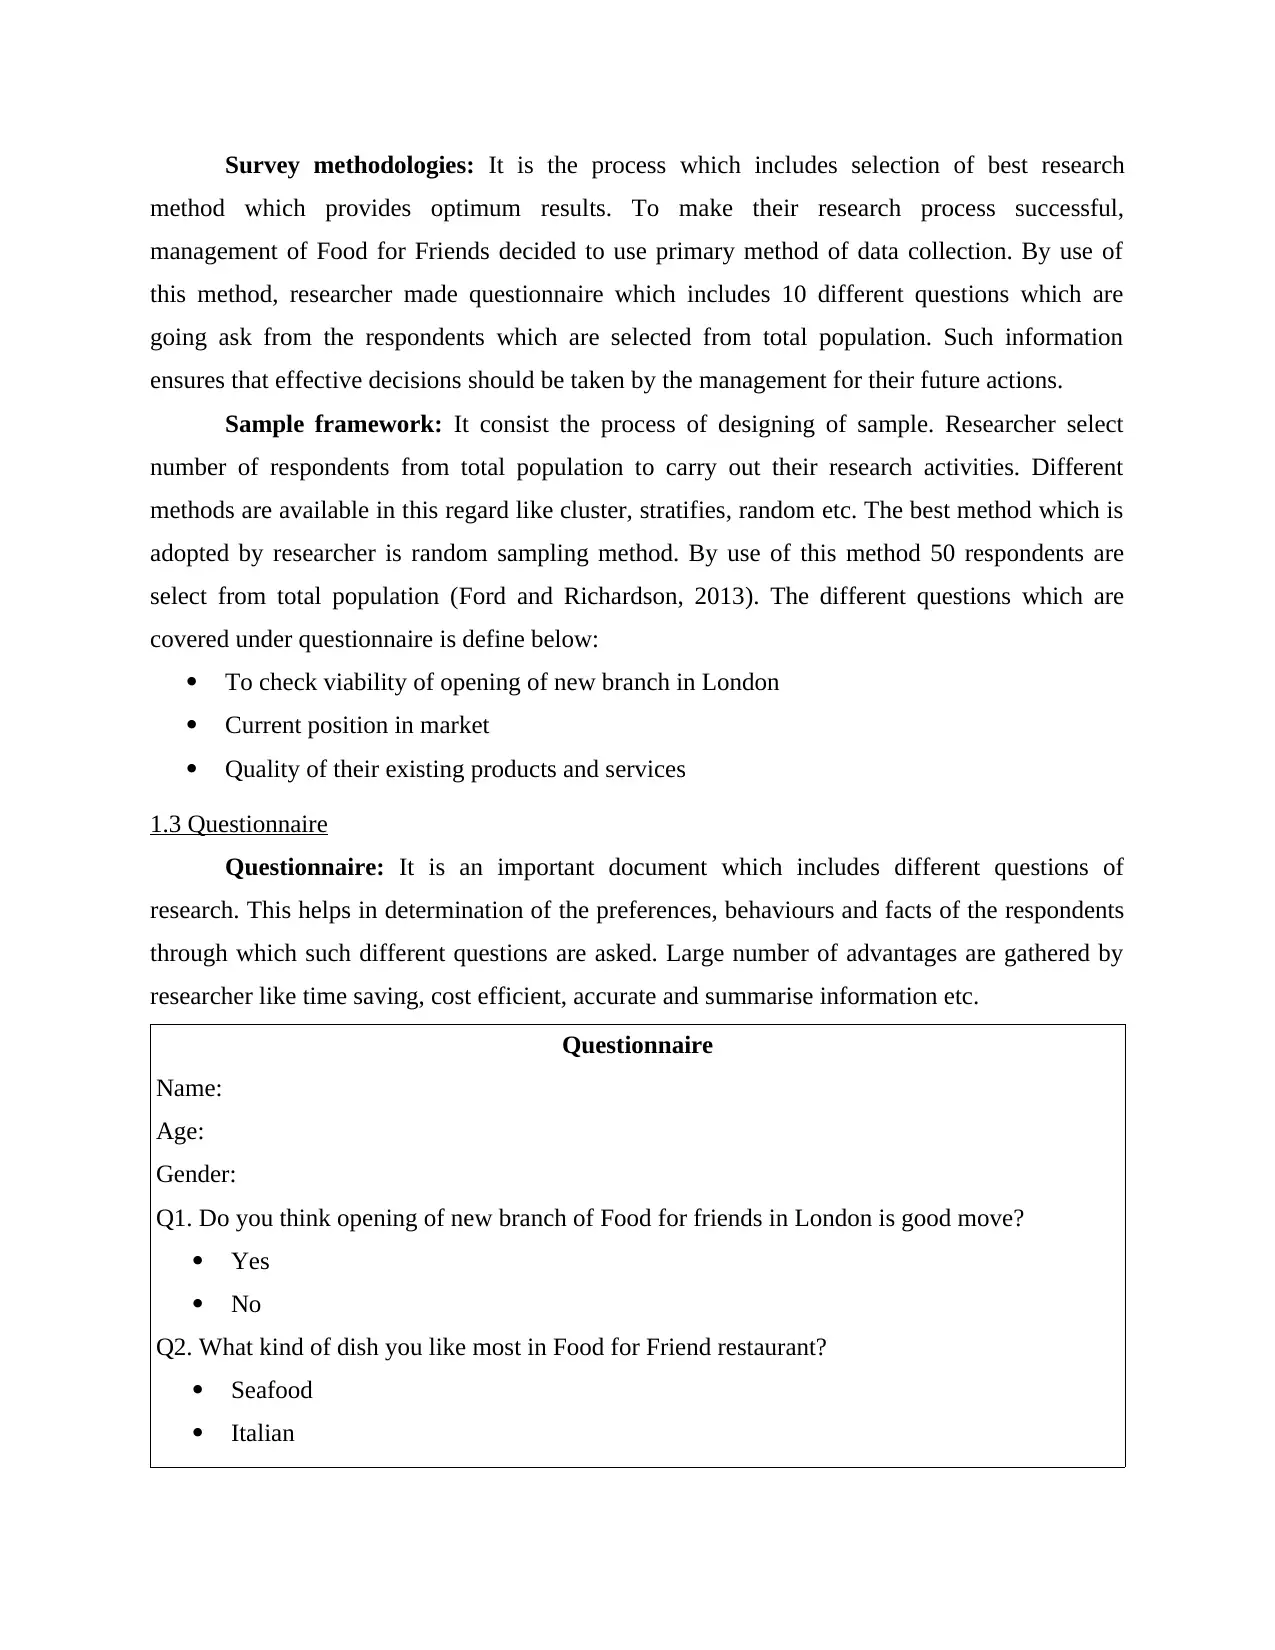
Survey methodologies: It is the process which includes selection of best research
method which provides optimum results. To make their research process successful,
management of Food for Friends decided to use primary method of data collection. By use of
this method, researcher made questionnaire which includes 10 different questions which are
going ask from the respondents which are selected from total population. Such information
ensures that effective decisions should be taken by the management for their future actions.
Sample framework: It consist the process of designing of sample. Researcher select
number of respondents from total population to carry out their research activities. Different
methods are available in this regard like cluster, stratifies, random etc. The best method which is
adopted by researcher is random sampling method. By use of this method 50 respondents are
select from total population (Ford and Richardson, 2013). The different questions which are
covered under questionnaire is define below:
To check viability of opening of new branch in London
Current position in market
Quality of their existing products and services
1.3 Questionnaire
Questionnaire: It is an important document which includes different questions of
research. This helps in determination of the preferences, behaviours and facts of the respondents
through which such different questions are asked. Large number of advantages are gathered by
researcher like time saving, cost efficient, accurate and summarise information etc.
Questionnaire
Name:
Age:
Gender:
Q1. Do you think opening of new branch of Food for friends in London is good move?
Yes
No
Q2. What kind of dish you like most in Food for Friend restaurant?
Seafood
Italian
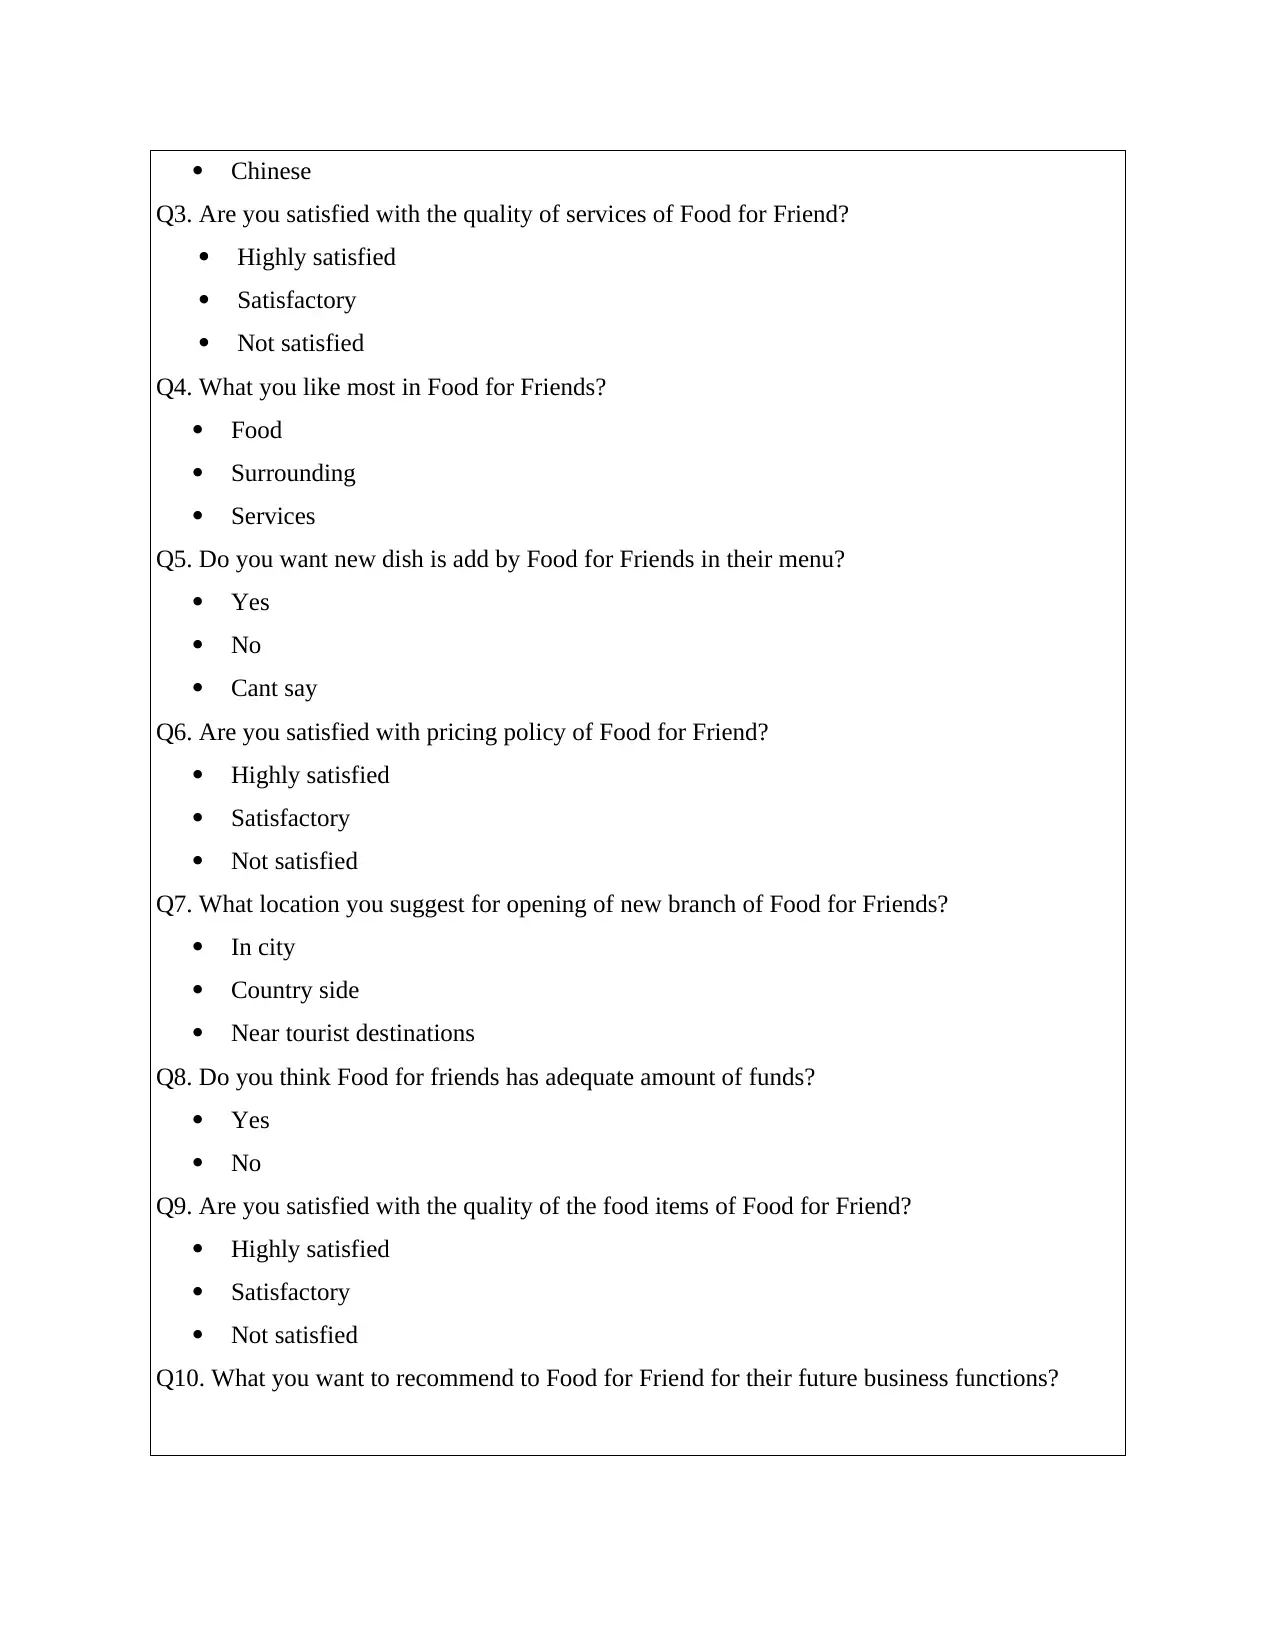
Chinese
Q3. Are you satisfied with the quality of services of Food for Friend?
Highly satisfied
Satisfactory
Not satisfied
Q4. What you like most in Food for Friends?
Food
Surrounding
Services
Q5. Do you want new dish is add by Food for Friends in their menu?
Yes
No
Cant say
Q6. Are you satisfied with pricing policy of Food for Friend?
Highly satisfied
Satisfactory
Not satisfied
Q7. What location you suggest for opening of new branch of Food for Friends?
In city
Country side
Near tourist destinations
Q8. Do you think Food for friends has adequate amount of funds?
Yes
No
Q9. Are you satisfied with the quality of the food items of Food for Friend?
Highly satisfied
Satisfactory
Not satisfied
Q10. What you want to recommend to Food for Friend for their future business functions?
⊘ This is a preview!⊘
Do you want full access?
Subscribe today to unlock all pages.
Trusted by 1+ million students worldwide
TASK 2
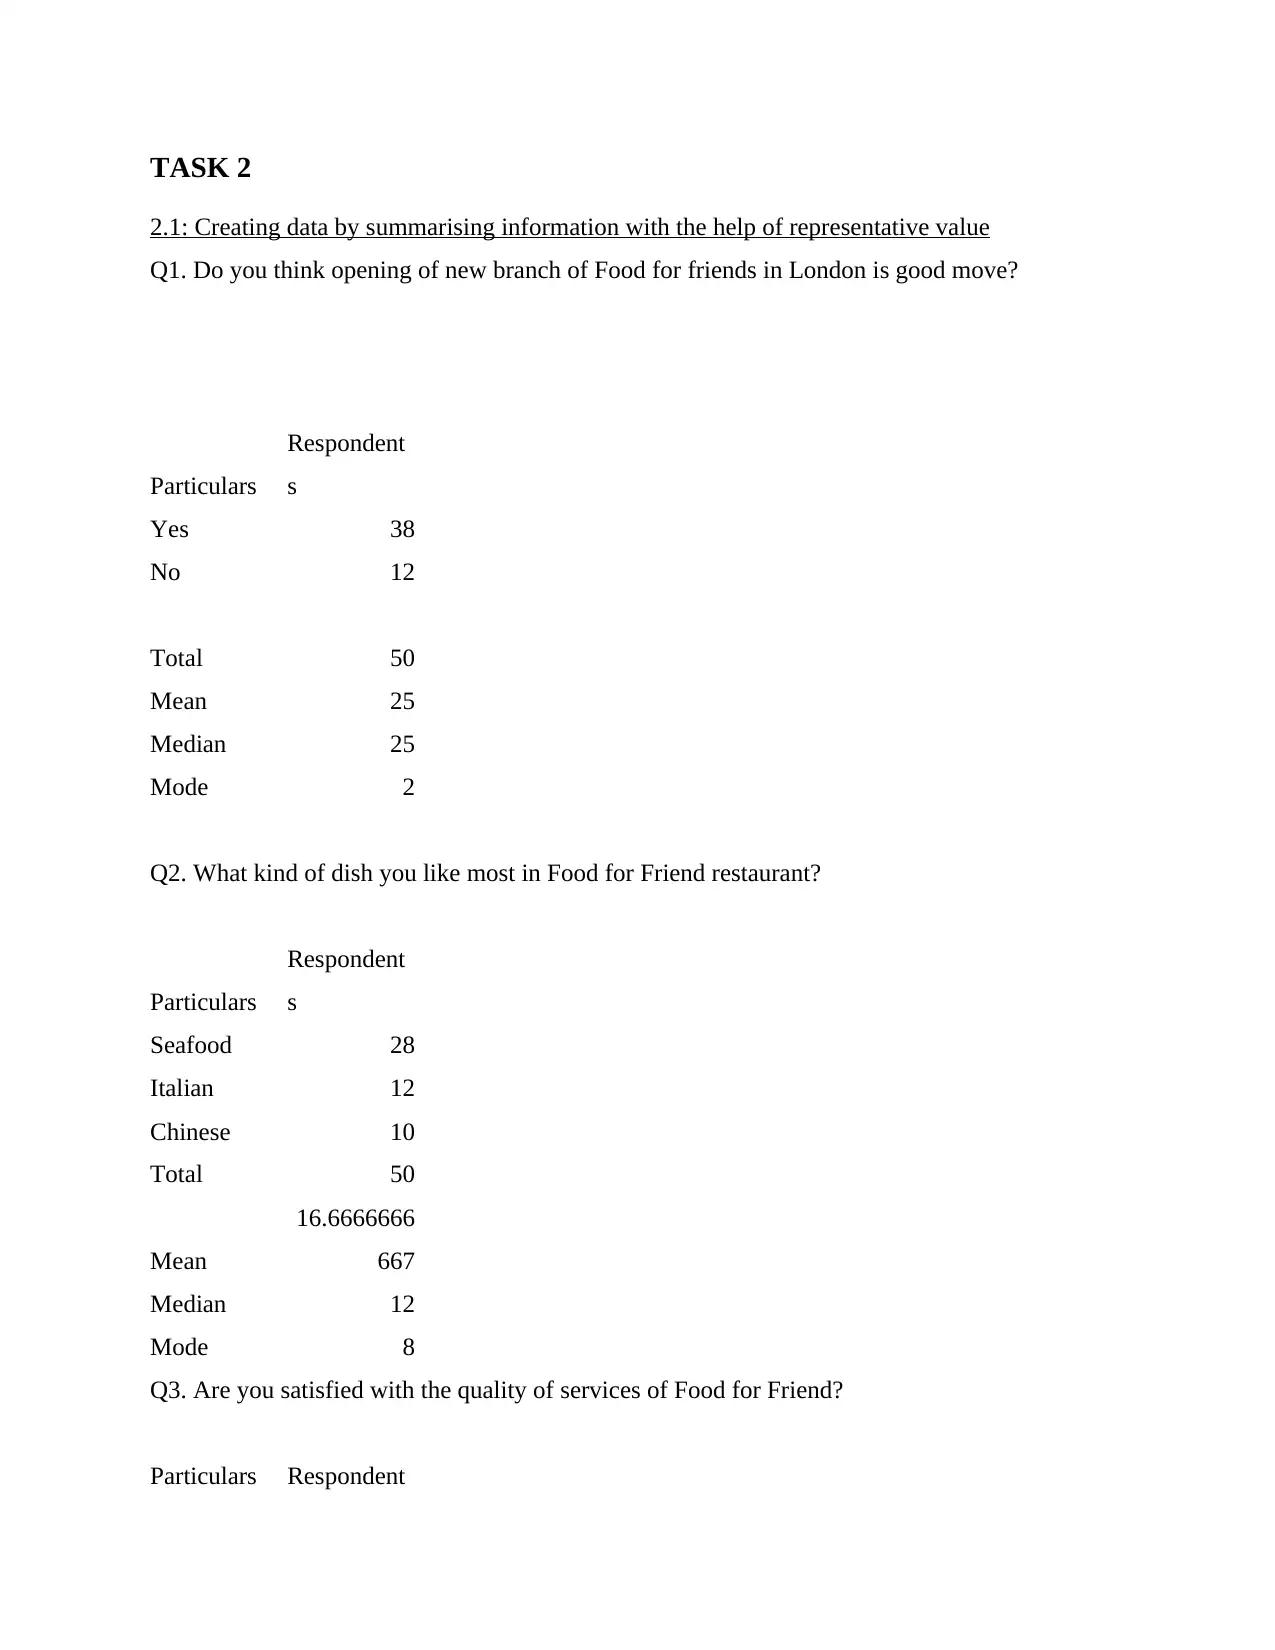
2.1: Creating data by summarising information with the help of representative value
Q1. Do you think opening of new branch of Food for friends in London is good move?
Particulars
Respondent
s
Yes 38
No 12
Total 50
Mean 25
Median 25
Mode 2
Q2. What kind of dish you like most in Food for Friend restaurant?
Particulars
Respondent
s
Seafood 28
Italian 12
Chinese 10
Total 50
Mean
16.6666666
667
Median 12
Mode 8
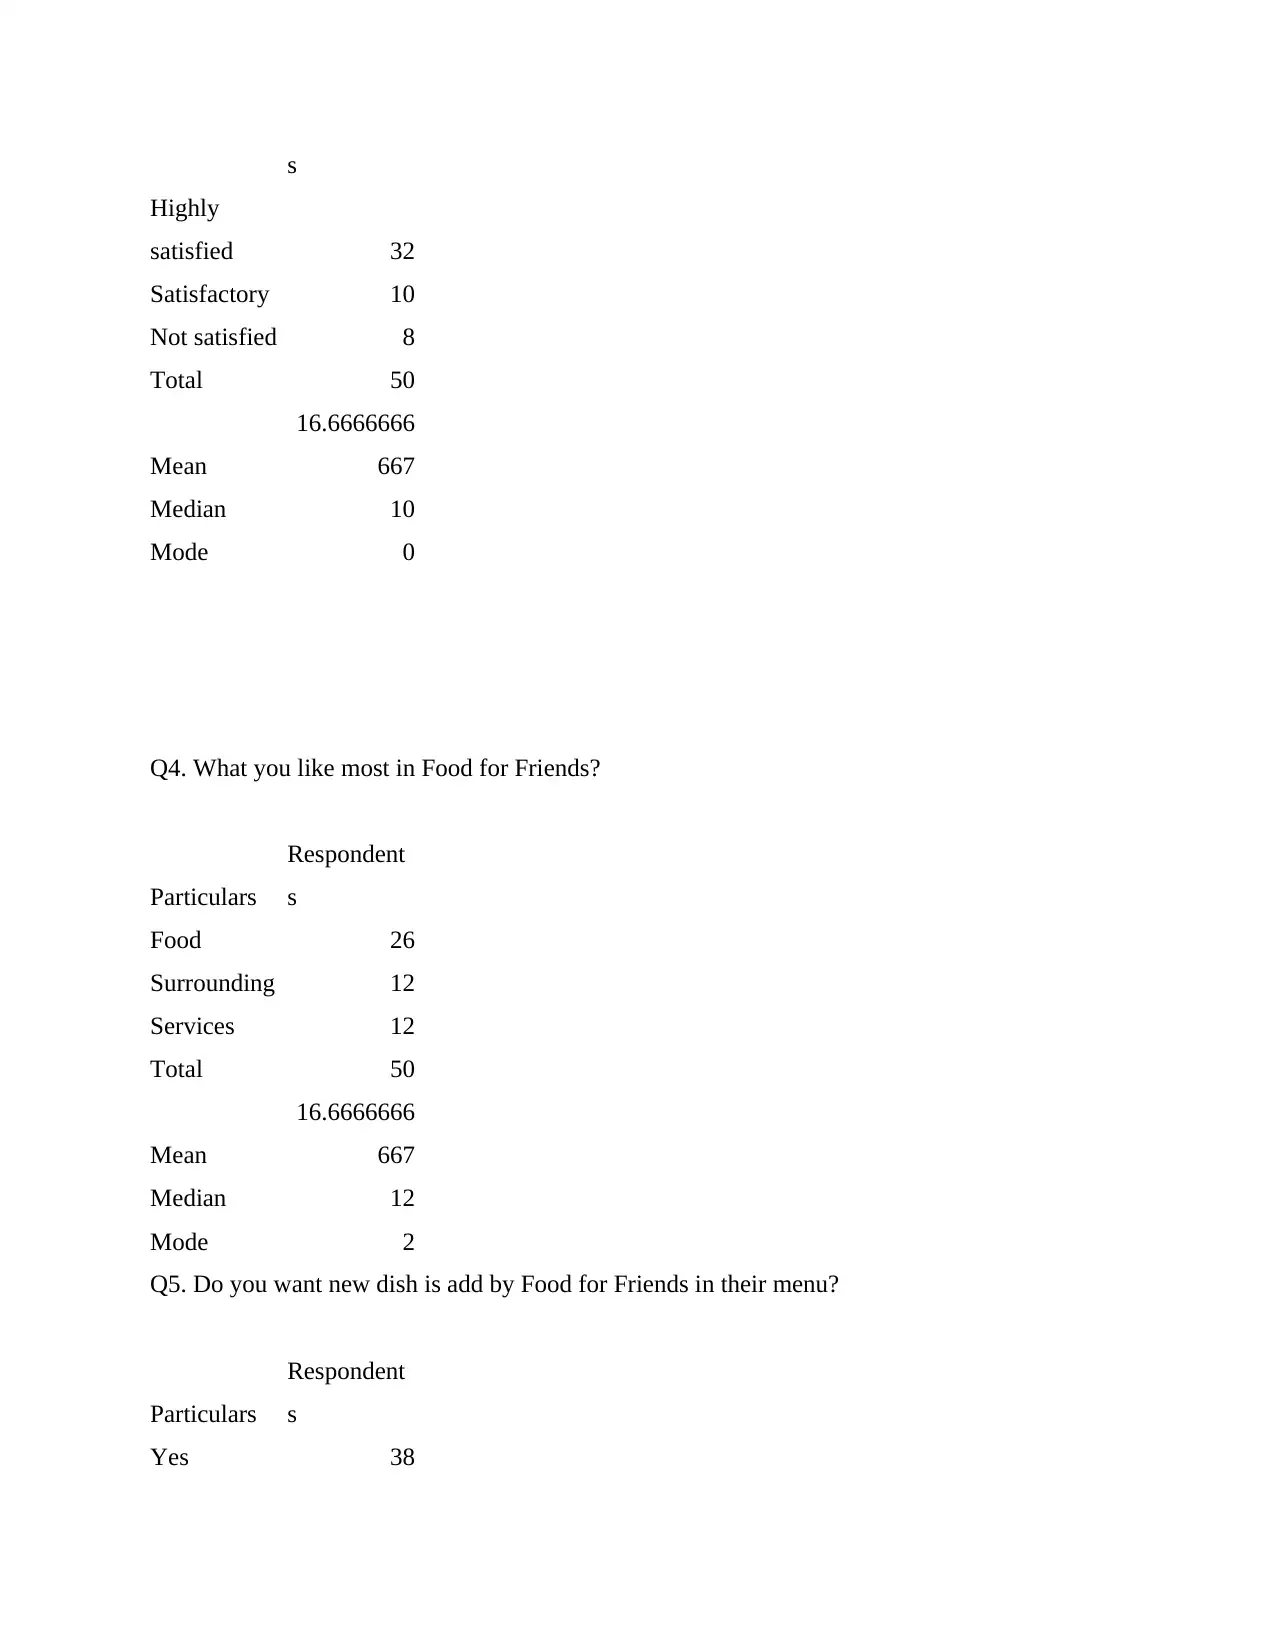
Q3. Are you satisfied with the quality of services of Food for Friend?
Particulars Respondent
2.1: Creating data by summarising information with the help of representative value
Q1. Do you think opening of new branch of Food for friends in London is good move?
Particulars
Respondent
s
Yes 38
No 12
Total 50
Mean 25
Median 25
Mode 2
Q2. What kind of dish you like most in Food for Friend restaurant?
Particulars
Respondent
s
Seafood 28
Italian 12
Chinese 10
Total 50
Mean
16.6666666
667
Median 12
Mode 8
Q3. Are you satisfied with the quality of services of Food for Friend?
Particulars Respondent
Paraphrase This Document
Need a fresh take? Get an instant paraphrase of this document with our AI Paraphraser
s
Highly
satisfied 32
Satisfactory 10
Not satisfied 8
Total 50
Mean
16.6666666
667
Median 10
Mode 0
Q4. What you like most in Food for Friends?
Particulars
Respondent
s
Food 26
Surrounding 12
Services 12
Total 50
Mean
16.6666666
667
Median 12
Mode 2
Q5. Do you want new dish is add by Food for Friends in their menu?
Particulars
Respondent
s
Yes 38
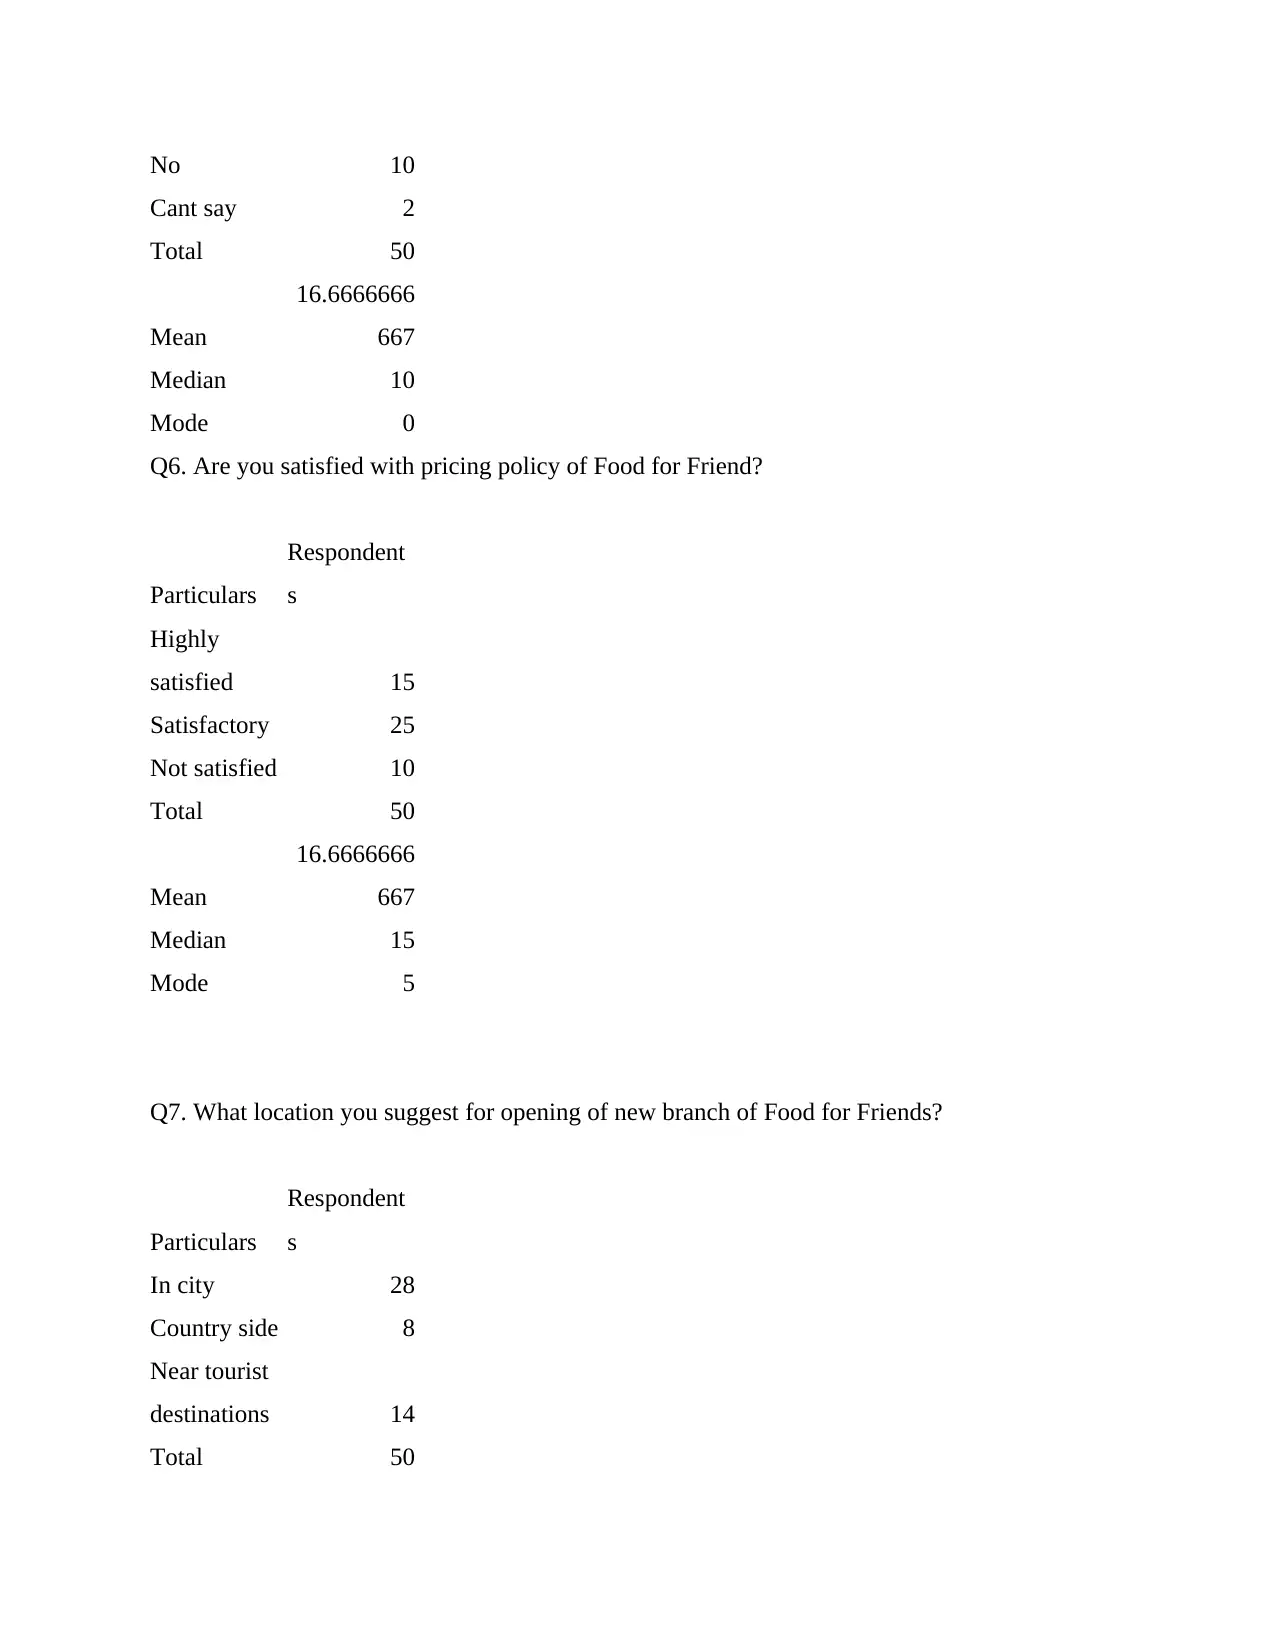
No 10
Cant say 2
Total 50
Mean
16.6666666
667
Median 10
Mode 0
Q6. Are you satisfied with pricing policy of Food for Friend?
Particulars
Respondent
s
Highly
satisfied 15
Satisfactory 25
Not satisfied 10
Total 50
Mean
16.6666666
667
Median 15
Mode 5
Q7. What location you suggest for opening of new branch of Food for Friends?
Particulars
Respondent
s
In city 28
Country side 8
Near tourist
destinations 14
Total 50
⊘ This is a preview!⊘
Do you want full access?
Subscribe today to unlock all pages.
Trusted by 1+ million students worldwide
Mean
16.6666666
667
Median 14
Mode 0
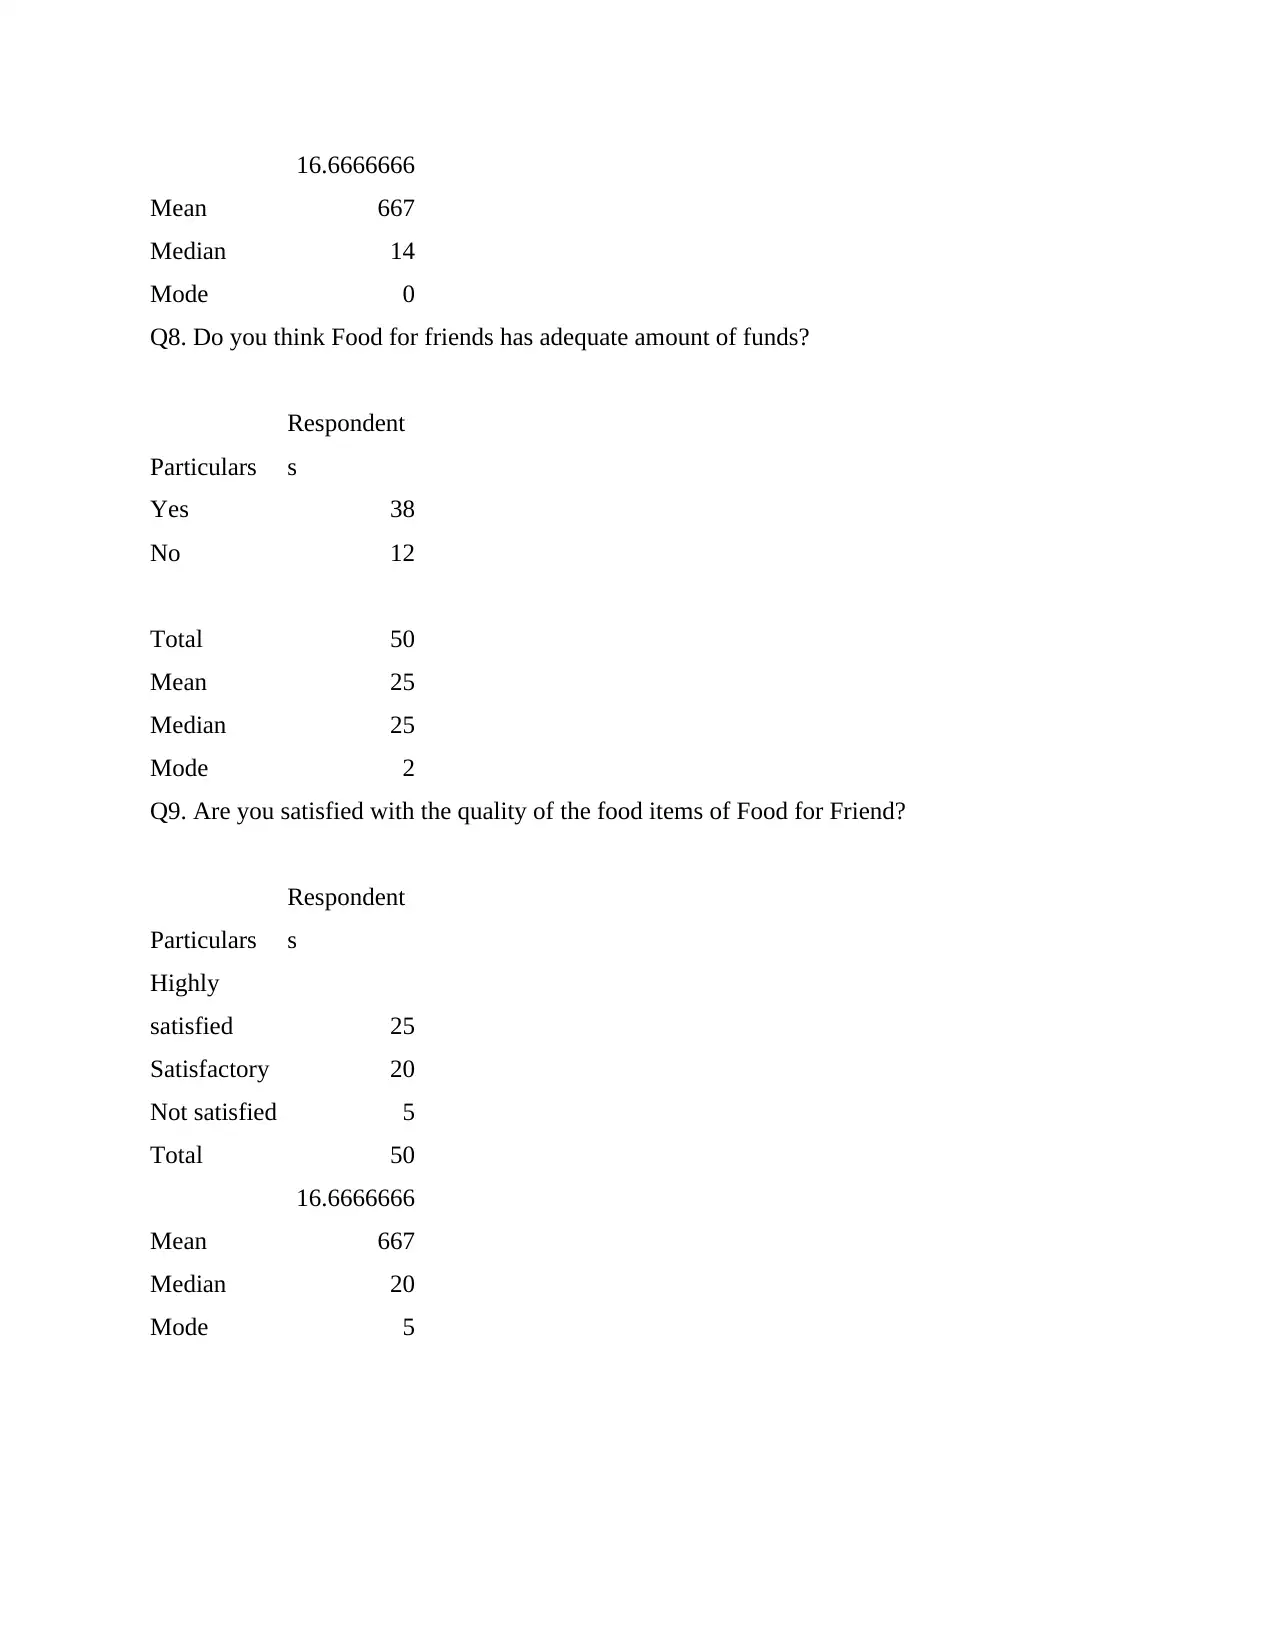
Q8. Do you think Food for friends has adequate amount of funds?
Particulars
Respondent
s
Yes 38
No 12
Total 50
Mean 25
Median 25
Mode 2
Q9. Are you satisfied with the quality of the food items of Food for Friend?
Particulars
Respondent
s
Highly
satisfied 25
Satisfactory 20
Not satisfied 5
Total 50
Mean
16.6666666
667
Median 20
Mode 5
16.6666666
667
Median 14
Mode 0
Q8. Do you think Food for friends has adequate amount of funds?
Particulars
Respondent
s
Yes 38
No 12
Total 50
Mean 25
Median 25
Mode 2
Q9. Are you satisfied with the quality of the food items of Food for Friend?
Particulars
Respondent
s
Highly
satisfied 25
Satisfactory 20
Not satisfied 5
Total 50
Mean
16.6666666
667
Median 20
Mode 5
Paraphrase This Document
Need a fresh take? Get an instant paraphrase of this document with our AI Paraphraser
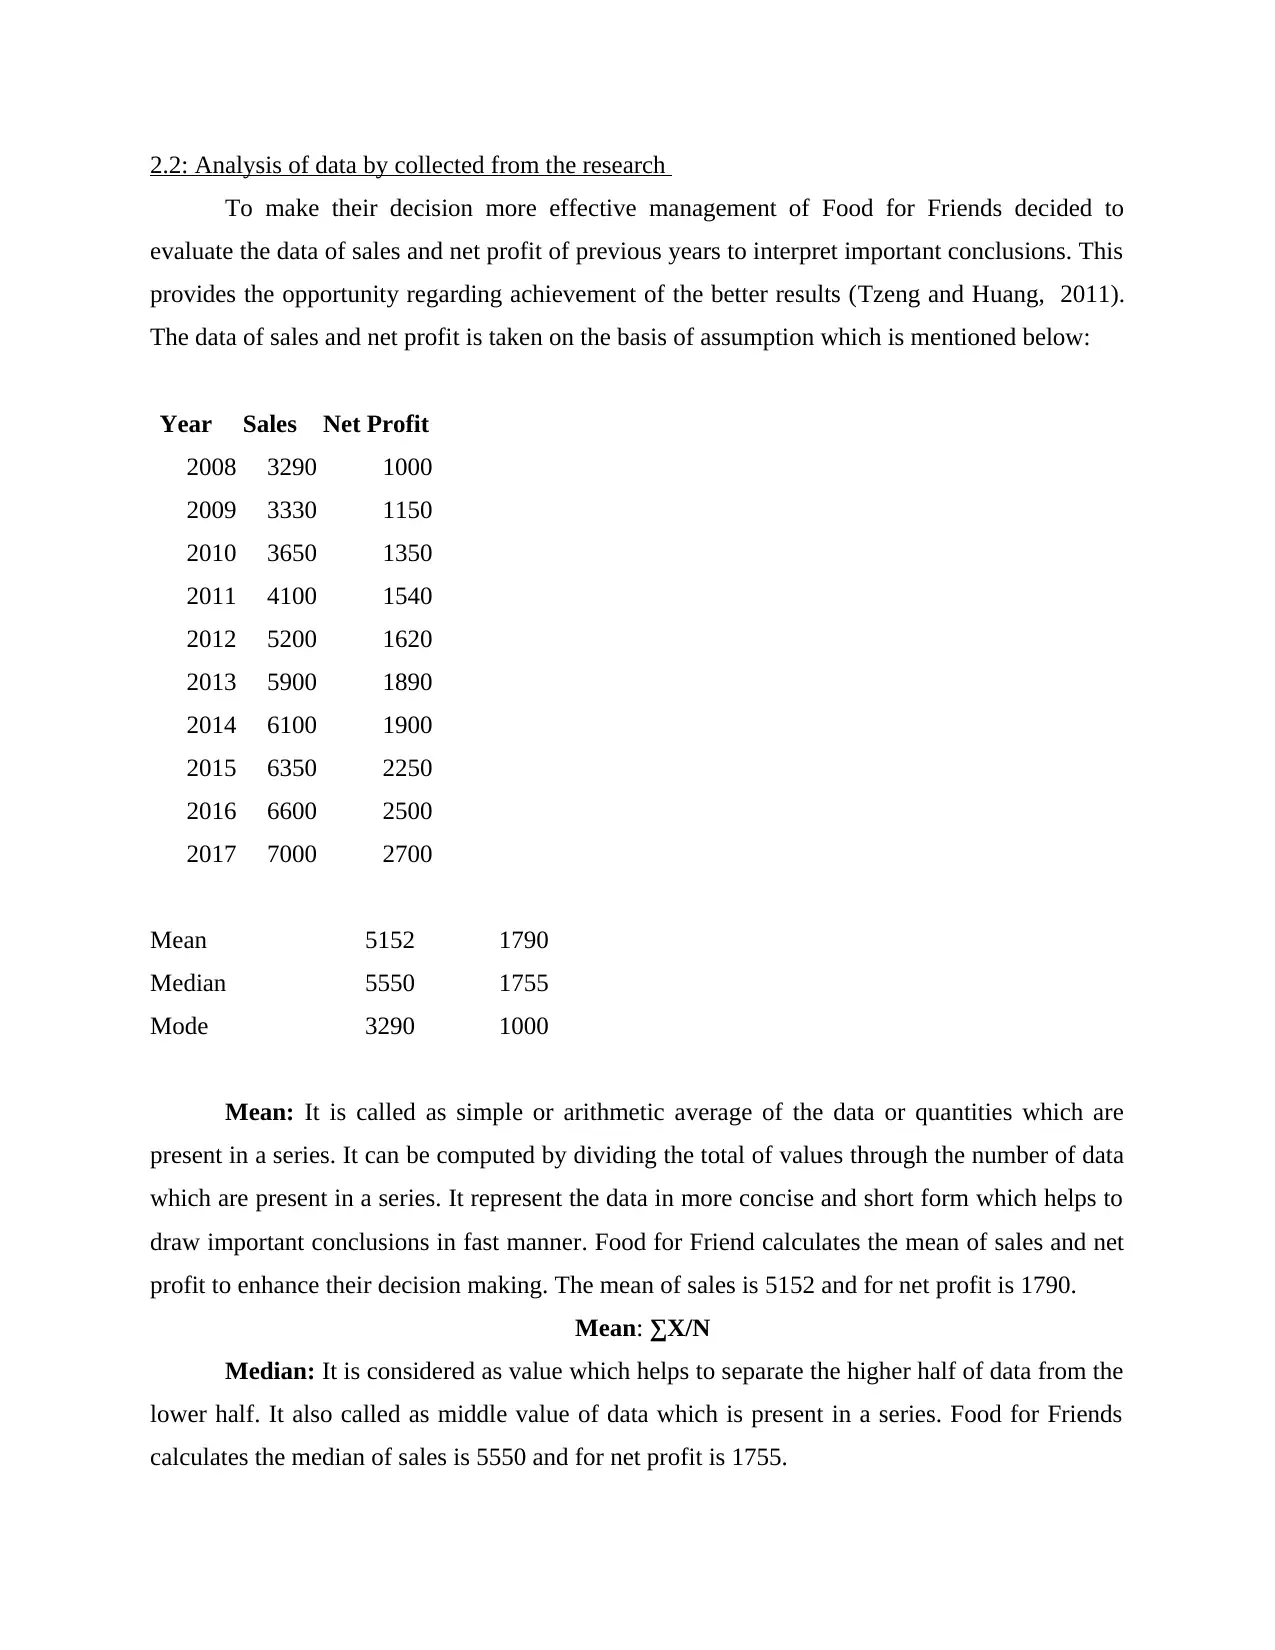
2.2: Analysis of data by collected from the research
To make their decision more effective management of Food for Friends decided to
evaluate the data of sales and net profit of previous years to interpret important conclusions. This
provides the opportunity regarding achievement of the better results (Tzeng and Huang, 2011).
The data of sales and net profit is taken on the basis of assumption which is mentioned below:
Year Sales Net Profit
2008 3290 1000
2009 3330 1150
2010 3650 1350
2011 4100 1540
2012 5200 1620
2013 5900 1890
2014 6100 1900
2015 6350 2250
2016 6600 2500
2017 7000 2700
Mean 5152 1790
Median 5550 1755
Mode 3290 1000
Mean: It is called as simple or arithmetic average of the data or quantities which are
present in a series. It can be computed by dividing the total of values through the number of data
which are present in a series. It represent the data in more concise and short form which helps to
draw important conclusions in fast manner. Food for Friend calculates the mean of sales and net
profit to enhance their decision making. The mean of sales is 5152 and for net profit is 1790.
Mean: ∑X/N
Median: It is considered as value which helps to separate the higher half of data from the
lower half. It also called as middle value of data which is present in a series. Food for Friends
calculates the median of sales is 5550 and for net profit is 1755.
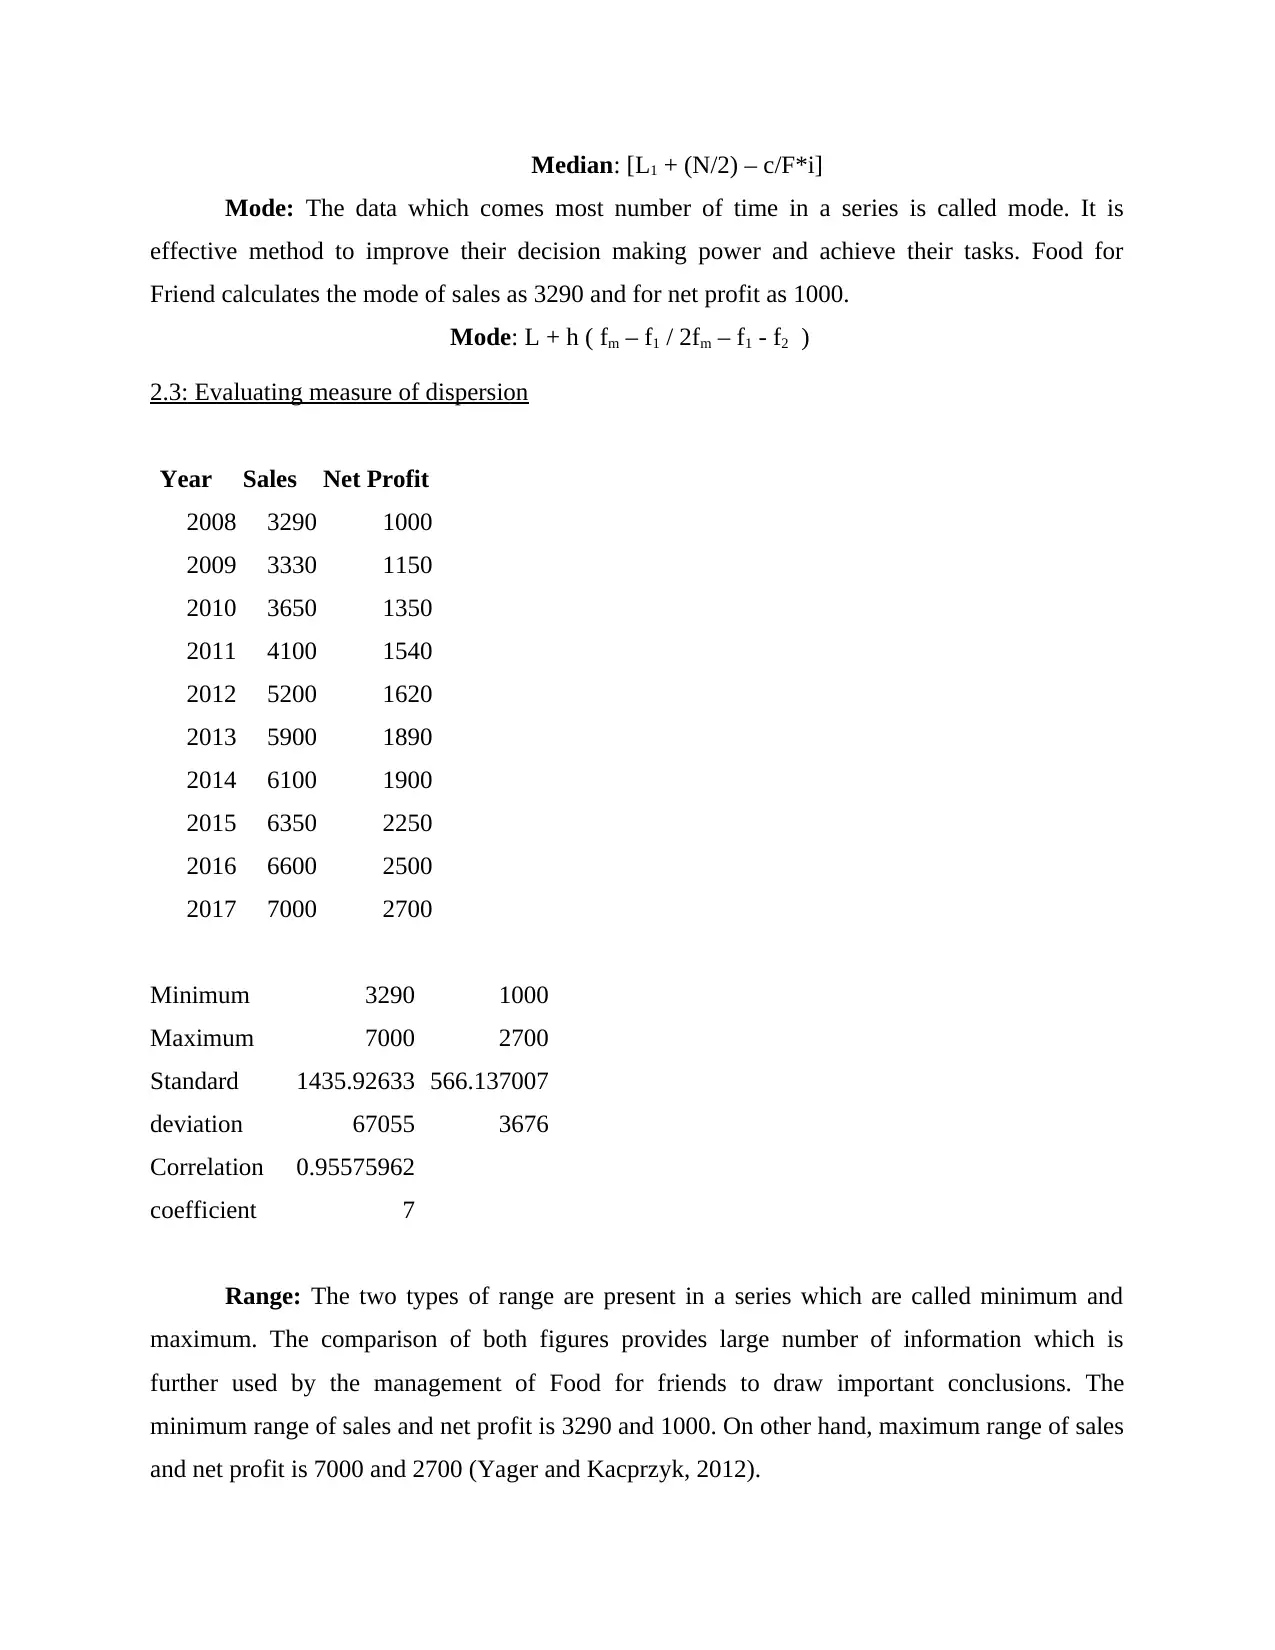
Median: [L1 + (N/2) – c/F*i]
Mode: The data which comes most number of time in a series is called mode. It is
effective method to improve their decision making power and achieve their tasks. Food for
Friend calculates the mode of sales as 3290 and for net profit as 1000.
Mode: L + h ( fm – f1 / 2fm – f1 - f2 )
2.3: Evaluating measure of dispersion
Year Sales Net Profit
2008 3290 1000
2009 3330 1150
2010 3650 1350
2011 4100 1540
2012 5200 1620
2013 5900 1890
2014 6100 1900
2015 6350 2250
2016 6600 2500
2017 7000 2700
Minimum 3290 1000
Maximum 7000 2700
Standard
deviation
1435.92633
67055
566.137007
3676
Correlation
coefficient
0.95575962
7
Range: The two types of range are present in a series which are called minimum and
maximum. The comparison of both figures provides large number of information which is
further used by the management of Food for friends to draw important conclusions. The
minimum range of sales and net profit is 3290 and 1000. On other hand, maximum range of sales
and net profit is 7000 and 2700 (Yager and Kacprzyk, 2012).
⊘ This is a preview!⊘
Do you want full access?
Subscribe today to unlock all pages.
Trusted by 1+ million students worldwide
1 out of 24
Related Documents


Your All-in-One AI-Powered Toolkit for Academic Success.
+13062052269
info@desklib.com
Available 24*7 on WhatsApp / Email
![[object Object]](/_next/static/media/star-bottom.7253800d.svg)
Unlock your academic potential
Copyright © 2020–2026 A2Z Services. All Rights Reserved. Developed and managed by ZUCOL.