Business Analysis Report: Flexible Working, Data, and Decision Making
VerifiedAdded on 2019/09/24
|18
|3708
|388
Report
AI Summary
This report undertakes a comprehensive business analysis, focusing on several key areas. Firstly, it examines the impact of flexible working hours through a survey, employing a convenience sampling technique at Bourne Leisure, and analyzing data to assess employee reactions. Secondly, the report compares primary and secondary data, detailing their concepts, models, advantages, and disadvantages within an organizational context. Thirdly, it delves into statistical concepts, including mean, mode, and standard deviation, using a five-year record example for both discrete and grouped data. Finally, the report explores decision-making theory, specifically the rational theory, presenting its model, procedure, and an organizational example related to sales volume, along with a decision matrix.
Business Analysis
Student
[Company name] [Company address]
Student
[Company name] [Company address]
Paraphrase This Document
Need a fresh take? Get an instant paraphrase of this document with our AI Paraphraser
Executive summary
In today’s world of digital communication in the business environment, business analysis plays
an important role which is mainly a practice of enabling the changes in an organization through
in-depth study and the decisions taken by the owners of the company. There are set of task and
activities which have to be performed for analyzing a performance of the company. In this
present paper, four aspects are discussed. Firstly, the survey in an organization to know the
reaction of the employees towards the introduction of flexible working hours in an organization.
The effect of flexible hours through applying different sampling techniques. The survey arises at
Bourne Leisure with the convenient sampling technique.
Secondly, the comparison of primary and secondary data on the basis of concept, models,
advantages, disadvantages, with an appropriate organizational environment. Thirdly, the concept
of mean, mode and standard deviation with an example of five years records to measure the
mean of discrete and group data, calculation of mode for both types of data: discrete and group
data, and the calculation of standard deviation of group data.
The fourth and the last topic discussed in the paper includes decision making on the basis of
decision-making theory. The rational theory is being discussed and its model, procedure with an
appropriate example of organizational decision making for the problem of not increasing in the
sales volume and the decision matrix.
1. In this question, we will conduct a survey to measure the response of flexible working hours in
an organization through conducting a survey within an organization for introducing at the work
place.
Survey is defined as the study in detailed which is conducted on a closed group. It is basically
used to examine the situation and on the basis of which conclusion has been made. There are
different kinds of surveys is being conducted to analyze the different situations. They are broadly
divided into two categories namely: surveys according to instrumentation and surveys according
to the span of time involved. The surveys according to instrumentation include the questionnaire,
interviews, etc. to know the reaction towards the particular thing and it is conducted when the
sample size is large. On the other hand, surveys according to the span of time include cross-
sectional and longitudinal surveys.
The flexible working hours may arise at Bourne Leisure as a result of negation between an
employer and employees when the time arrangement is beneficial for the employer as well as
employees. The working flexibility is mainly used to maintain the job satisfaction and quality of
life among the employees in an organization. The sample is conducting among all 11,724
employees in an organization. The working arrangement mainly describes the when, where, and
how the work gets done by the employees. It alternates the traditional "9to5" working hours.
a) The population is mainly defined as the total number of people on which surveys has been
conducted. Following are the principles on the basis of which effective workplace practices has
been conducting:
⊘ This is a preview!⊘
Do you want full access?
Subscribe today to unlock all pages.
Trusted by 1+ million students worldwide
I. The arrangement of working schedule should meet the goals and objectives of the
organization as well as departments goals. It includes the overtime cost, problems related
to safety and security.
II. It should support the working style and history of employees.
III. The task related to the job must be adaptable for flexible arrangements.
IV. A written proposal and agreement should be made for the acceptance of working in a
flexible shifts arrangements.
b) Sampling techniques: The Convenient sampling technique is used to conduct a survey. It is
mainly defined as the technique which is a non-probabilistic technique of sampling. It is mainly
done according to the convenience of the surveyor. In convenience sampling the data which is
closely available and easily reachable that will be taken. It is also known by different names such
as Accidental sampling, grab sampling, available and opportunity sampling.
The non-probability theory of sampling is used in this survey. In the probabilistic theory of
sample, the probability of getting any particular thing is calculated, but the now- probability
theory of sampling does not support this characteristic. It does not include the sample from a
general population. The non-probabilistic theory is based on "theoretical saturation" and the
generalization on the analytical basis. It does not support statistical generalization. This
technique mainly supports in-depth research which is mainly useful for analyzing the complex
social occurrences.
The concept of convenience sampling, according to the Mangal, (2002) lies in estimating the
population parameters from sample statistics. The concept of convenience sampling is mainly is
mainly used to analyze the situations on the basis of the available data which is available easily.
The concept of taking convenient sampling is mainly the effect of flexible working hours in an
Paraphrase This Document
Need a fresh take? Get an instant paraphrase of this document with our AI Paraphraser
organization. According to the survey, the reports of working hours and the absentees report both
are supervised and analyzed of approximately 110 employees on the basis of which the reaction
would be judged. The total numbers of absentees with respect to flexible working hours before
and after would be judged and analyze to know the reaction of employees. If the average rate of
absentees is decreased with the concept of flexible working hours and employees are meeting
their departmental and organizational goals and objectives then the survey is successful in
determining the reaction, and it should be implemented.
Super population Models is mainly used to conduct the sample of convenience. The convenience
sampling is mainly conducted to analyze the random samples which are easily available from the
large population. The assumption which is not supported is known as super-population model.
The assumptions have consequences, and it has been made after all the considerations. A sample
error is best viewed as de minimis error estimate. The sampling error is defined as the
uncertainty in the events. One of the examples of the convenient sample is using student
volunteers.
2. The methods of collecting data are mainly done is mainly done through two methods which
are broadly through primary data and secondary data. The data collection is used to analyze,
measure, evaluate, compare and discuss the outputs for which collection of data is being done.
Primary data is defined as the data which is collected through surveys, personal interviews,
questionnaire, with the particular objective of performing a task. It is a direct approach to
collecting the data. It is also known as firsthand information because it is the information which
is taken directly by the person who is doing the research or a survey.
Advantages of primary data
Following are the advantages of primary data:
I. Addressing of targeted issues and the data is original and relevant to the particular study
which increases the degree of accuracy.
II. Better data interpretation because the data is realistic in nature.
III. Spending of information in an efficient manner
IV. Affability in data because the data collected from the national as well as international
boundaries through emails and posts.
V. Efficient and effective Control
Disadvantages of primary data
Following are the disadvantages of primary data:
I. Issues related to proprietorship and the importance of research also goes down with the
increase in people, time, and efforts.
II. Addressing of specific issues related to research. It includes problems such as designing
of surveys.
III. The data collection is Costly because if interviews are conducted in more than limited
coverage, then more researchers are required.
IV. Imprecise feedbacks because some respondents give fake feedback.
V. Time-consuming and efforts required for collecting the data and analyzed the data within
a particular time frame with defeating the purpose of a research.
Secondary data is defined as the data which is taken from another source like journals, the
internet, books, and previous publications. It is the data which is already available, and work has
⊘ This is a preview!⊘
Do you want full access?
Subscribe today to unlock all pages.
Trusted by 1+ million students worldwide
already done on this particular topic. The secondary is used to make conclusions, analysis, and
comparison on the basis of available information.
Advantages of secondary data
Following are the advantages of secondary data:
I. It provides access to world's best scholars.
II. The primary advantage is that it is low in cost and fast to access.
III. Easily explain research question and it provides a research framework which helps the
research to easily do research on the particular topic.
IV. Answer research questions easily.
Disadvantages of secondary data
I. It is a Qualitative research
II. No need of researchers specification
III. Inaccurate information because relying on the collection by the third party is not
acceptable in the research.
IV. It also raises the issues related to authentication and copyright.
Comparison of primary and secondary data:
I. Concept: The concept of primary data is defined as the data which is the firsthand
information. It is the concept of collecting original information through conduction
research by taking various personal interview, filling questionnaire by respondents,
conducting survey by an investigator, whereas the concept of secondary research is
opposite of primary research because in secondary research the data is already available
Paraphrase This Document
Need a fresh take? Get an instant paraphrase of this document with our AI Paraphraser
and the information taken by the investigator is second-hand information from the
previous research. The secondary data is collected through internet, newspaper, journals,
and magazines.
II. Models: The model of primary data includes broadly two segments: qualitative data and
quantitative data. In quantitative data further two segments are included: surveys and
experiments and in quantitative data the methods include focus groups, case studies,
observation whereas in secondary data the resources are broadly two: internal and
external resources. The external sources include magazines, books, journals, the internet
and internal source includes company’s sales record, cost information report, customer
feedback.
III. Relevant theories: The relevant theory related to the primary is tentative theory, and
secondary data is classic grounded theory.
IV. Methods of collecting data: The primary data can be collected through personal
interviews, surveys, experiments by the person who is conducting a data collection
whereas the secondary data is already available data which is done by another person
previously.
V. Example: The information collected by the student for preparing a research proposal is a
primary data, and the information which is used to analyze the death ratio through census
statistics is a secondary data.
3.
Mean
The mean is defined as the statistics, which is used to calculate the central tendency for
probabilistic distribution and random variable. It is also known as the measure of central
tendency. The formula for calculating the mean is the sum of observation divided by the
number of observations. There are two types of variable: Discrete variable and
continuous variable. The discrete variable is defined as the variable which cannot be
divided internally whereas continues variable is the variable which can be distributed into
small units.
There are four types of the mean: Arithmetic mean, Geometric mean and harmonic mean,
weighted mean.
The arithmetic mean is defined as the mean which is calculated by the simplest way of
calculating the sum of observations divided by a number of observations. The harmonic
mean is defined as the mean which is the reciprocal of arithmetic mean, and the
geometric mean is an appropriate measure when there is a change in the value. It is the
value of arithmetic mean which is taken on a log scale. The weighted mean is used to
calculate the value when the wi is given with xi.
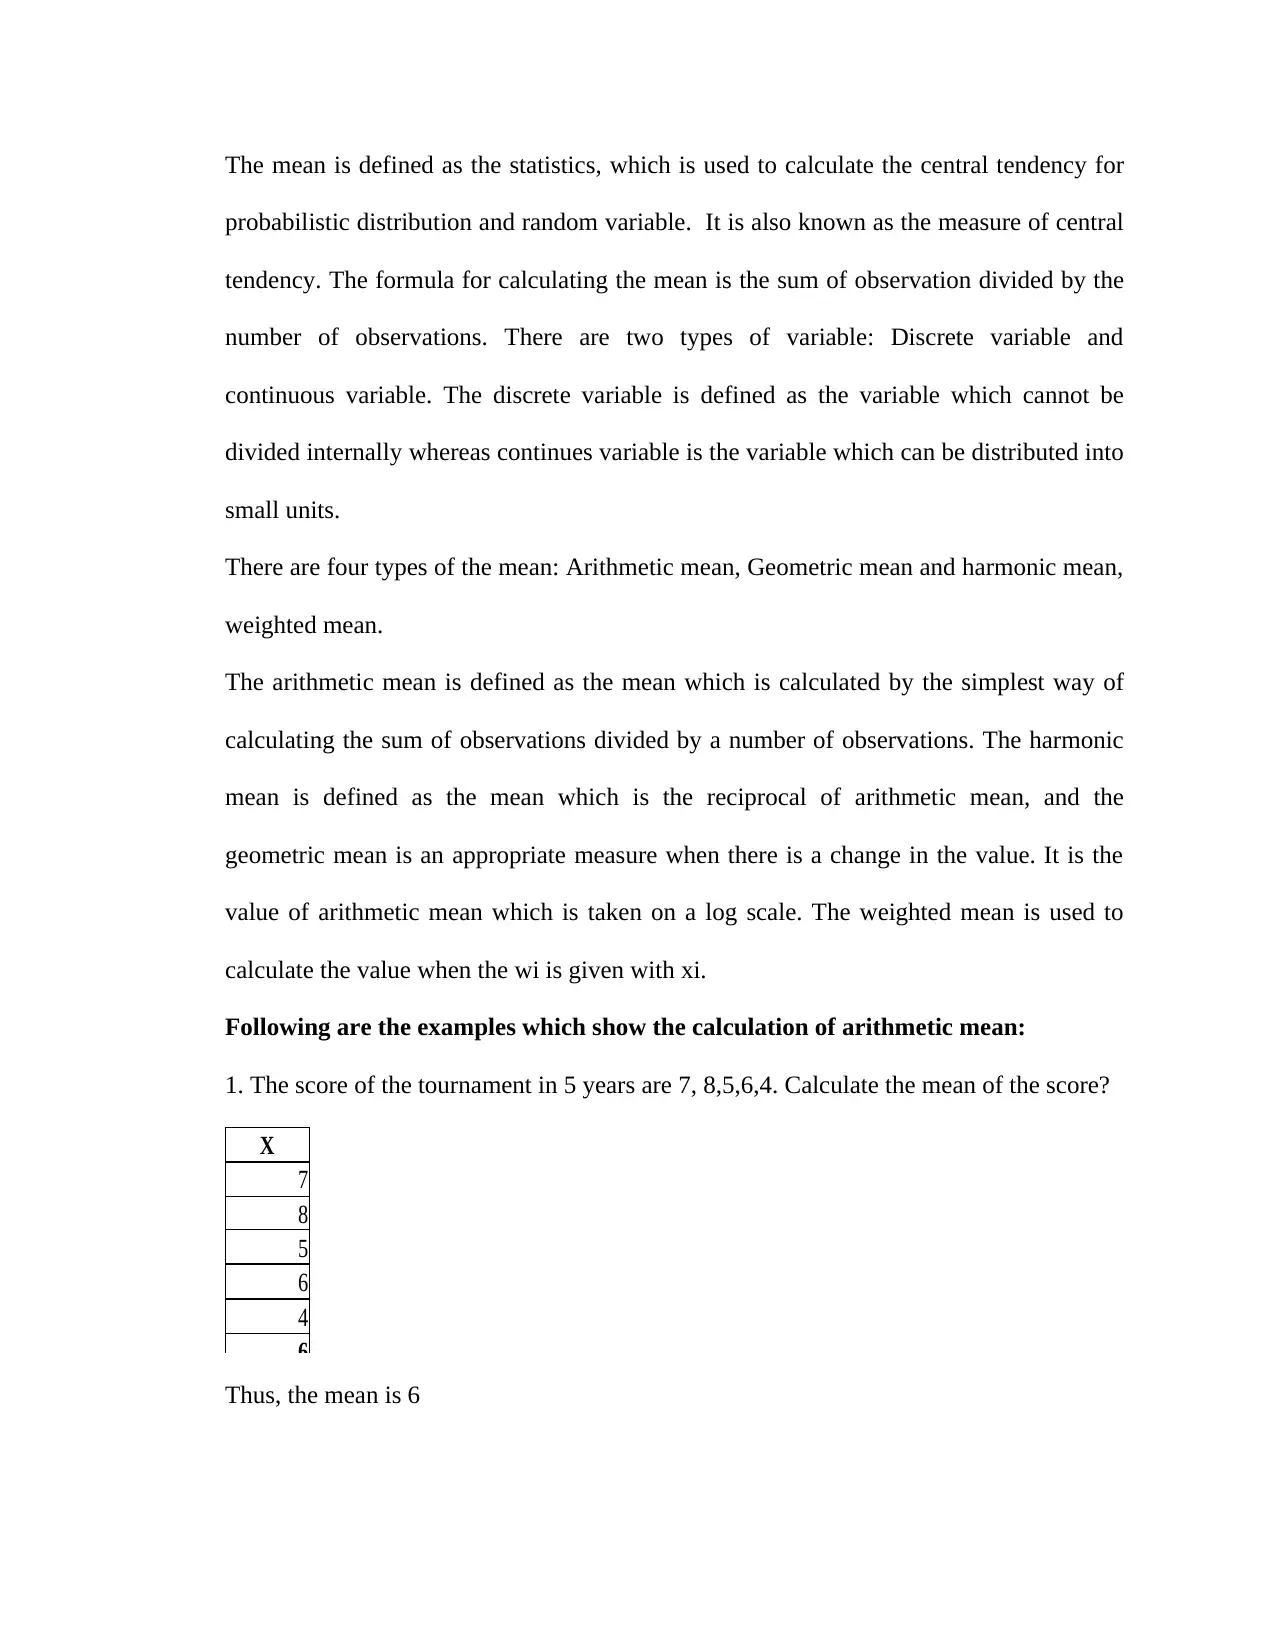
Following are the examples which show the calculation of arithmetic mean:
1. The score of the tournament in 5 years are 7, 8,5,6,4. Calculate the mean of the score?
X
7
8
5
6
4
6
Thus, the mean is 6
probabilistic distribution and random variable. It is also known as the measure of central
tendency. The formula for calculating the mean is the sum of observation divided by the
number of observations. There are two types of variable: Discrete variable and
continuous variable. The discrete variable is defined as the variable which cannot be
divided internally whereas continues variable is the variable which can be distributed into
small units.
There are four types of the mean: Arithmetic mean, Geometric mean and harmonic mean,
weighted mean.
The arithmetic mean is defined as the mean which is calculated by the simplest way of
calculating the sum of observations divided by a number of observations. The harmonic
mean is defined as the mean which is the reciprocal of arithmetic mean, and the
geometric mean is an appropriate measure when there is a change in the value. It is the
value of arithmetic mean which is taken on a log scale. The weighted mean is used to
calculate the value when the wi is given with xi.
Following are the examples which show the calculation of arithmetic mean:
1. The score of the tournament in 5 years are 7, 8,5,6,4. Calculate the mean of the score?
X
7
8
5
6
4
6
Thus, the mean is 6
⊘ This is a preview!⊘
Do you want full access?
Subscribe today to unlock all pages.
Trusted by 1+ million students worldwide
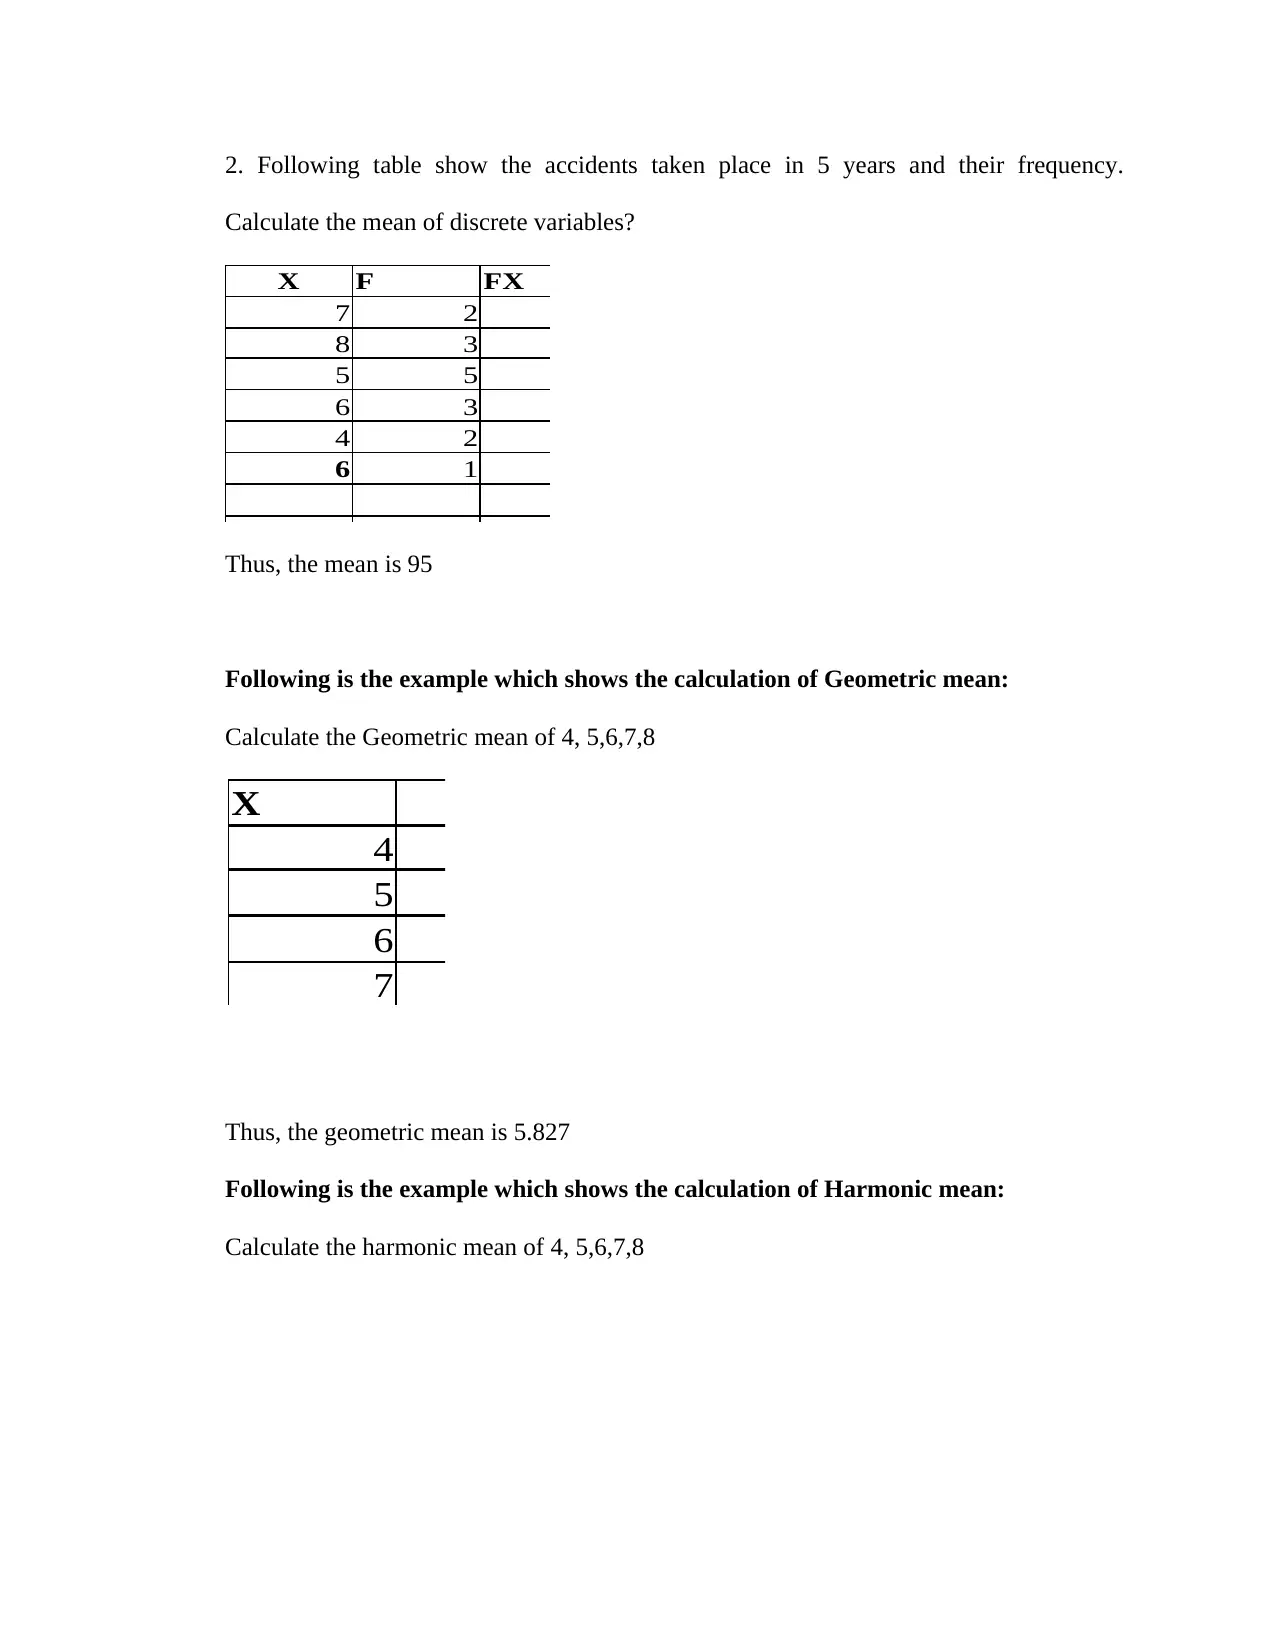
2. Following table show the accidents taken place in 5 years and their frequency.
Calculate the mean of discrete variables?
X F FX
7 2 14
8 3 24
5 5 25
6 3 18
4 2 8
6 1 6
95
Thus, the mean is 95
Following is the example which shows the calculation of Geometric mean:
Calculate the Geometric mean of 4, 5,6,7,8
Thus, the geometric mean is 5.827
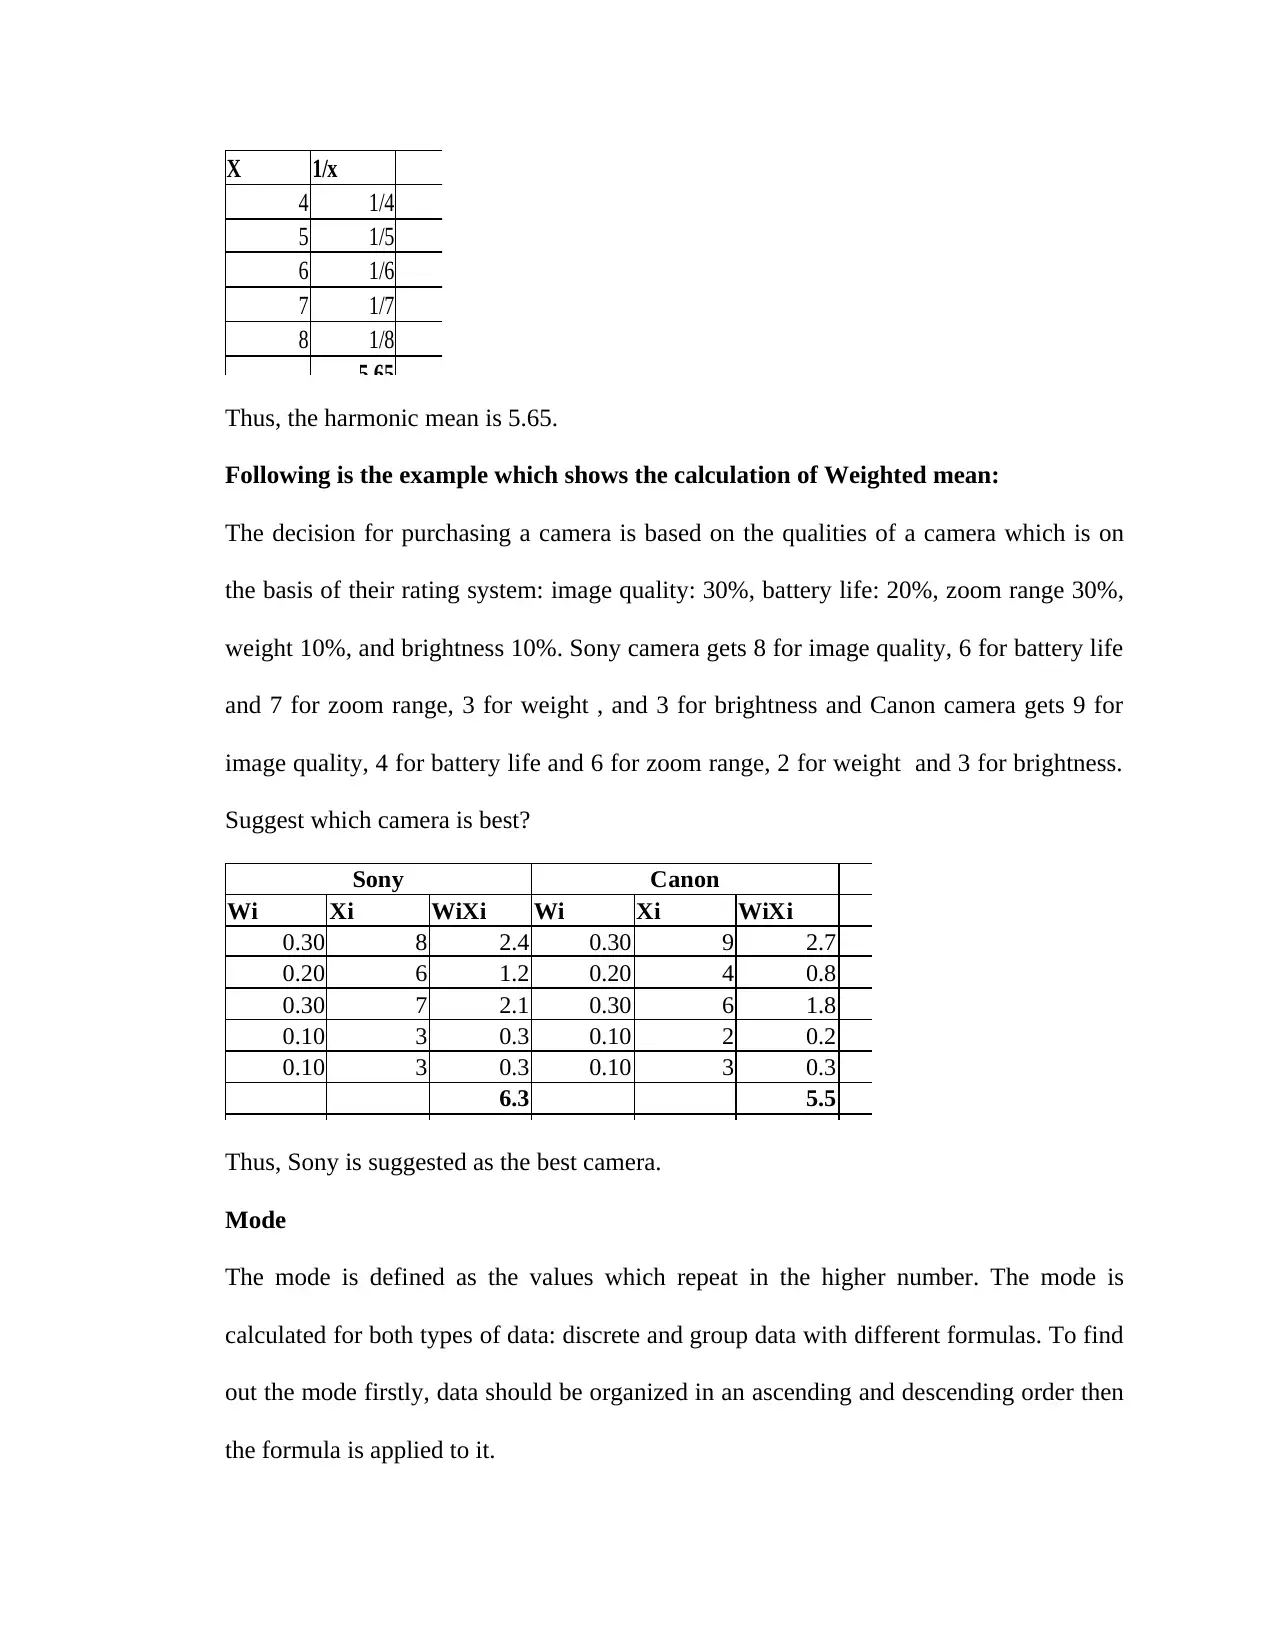
Following is the example which shows the calculation of Harmonic mean:
Calculate the harmonic mean of 4, 5,6,7,8
X
4
5
6
7
Calculate the mean of discrete variables?
X F FX
7 2 14
8 3 24
5 5 25
6 3 18
4 2 8
6 1 6
95
Thus, the mean is 95
Following is the example which shows the calculation of Geometric mean:
Calculate the Geometric mean of 4, 5,6,7,8
Thus, the geometric mean is 5.827
Following is the example which shows the calculation of Harmonic mean:
Calculate the harmonic mean of 4, 5,6,7,8
X
4
5
6
7
Paraphrase This Document
Need a fresh take? Get an instant paraphrase of this document with our AI Paraphraser
X 1/x
4 1/4
5 1/5
6 1/6
7 1/7
8 1/8
5.65
Thus, the harmonic mean is 5.65.
Following is the example which shows the calculation of Weighted mean:
The decision for purchasing a camera is based on the qualities of a camera which is on
the basis of their rating system: image quality: 30%, battery life: 20%, zoom range 30%,
weight 10%, and brightness 10%. Sony camera gets 8 for image quality, 6 for battery life
and 7 for zoom range, 3 for weight , and 3 for brightness and Canon camera gets 9 for
image quality, 4 for battery life and 6 for zoom range, 2 for weight and 3 for brightness.
Suggest which camera is best?
Sony Canon
Wi Xi WiXi Wi Xi WiXi
0.30 8 2.4 0.30 9 2.7
0.20 6 1.2 0.20 4 0.8
0.30 7 2.1 0.30 6 1.8
0.10 3 0.3 0.10 2 0.2
0.10 3 0.3 0.10 3 0.3
6.3 5.5
Thus, Sony is suggested as the best camera.
Mode
The mode is defined as the values which repeat in the higher number. The mode is
calculated for both types of data: discrete and group data with different formulas. To find
out the mode firstly, data should be organized in an ascending and descending order then
the formula is applied to it.
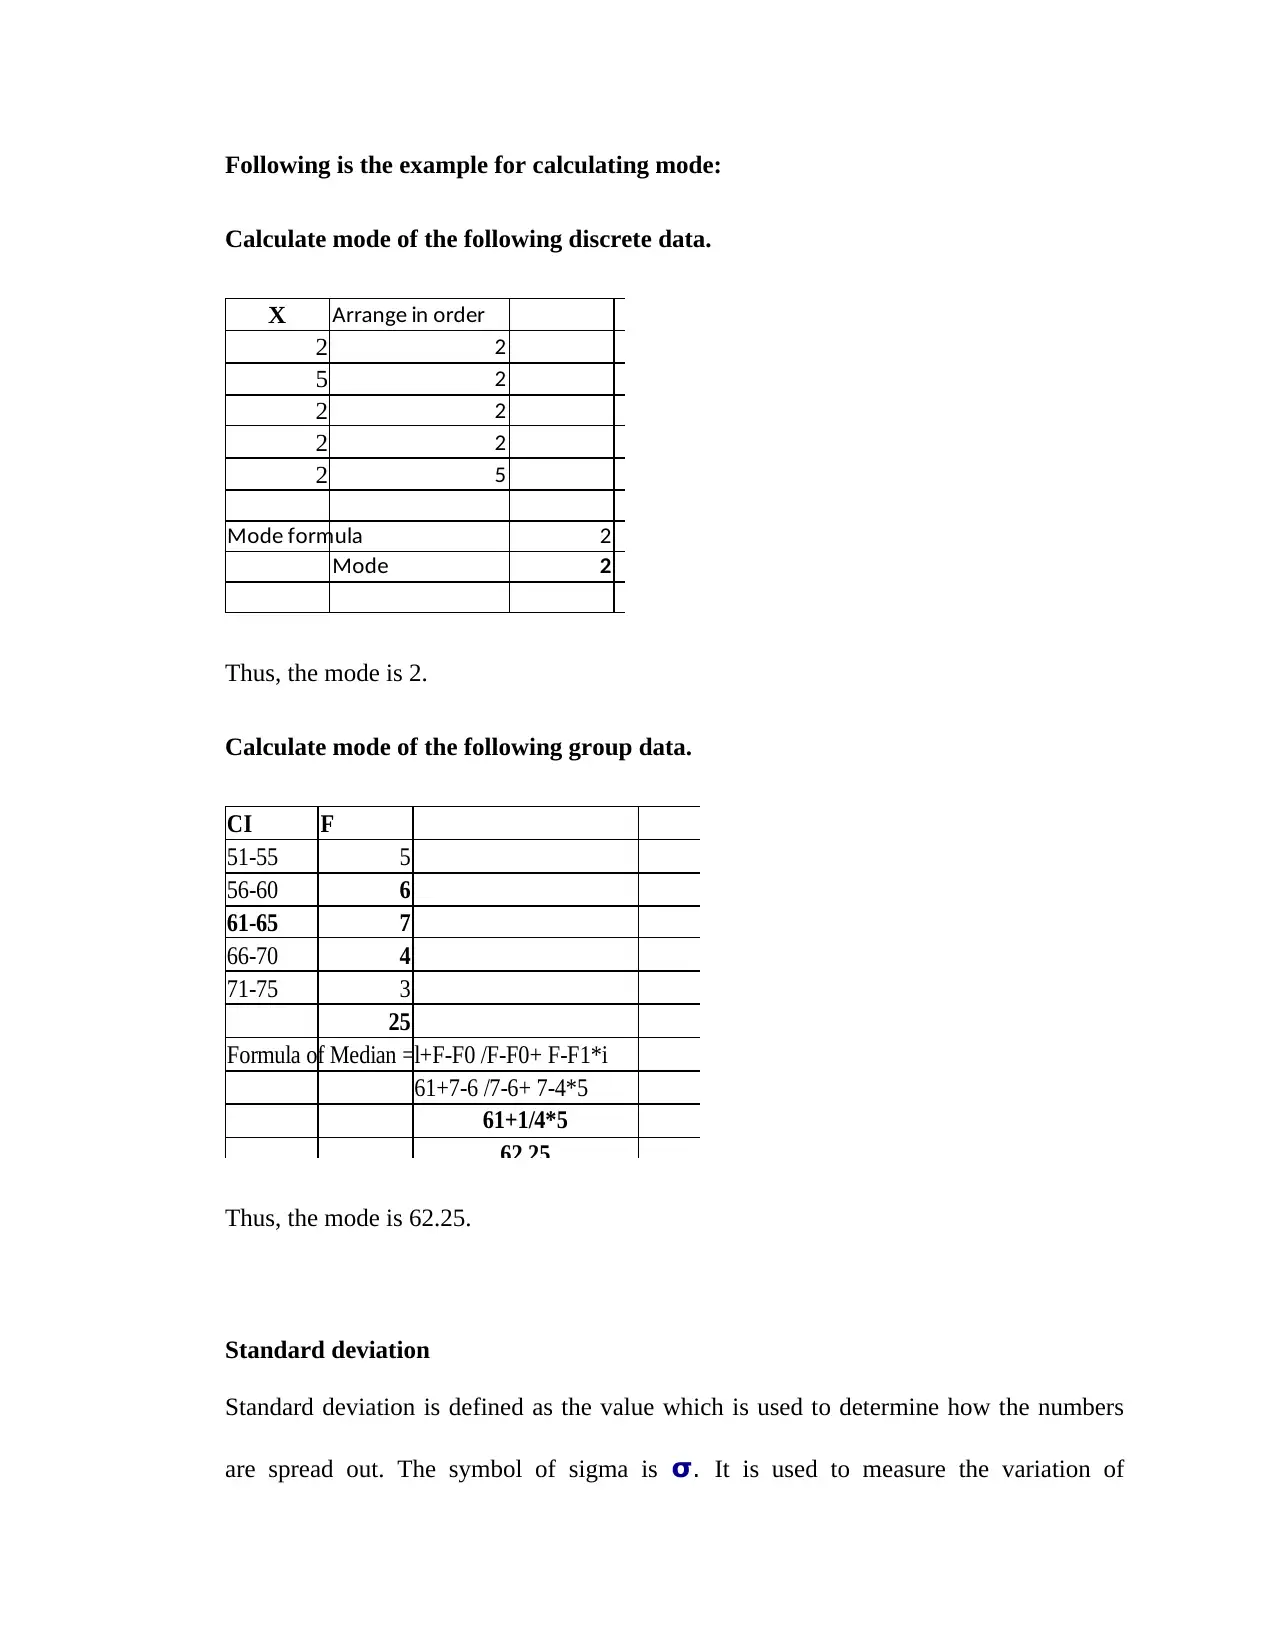
Following is the example for calculating mode:
Calculate mode of the following discrete data.
X Arrange in order
2 2
5 2
2 2
2 2
2 5
Mode formula 2
Mode 2
Thus, the mode is 2.
Calculate mode of the following group data.
CI F
51-55 5
56-60 6
61-65 7
66-70 4
71-75 3
25
Formula of Median =l+F-F0 /F-F0+ F-F1*i
61+7-6 /7-6+ 7-4*5
61+1/4*5
62.25
Thus, the mode is 62.25.
Standard deviation
Standard deviation is defined as the value which is used to determine how the numbers
are spread out. The symbol of sigma is σ. It is used to measure the variation of
⊘ This is a preview!⊘
Do you want full access?
Subscribe today to unlock all pages.
Trusted by 1+ million students worldwide
1 out of 18
Related Documents


Your All-in-One AI-Powered Toolkit for Academic Success.
+13062052269
info@desklib.com
Available 24*7 on WhatsApp / Email
![[object Object]](/_next/static/media/star-bottom.7253800d.svg)
Unlock your academic potential
Copyright © 2020–2026 A2Z Services. All Rights Reserved. Developed and managed by ZUCOL.