Business Decision Making Report: Data Analysis, Planning and Strategy
VerifiedAdded on 2020/02/12
|19
|4705
|387
Report
AI Summary
This report provides a detailed analysis of business decision-making processes, encompassing various aspects such as data collection, survey methodologies, and questionnaire design. It delves into the creation of a comprehensive business plan, including primary and secondary market research techniques, and explores the use of qualitative and quantitative research methods. The report covers data collection steps, ensuring repeatability, reproducibility, accuracy, and stability. Furthermore, it examines survey methodologies, sampling frames, and the design of effective questionnaires. The report also includes data analysis, measures of dispersion, and the utilization of quartiles, percentiles, and correlation coefficients to aid decision-making. Additionally, it addresses the creation of graphs and charts, trend line analysis, project plan preparation, critical path analysis, and the application of financial tools for decision-making. The report concludes with a summary of findings and recommendations.

BUSINESS DECISION
MAKING
MAKING
Paraphrase This Document
Need a fresh take? Get an instant paraphrase of this document with our AI Paraphraser
Table of Contents
INTRODUCTION...........................................................................................................................3
TASK.1............................................................................................................................................3
1.1Create a plan:.....................................................................................................................3
1.2 Survey methodology and sampling frame:.......................................................................7
1.3 Design a questionnaire:....................................................................................................8
TASK.2............................................................................................................................................9
2.1 Make information by summarising the raw data .............................................................9
2.2 Analyse the range of results:..........................................................................................10
2.3 Measures of dispersion...................................................................................................10
2.4 Determine how quartiles, percentile and correlation coefficient is utilised to assist the
decision making:...................................................................................................................10
Quartiles...............................................................................................................................10
TASK 3..........................................................................................................................................11
3.1 produce graphs and charts:.............................................................................................11
3.2 Trend line for the business:............................................................................................12
3.3 COVERED IN PPT:.......................................................................................................13
3.4 Formal report:.................................................................................................................13
TASK 4 .........................................................................................................................................15
4.1 Use appropriate information processing tools & Preparation of project plan and
determination of critical path:..............................................................................................15
4.2 Critical path analysis......................................................................................................15
..............................................................................................................................................16
4.3 Use financial tools for decision making.........................................................................17
CONCLUSION:.............................................................................................................................18
REFERENCES..............................................................................................................................19
INTRODUCTION
In this era, it is more important task to have effective decision making in the organisation. Now,
there are so many management tools through which firm could make the efficient business
decisions in order to attain the firm's long term goals and objectives, this will also assist the firm
to attain the competitive advantages over the competitors. For efficient and effective decision
making, there is a need to have the data. The data could be of primary and secondary, and this is
dependent on the importance of the information. If the information is highly important, then
there is need to have the primary data so that the firm could make an effective decisions. But, if
in case, company needs to make strategy which is not crucial fro the firm, then it need to make
their decisions as per the secondary data(Tzeng and Huang, 2011)).
TASK.1
1.1Create a plan:
For any business decision making we have to design a unique plan that will identify the
future of the company. The primary part of the idea of statistical surveying is to give an
organization or a business association with an inside and out perspective of the clients or buyers
so that the firm could effectively fulfil the needs of consumers in a better way. The procedure of
statistical surveying is necessary to have the capacity to compete with different players in a
similar industry and support to assess things like market size, rivalry and market needs.
There are various techniques which can help to create good plan for the business that will
modify the research process a definite shape and it will identify its various resources that should
be focused to achieved their objectives. In such a situation, organizations can't simply depend on
their gut feelings to run things, and this is the reason statistical surveying is required.
However, there are basically four market surveying techniques i.e. Primary, Secondary Market
Research, qualitative and quantitative research. These have been defined in details:
Primary market research. This research survey is a sort of statistical surveying which is
finished by the business or organization itself with the target of social event data which could
further be utilized to enhance the items, administrations, and capacities. Primary market
surveying is otherwise called field research as this is the research done from scratch, without
utilizing any data that is as of now made accessible through different sources. One can
accumulate essential information or data through qualitative research techniques and also
⊘ This is a preview!⊘
Do you want full access?
Subscribe today to unlock all pages.
Trusted by 1+ million students worldwide
quantitative research tools. Primary market research survey is the most well-known kind of a
statistical surveying methods and is additionally the most important type. It is a technique which
answer all the specific issues through which firm Can get the specific information fro the
strategies.
Secondary market research: Instead of primary market method, secondary surveying is
an exploration procedure that does not plan to accumulate data by doing the primary research but
rather depends on officially accessible data from various sources. Secondary research
methodology concentrates on information or data that was gathered by other individuals and is
accessible for either free or paid use for others(Tzeng and Huang, 2011). This surveying
considers various hotspots for accumulation of data including government information, office
information, daily papers, magazines, the web, and so on. This is one of the best methods to
collect the information in less time and then implement them for better decision making in the
firm.
Qualitative research: Qualitative statistical surveying is a sort of an examination
technique which for the most part considers the sentiments of a client to the extent a business'
items and administrations are concerned. This kind of research assist the organisation to know
the client perception about the client perception.
Quantitative research: This research is done on the basis of the numerical data and
simultaneously research over them to draw a valid conclusions. Quantitative statistical survey is
a sort of statistical surveying work that depends on certain actualities and statistical data instead
of the emotions of the clients or purchasers(Shouzhen and et. al., 2014.). This kind of research
can demonstrate helpful both as far as primary statistical surveying and secondary market
research. A portion of the regular cases of quantitative research incorporate exit reviews, polls,
field survey on work and the shopping bag overview. Truth be told, another case of quantitative
research incorporates inquiring about of the already existing money related reports, explore
papers. This sort of research turns out with an extensive variety of measurements and discovers
the extent of the market.
There are so many stages which are necessary for collection of data. Some of them are
ment5ioned below:
Pre-Data Collection Steps
1. Characterize the objectives and targets of the information gathering
Paraphrase This Document
Need a fresh take? Get an instant paraphrase of this document with our AI Paraphraser
2. Achieve understanding and concession to operational definitions and procedure for the
information gathering plan.
3. Guarantee information gathering (and estimation) repeatability, reproducibility, exactness
and steadiness
During Collection Steps:
4. adopt through with the data collection process
Post-Data Collection Steps :
5. Finish the outcomes
Step 1: Define Goals And Objectives
A decent information gathering process ought to include:
A short description of the venture
The particular information that is required
The method of reasoning for gathering the information
What understanding the information may give and how it will help the change group
What will be finished with the information once it has been gathered
Being sure about these components will encourage the precise and proficient accumulation of
information.
Step 2: Define Operational Definitions and Methodology
The quality assurance team ought to plainly characterize what information is to be
gathered and how. It ought to choose what is to be assessed and decide how a numerical esteem
will be allotted, in order to encourage estimation(Shepherd, 2011). The quality assurance team
ought to consider counselling with the client to check whether they are as of now gathering the
same information. Assuming this is the case, examinations can be made and best practices
shared. The group ought to likewise detail the extent of the information accumulation:
What number of perceptions are required
What time interim ought to be a piece of the review
Regardless of whether past, present, and future information will be gathered
The techniques that will be utilized to record every one of the information
It is best to get finish comprehension of and concurrence on all the material definitions,
techniques and rules that will be utilized as a part of the gathering of information(Provis, 2010).
Neglecting this progression can yield deluding comes about if individuals from the change group
are deciphering approximately characterized terms contrastingly when gathering information.
Significant issues can emerge for the association when business choices are made in view of this
conceivably problematic information.
In the event that the group wishes to look at chronicled information to incorporate as a
major aspect of the review, watchful consideration ought to be paid to how solid the information
and its source has been, and whether it is prudent to keep utilizing such information. Information
that ends up being suspect ought to be disposed of.
Step 3: Ensuring Repeatability, Reproducibility, Accuracy and Stability
The information being gathered will be repeatable if a similar administrator can reach
basically a similar result numerous circumstances on one specific thing with a similar
gear(Nielsen and Nielsen, 2011). The information will be reproducible if every one of the
administrators who are measuring similar things with a similar hardware are coming to basically
similar results. Likewise, how much the estimation framework is precise will for the most part be
the distinction between a watched normal estimation and the related known standard esteem.
How much the estimation framework is steady is by and large communicated by the variety
coming about because of a similar administrator measuring a similar thing, with a similar
hardware, over an amplified period.
Step 4: The Data Collection Process
Data collection is the techniques of collecting and measuring information on uncertainty
of interest,in establishing by designing systematically answer the research questions and after
that hypotheses testing and evaluation of final outcome or lastly the result review. The data is
said to be qualitative if it is categorised in word form ,may also include information that is based
on numerically and images form. Common techniques are observations face to face interviews
and case studies.
Step 5: After The Data Collection Process
To maintain the creditability and reliability of data ,information should be collected by
using appropriate data collecting tools and techniques. There are various steps which can be
followed after collection of data :
⊘ This is a preview!⊘
Do you want full access?
Subscribe today to unlock all pages.
Trusted by 1+ million students worldwide
Step1 : In the initial stage identified issues and opportunities for collecting the data.
Step2 : Form the group of issues select one of them and set a definite goals regarding it
achievement.
Step3 ; various plans and methods of research tools can be introduce to correct the right
way of research data.
Step4 : collected data must be analysed properly.
Step5 : evaluation and review techniques .
1.2 Survey methodology and sampling frame:
Research methodology are useful before collecting any data or information which is
directly collect from an individual. It also can collect with the help of interviews, questionnaire
or surveys. The data is up to date because it is collected by company recently. It is research
which is done originally so that it is more expensive and time consuming. Secondary data is the
data which is collected by other people and company use that for fulfil their purpose(Maxwell,
Jeffrey and Lévesque, 2011). It can be get from any sites, newspaper etc.
Survey methodology : It is a method which can used by the company to collect relevant
data for the company. There are many techniques in survey method which can used by company
for data collection such as questionnaire, interviews. It helps to get the data from people that can
be accurate. Survey also can used for collection of data.
In a simple terms, Survey means to collection of information.
Random sample framing is the easiest method to collect the data which is used by
Thomas cook. In this method they collect random people from the population and create some
sample to get feedback from them. In this collection of people is random so that there is less
biasses. Results of the random sampling framing is in the samples so that it is easy to evaluate
the results.
There are various methods available to collect information but they may be biased and
there is no guarantee that people are unknown. So it is better to use this method to collect the
information. This method provides all the necessary information to the company so that company
can fulfil their goals and objectives(Hwang and Yoon, 2012). The data can be qualitative and
quantitative also. They both are very important for the company.
1.3 Design a questionnaire:
About Tours and travels
Paraphrase This Document
Need a fresh take? Get an instant paraphrase of this document with our AI Paraphraser
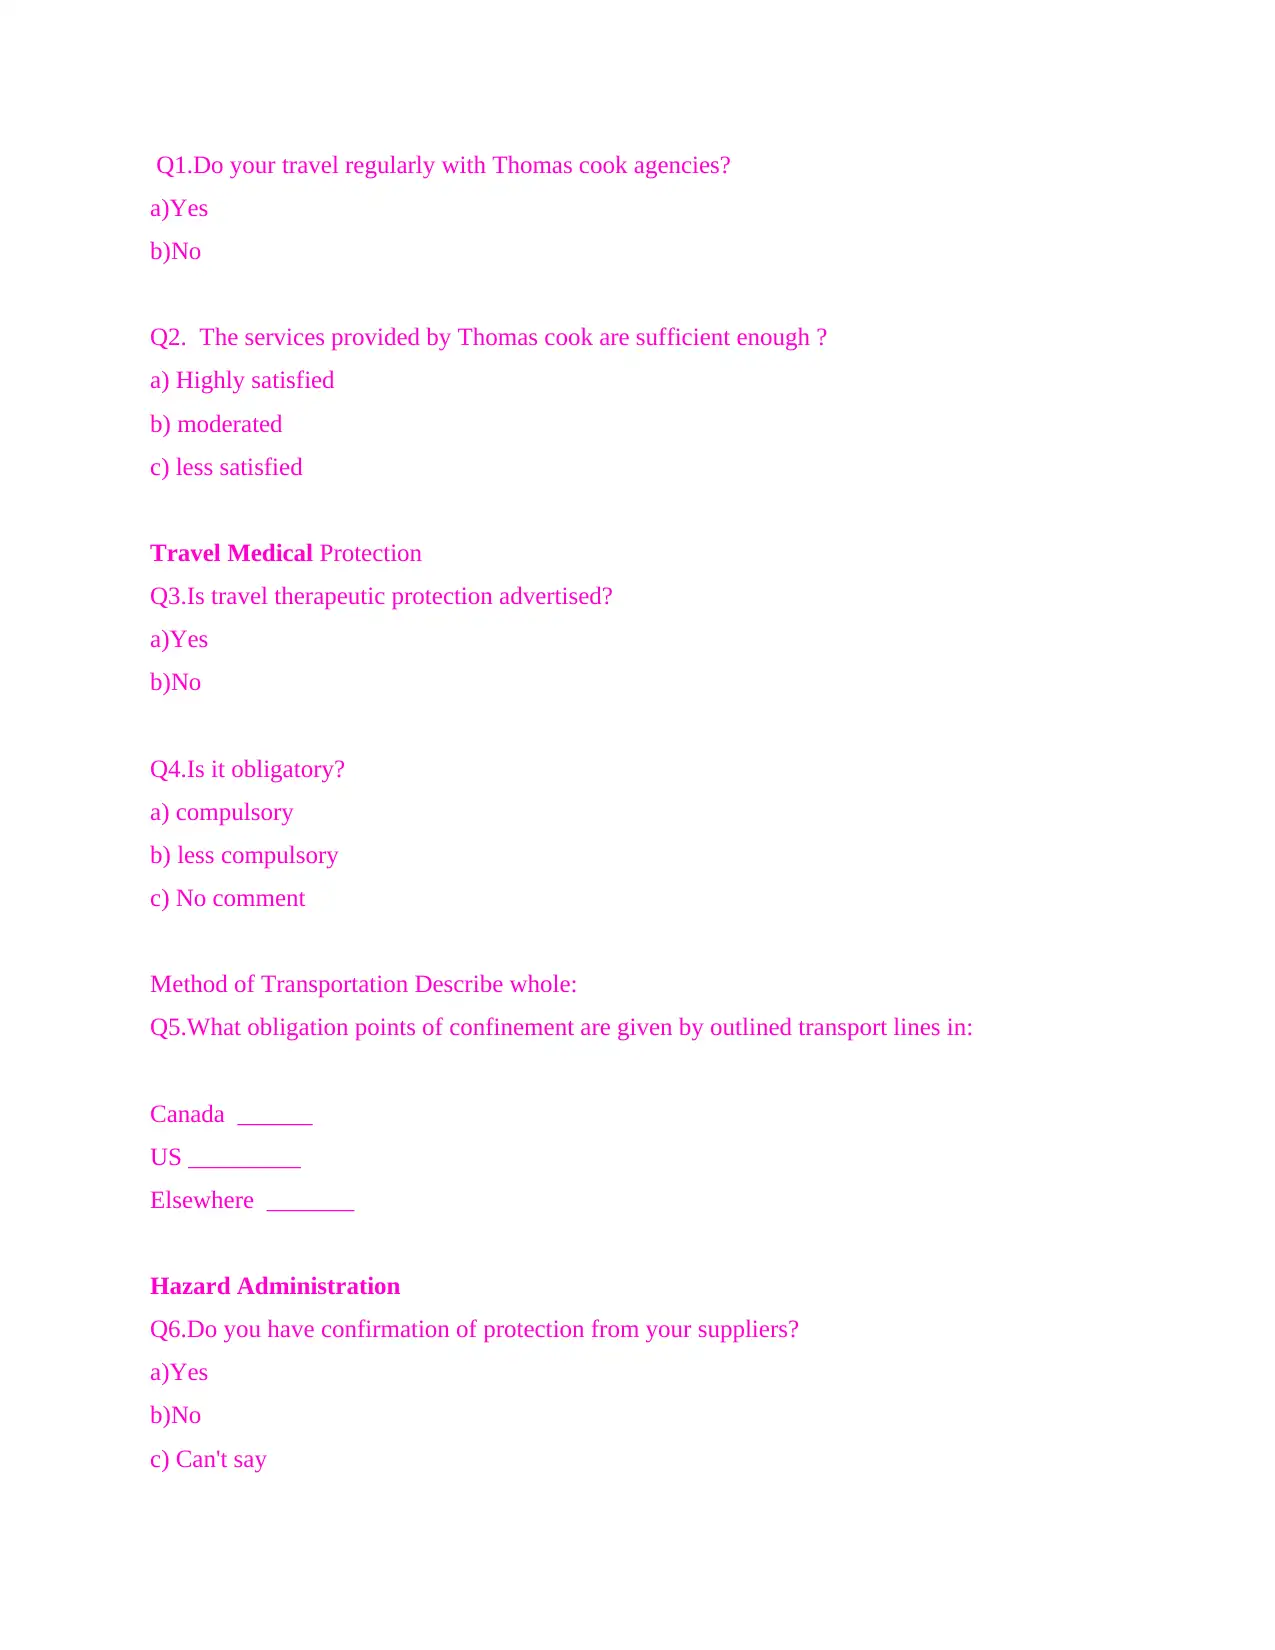
Q1.Do your travel regularly with Thomas cook agencies?
a)Yes
b)No
Q2. The services provided by Thomas cook are sufficient enough ?
a) Highly satisfied
b) moderated
c) less satisfied
Travel Medical Protection
Q3.Is travel therapeutic protection advertised?
a)Yes
b)No
Q4.Is it obligatory?
a) compulsory
b) less compulsory
c) No comment
Method of Transportation Describe whole:
Q5.What obligation points of confinement are given by outlined transport lines in:
Canada ______
US _________
Elsewhere _______
Hazard Administration
Q6.Do you have confirmation of protection from your suppliers?
a)Yes
b)No
c) Can't say
a)Yes
b)No
Q2. The services provided by Thomas cook are sufficient enough ?
a) Highly satisfied
b) moderated
c) less satisfied
Travel Medical Protection
Q3.Is travel therapeutic protection advertised?
a)Yes
b)No
Q4.Is it obligatory?
a) compulsory
b) less compulsory
c) No comment
Method of Transportation Describe whole:
Q5.What obligation points of confinement are given by outlined transport lines in:
Canada ______
US _________
Elsewhere _______
Hazard Administration
Q6.Do you have confirmation of protection from your suppliers?
a)Yes
b)No
c) Can't say
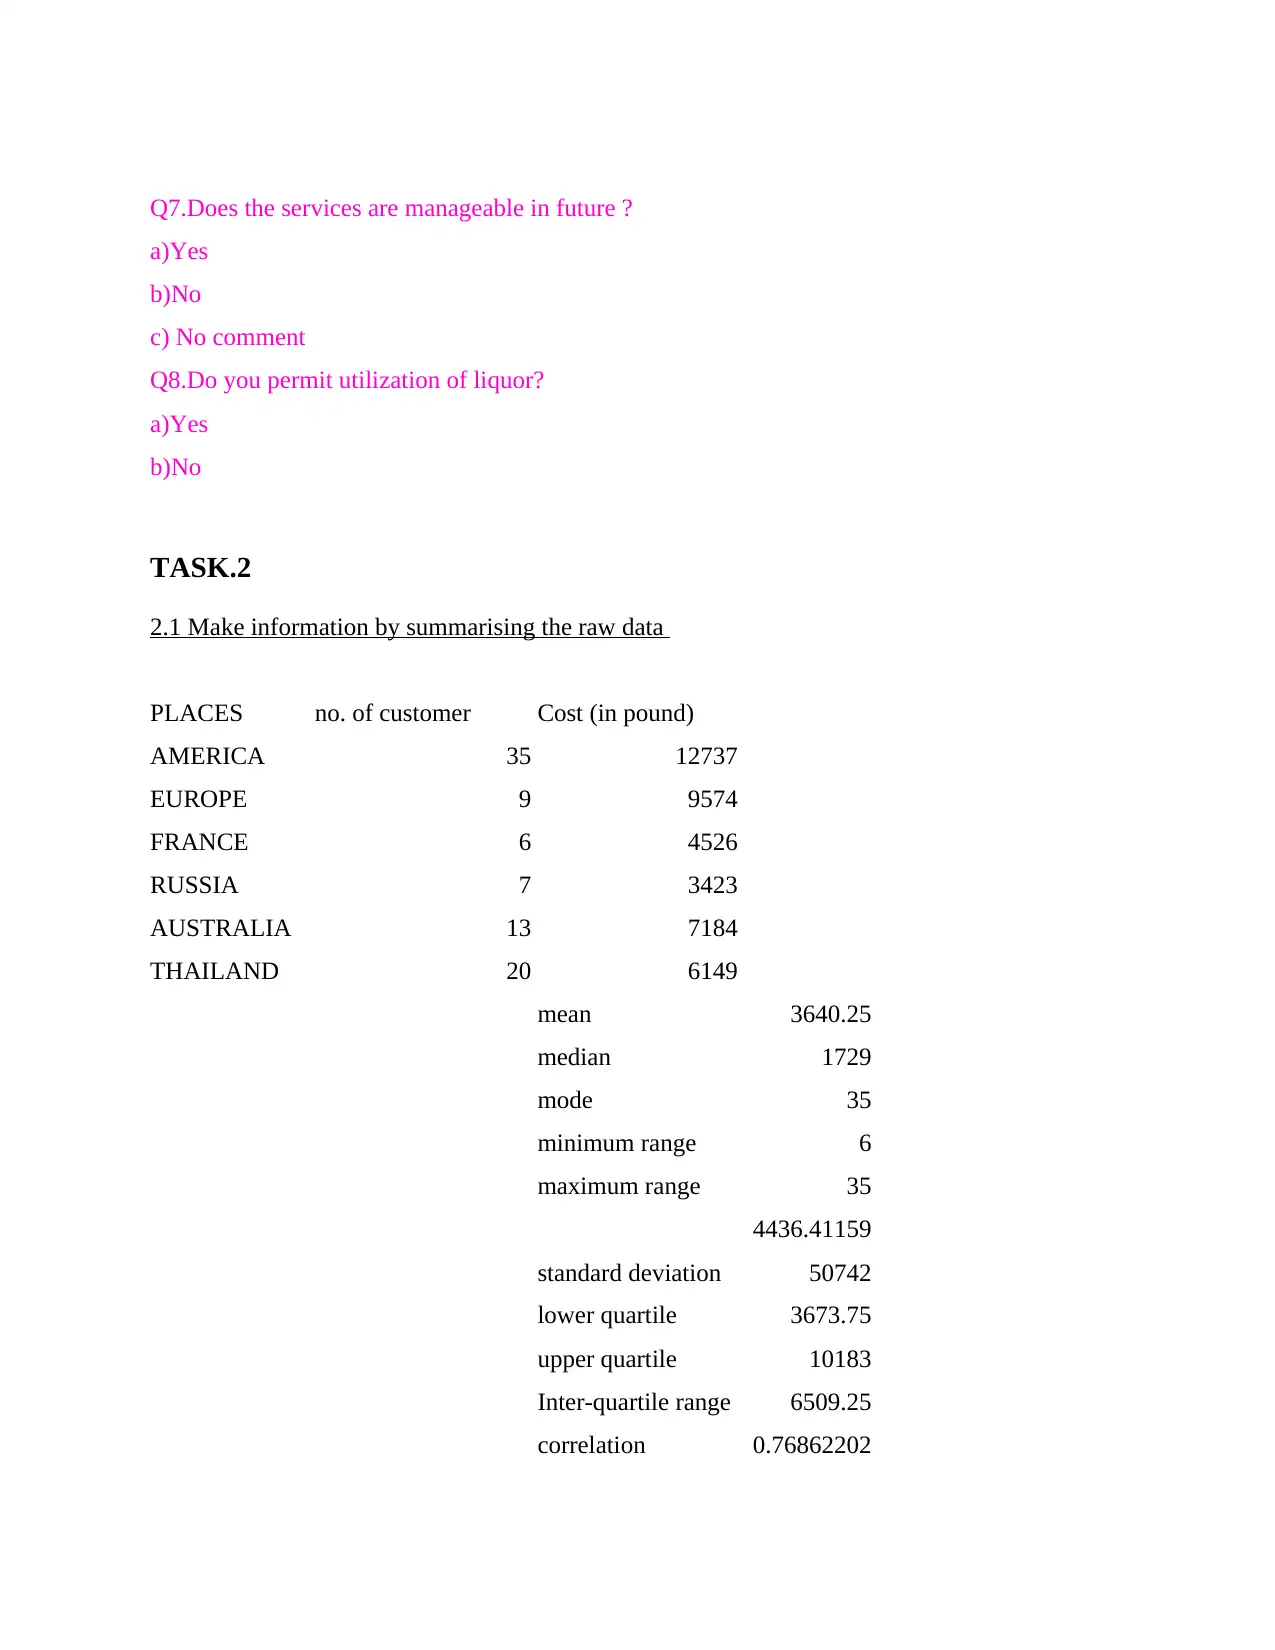
Q7.Does the services are manageable in future ?
a)Yes
b)No
c) No comment
Q8.Do you permit utilization of liquor?
a)Yes
b)No
TASK.2
2.1 Make information by summarising the raw data
PLACES no. of customer Cost (in pound)
AMERICA 35 12737
EUROPE 9 9574
FRANCE 6 4526
RUSSIA 7 3423
AUSTRALIA 13 7184
THAILAND 20 6149
mean 3640.25
median 1729
mode 35
minimum range 6
maximum range 35
standard deviation
4436.41159
50742
lower quartile 3673.75
upper quartile 10183
Inter-quartile range 6509.25
correlation 0.76862202
a)Yes
b)No
c) No comment
Q8.Do you permit utilization of liquor?
a)Yes
b)No
TASK.2
2.1 Make information by summarising the raw data
PLACES no. of customer Cost (in pound)
AMERICA 35 12737
EUROPE 9 9574
FRANCE 6 4526
RUSSIA 7 3423
AUSTRALIA 13 7184
THAILAND 20 6149
mean 3640.25
median 1729
mode 35
minimum range 6
maximum range 35
standard deviation
4436.41159
50742
lower quartile 3673.75
upper quartile 10183
Inter-quartile range 6509.25
correlation 0.76862202
⊘ This is a preview!⊘
Do you want full access?
Subscribe today to unlock all pages.
Trusted by 1+ million students worldwide
coefficient 41
2.2 Analyse the range of results:
The above mentioned calculation assist the management of the firm to make over the better
decisions for the firm. Now, it has been found that the company also need to manage their
operations effectively via better decisions(García-Peñalvo and Conde 2014) . Standard deviation
assist the the the firm to know the risk of the operations. So that the firm would able to attain the
objectives. Range also shows the upper and lower limit of the frequency.
2.3 Measures of dispersion
There are various measures which are required to be calculated under the dispersion and
the most common among them are standard deviation and range. Standard deviation is the
measure by which the amount of the risk and the level of the uncertainty which is involved will
be identified. By this the business will be able to take steps in this regard so that the risk can be
reduced. In the given case it is identified at 4436.41 which means that upto this level there will
be risk involved.
The next is the range in which the upper and lower limit are specified and it will be
required that they shall be followed. The results shall be derived within this limit then only the
chances of success will be there. That has been found to be from 6 to 35 which represent the
number of customers.
2.4 Determine how quartiles, percentile and correlation coefficient is utilised to assist the
decision making:
Quartiles
Quartile is one of the third point which divide the range in the data or population in four
equal. The first quartile ( also called lower quartile) it is the number below which it is 25% of the
bottom data. And the second quartile is been divides quartile has 75% data and the top 25 % the
data above.
Percentile
Paraphrase This Document
Need a fresh take? Get an instant paraphrase of this document with our AI Paraphraser
it is an number that are represents an percentage position in all the list of data. For
example, if the performance of the entity is 43rd percentile, so than it can perform the better 43%
of all the entities in the group.
Correlation coefficient
It is the relationship between the two or more fundamental statistical values. There are
few types of correlation coefficients, they are as follows
4. Karl Pearson Correlation coefficients
5. Rank Correlation
6. Intraclass correlation.
With this the organisation can get the help in the making of the decision making. The calculation
that are very effective and influencing which leads the firm to know what exactly performances
has to be carried out in the organisation(Gabrielsson and Gabrielsson, 2013.). It is very easy to
understand the actual situation of the firm's operations. The actual value can be identified with
correlation coefficient. This enhances the growth level of the organisation as well as the
effectiveness of the operations is carried out.
TASK 3
3.1 produce graphs and charts:
Pie Chart:
35
9 6
7
13
20
AMERICA
EUROPE
FRANCE
RUSSIA
AUSTRALIA
THAILAND
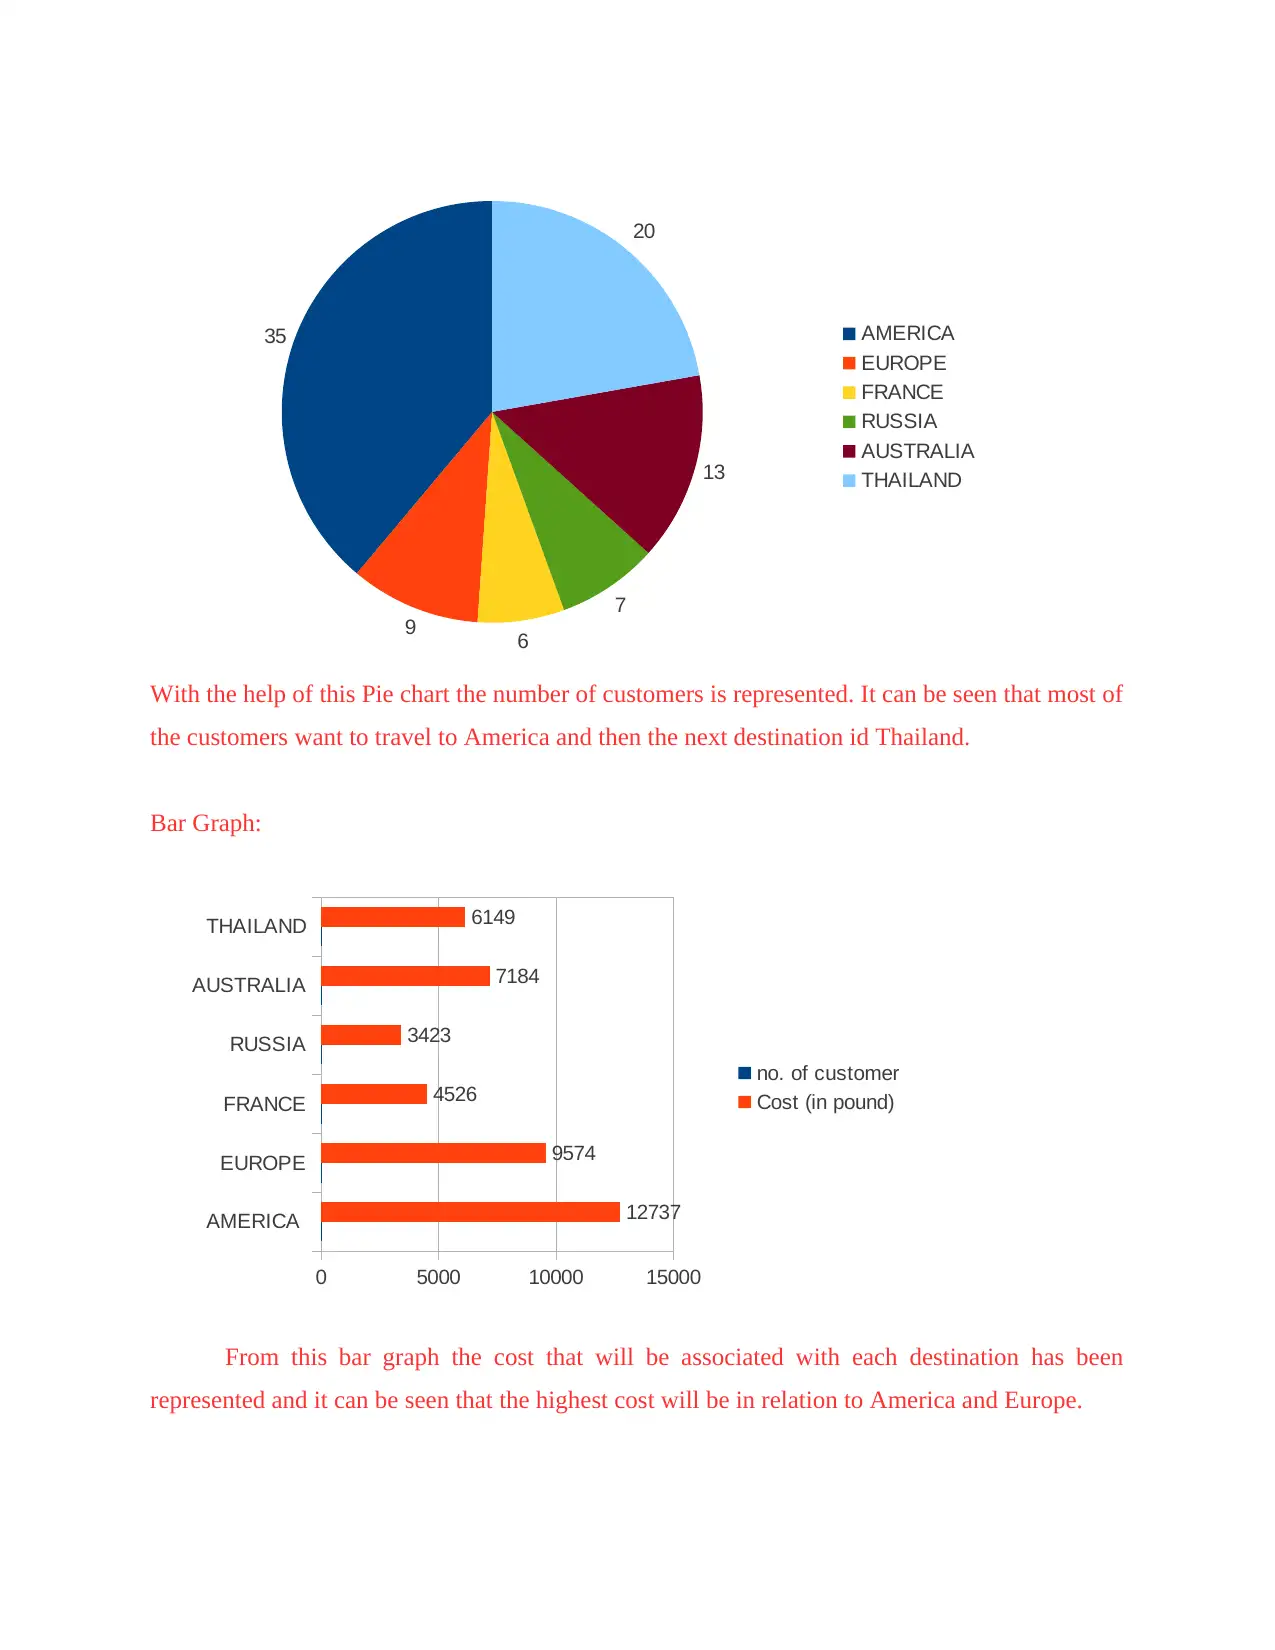
With the help of this Pie chart the number of customers is represented. It can be seen that most of
the customers want to travel to America and then the next destination id Thailand.
Bar Graph:
AMERICA
EUROPE
FRANCE
RUSSIA
AUSTRALIA
THAILAND
0 5000 10000 15000
12737
9574
4526
3423
7184
6149
no. of customer
Cost (in pound)
From this bar graph the cost that will be associated with each destination has been
represented and it can be seen that the highest cost will be in relation to America and Europe.
9 6
7
13
20
AMERICA
EUROPE
FRANCE
RUSSIA
AUSTRALIA
THAILAND
With the help of this Pie chart the number of customers is represented. It can be seen that most of
the customers want to travel to America and then the next destination id Thailand.
Bar Graph:
AMERICA
EUROPE
FRANCE
RUSSIA
AUSTRALIA
THAILAND
0 5000 10000 15000
12737
9574
4526
3423
7184
6149
no. of customer
Cost (in pound)
From this bar graph the cost that will be associated with each destination has been
represented and it can be seen that the highest cost will be in relation to America and Europe.
⊘ This is a preview!⊘
Do you want full access?
Subscribe today to unlock all pages.
Trusted by 1+ million students worldwide
1 out of 19
Related Documents


Your All-in-One AI-Powered Toolkit for Academic Success.
+13062052269
info@desklib.com
Available 24*7 on WhatsApp / Email
![[object Object]](/_next/static/media/star-bottom.7253800d.svg)
Unlock your academic potential
Copyright © 2020–2026 A2Z Services. All Rights Reserved. Developed and managed by ZUCOL.