Business Decision Making Report: Crossrail Project Analysis
VerifiedAdded on 2019/12/03
|22
|4109
|164
Report
AI Summary
This report delves into the core principles of business decision-making, evaluating various scenarios and providing recommendations for optimal outcomes. It incorporates a range of statistical tools and techniques to analyze data, including mean, mode, median, range, standard deviation, and percentiles, with graphical representations like line graphs, pie charts, bar graphs, and scatter plots to visualize data effectively. The report also examines project management methodologies, such as network diagrams, Gantt charts, and critical path analysis, along with investment appraisal techniques like Net Present Value (NPV) and Internal Rate of Return (IRR). The case study focuses on the UK government's Crossrail project, assessing its benefits to the local community, financial aspects, and project duration. The report provides detailed analysis and recommendations to aid in informed business decisions.

BUSINESS DECISION
MAKING
MAKING
Paraphrase This Document
Need a fresh take? Get an instant paraphrase of this document with our AI Paraphraser
TABLE OF CONTENTS
INTRODUCTION................................................................................................................................
TASK 1.................................................................................................................................................
Background..................................................................................................................................3
Rationale......................................................................................................................................3
Objectives of the research............................................................................................................3
Methodology................................................................................................................................4
Data Analysis...............................................................................................................................4
Time Frame..................................................................................................................................4
Budget section.............................................................................................................................5
Questionnaire...............................................................................................................................5
TASK 2.................................................................................................................................................
2.1 & 2.2 Mean, Mode and Median.............................................................................................7
2.3 Range and Standard Deviation..............................................................................................8
2.4 25th Percentile (Lower 25th Percentile (Lower Quartile) and 75th Percentile (Upper
Quartile) and use of Percentile....................................................................................................9
TASK 3...............................................................................................................................................
3.1 & 4.1 Produce line graph.....................................................................................................11
Scatter Plot on Advertising costs and sales...............................................................................13
3.2 & 4.1 Trend Lines................................................................................................................14
3.4 Formal Business Report.......................................................................................................14
TASK 4...............................................................................................................................................
4.2 Prepare a network diagram for activities using Microsoft Project......................................16
Calculate Project Duration.........................................................................................................16
Clearly mark the Critical Path...................................................................................................16
Prepare a Gantt chart and state the benefits of using it as a Project Management Tool............17
TASK 4 B...........................................................................................................................................
4.3 Calculation of Net present value and Internal rate of return...............................................17
Recommendations......................................................................................................................20
CONCLUSION..................................................................................................................................
REFERENCES...................................................................................................................................
INTRODUCTION
In the current business environment, decision making play crucial role in establishing the
operations of business as well as ensuring long term sustainability. In general, business decision
making refers to the process of selecting best among the alternatives (Hedgebeth, 2007). In the
present report, researcher focuses on evaluating different scenarios and accordingly makes
decisions for the suitable results and outcomes. Further, it includes range of statistical tools and
techniques by the means of which different requirement will be satisfied. Along with this,
graphical presentation has been indulged to present the collected data in effective and efficient
manner. Lastly, with the help of investment appraisal techniques decision will be made regarding
selection of suitable and reliable investment proposals.
TASK 1
Background
According to the given case study, Government of UK is planning to start a Crossrail
Project with the aim of enhancing the local transport within London. The main purpose of this
project is provide travelling facilities to 1.5 million people so that it can generate key
employment, leisure and other business activities. Furthermore, it will enhance the journey times
across London to easing congestion and offering better and affordable connections (Badenhorst-
Weiss and et.al, 2008). Along with this, through the help of this project, Government of UK will
change the way of people travel around the capital.
Rationale
The main purpose of conducting this project is to enhance the level of travelling for the
local people and the visitors. Along with this, to minimize the road traffic so that level of
pollution can be managed and controlled. Furthermore, researcher focuses on evaluating the
benefits of Crossrail project for the local community. Therefore, researcher through the help of
this study will investigate different aspects about the project and provide detailed information to
the government officials.
Objectives of the research
The main objective of this study is to determine the benefits of Cross Rail project for the
local community of London. Along with this, to estimate budget and time frame for carrying out
the whole project. The three main objective of research are as follows.
To identify the benefits that this project will give to general public.
3
⊘ This is a preview!⊘
Do you want full access?
Subscribe today to unlock all pages.
Trusted by 1+ million students worldwide
To identify whether this project will contribute to growth of economy of London.
To identify that this whether this project will help in controlling congestion on railway
station.
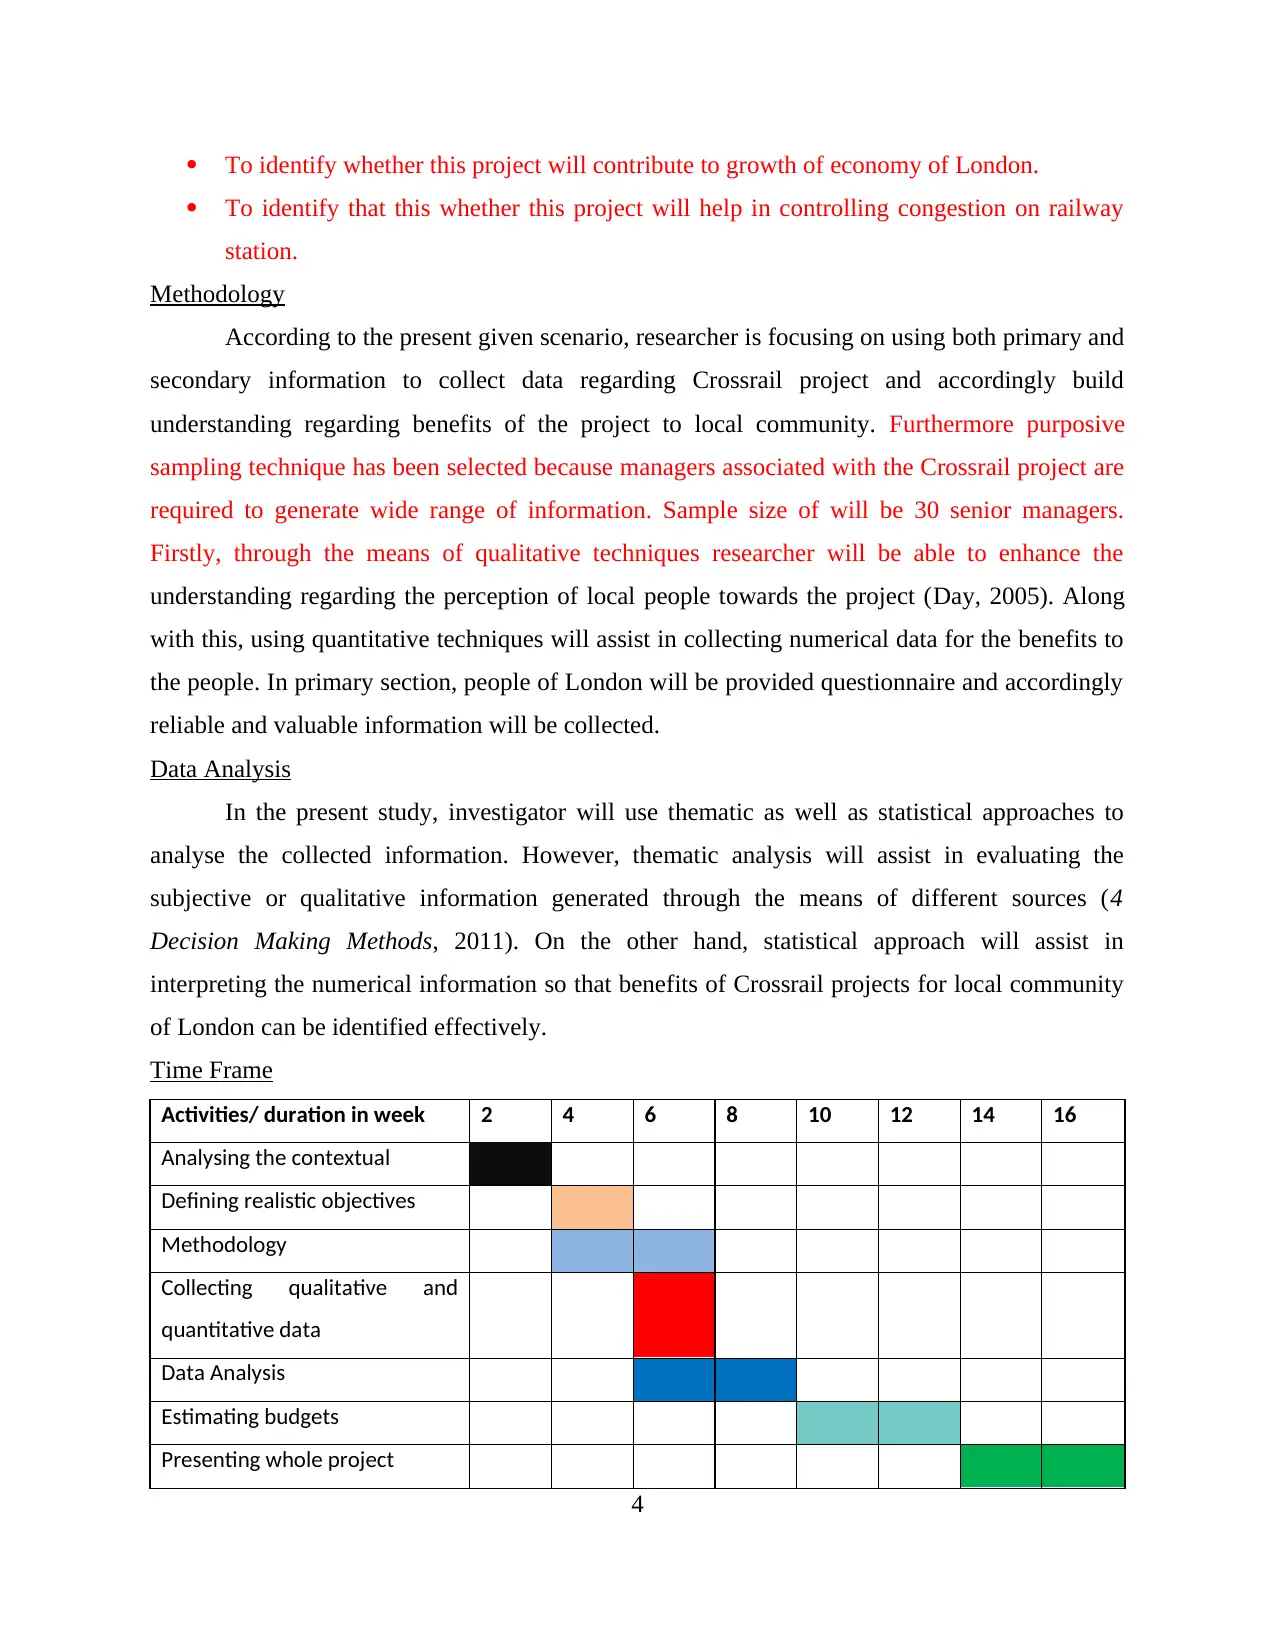
Methodology
According to the present given scenario, researcher is focusing on using both primary and
secondary information to collect data regarding Crossrail project and accordingly build
understanding regarding benefits of the project to local community. Furthermore purposive
sampling technique has been selected because managers associated with the Crossrail project are
required to generate wide range of information. Sample size of will be 30 senior managers.
Firstly, through the means of qualitative techniques researcher will be able to enhance the
understanding regarding the perception of local people towards the project (Day, 2005). Along
with this, using quantitative techniques will assist in collecting numerical data for the benefits to
the people. In primary section, people of London will be provided questionnaire and accordingly
reliable and valuable information will be collected.
Data Analysis
In the present study, investigator will use thematic as well as statistical approaches to
analyse the collected information. However, thematic analysis will assist in evaluating the
subjective or qualitative information generated through the means of different sources (4
Decision Making Methods, 2011). On the other hand, statistical approach will assist in
interpreting the numerical information so that benefits of Crossrail projects for local community
of London can be identified effectively.
Time Frame
Activities/ duration in week 2 4 6 8 10 12 14 16
Analysing the contextual
Defining realistic objectives
Methodology
Collecting qualitative and
quantitative data
Data Analysis
Estimating budgets
Presenting whole project
4
To identify that this whether this project will help in controlling congestion on railway
station.
Methodology
According to the present given scenario, researcher is focusing on using both primary and
secondary information to collect data regarding Crossrail project and accordingly build
understanding regarding benefits of the project to local community. Furthermore purposive
sampling technique has been selected because managers associated with the Crossrail project are
required to generate wide range of information. Sample size of will be 30 senior managers.
Firstly, through the means of qualitative techniques researcher will be able to enhance the
understanding regarding the perception of local people towards the project (Day, 2005). Along
with this, using quantitative techniques will assist in collecting numerical data for the benefits to
the people. In primary section, people of London will be provided questionnaire and accordingly
reliable and valuable information will be collected.
Data Analysis
In the present study, investigator will use thematic as well as statistical approaches to
analyse the collected information. However, thematic analysis will assist in evaluating the
subjective or qualitative information generated through the means of different sources (4
Decision Making Methods, 2011). On the other hand, statistical approach will assist in
interpreting the numerical information so that benefits of Crossrail projects for local community
of London can be identified effectively.
Time Frame
Activities/ duration in week 2 4 6 8 10 12 14 16
Analysing the contextual
Defining realistic objectives
Methodology
Collecting qualitative and
quantitative data
Data Analysis
Estimating budgets
Presenting whole project
4
Paraphrase This Document
Need a fresh take? Get an instant paraphrase of this document with our AI Paraphraser
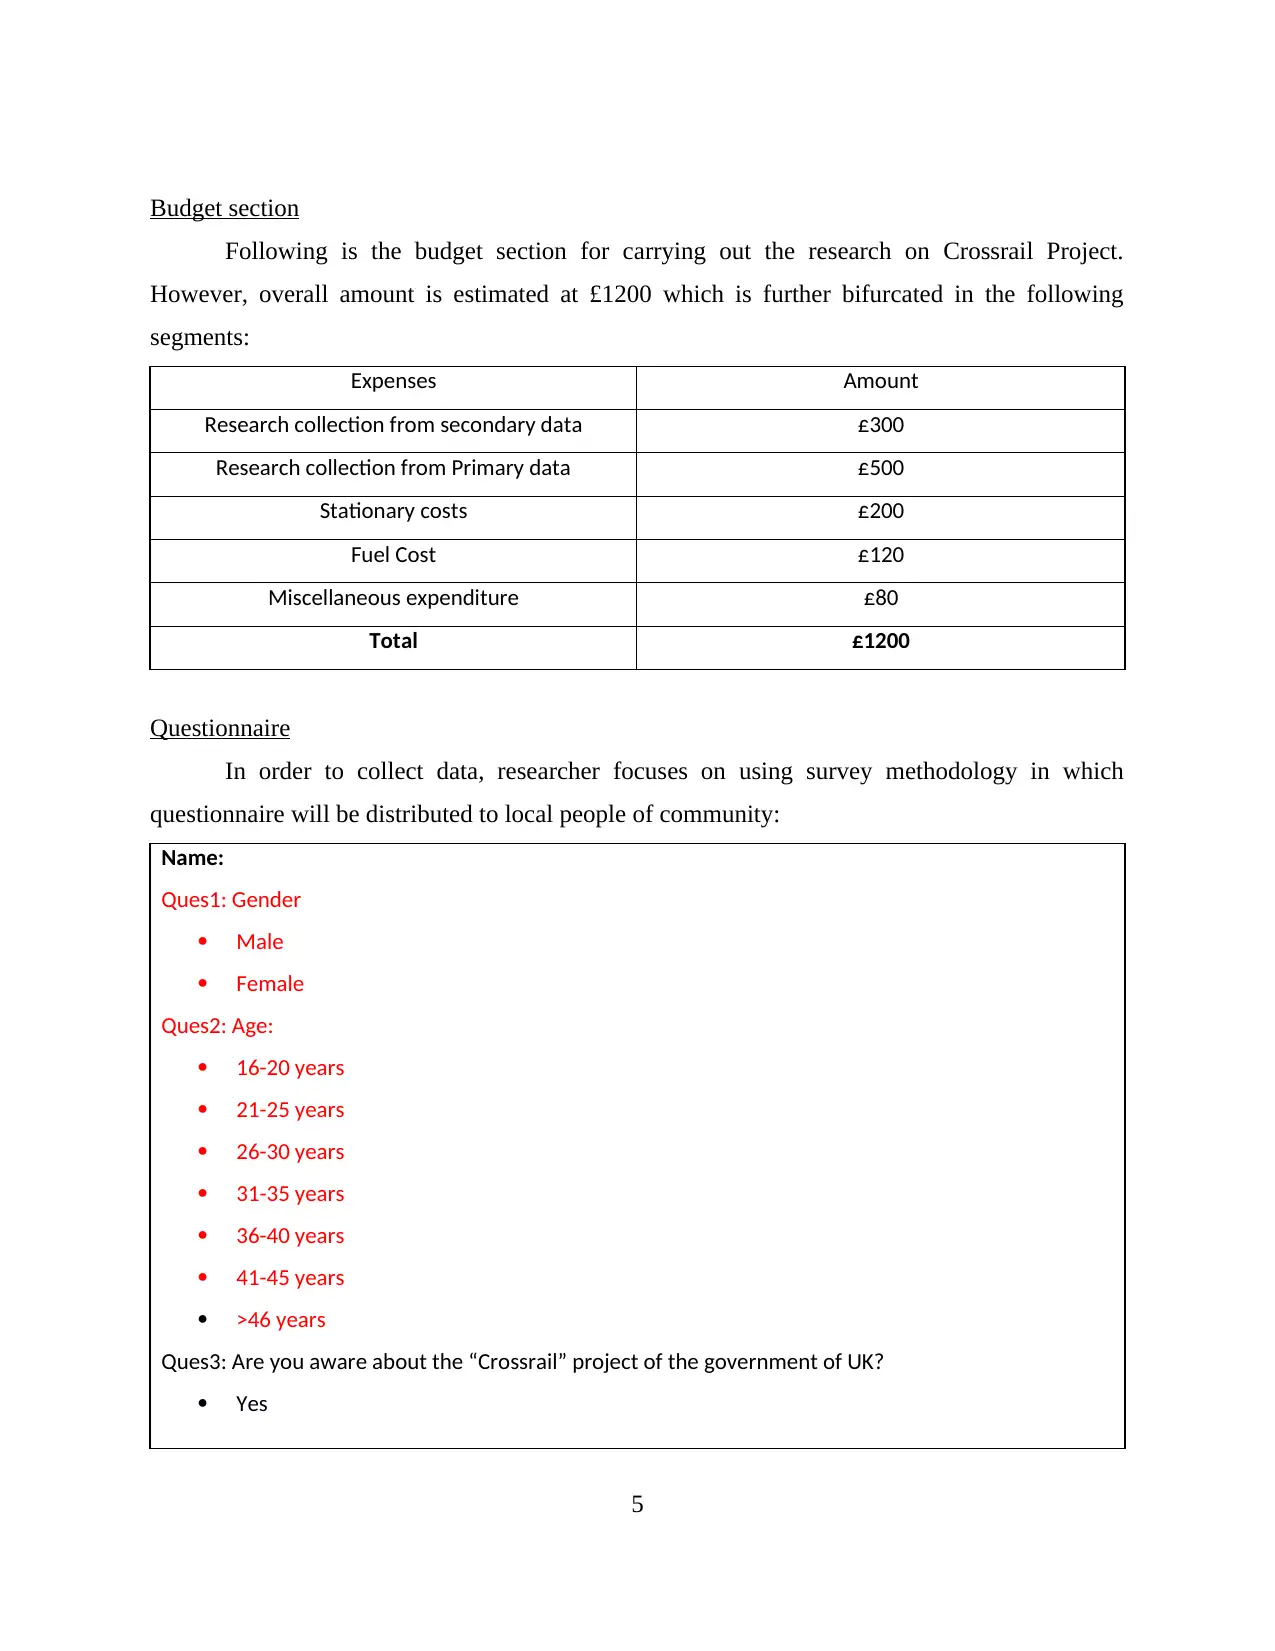
Budget section
Following is the budget section for carrying out the research on Crossrail Project.
However, overall amount is estimated at £1200 which is further bifurcated in the following
segments:
Expenses Amount
Research collection from secondary data £300
Research collection from Primary data £500
Stationary costs £200
Fuel Cost £120
Miscellaneous expenditure £80
Total £1200
Questionnaire
In order to collect data, researcher focuses on using survey methodology in which
questionnaire will be distributed to local people of community:
Name:
Ques1: Gender
Male
Female
Ques2: Age:
16-20 years
21-25 years
26-30 years
31-35 years
36-40 years
41-45 years
>46 years
Ques3: Are you aware about the “Crossrail” project of the government of UK?
Yes
5
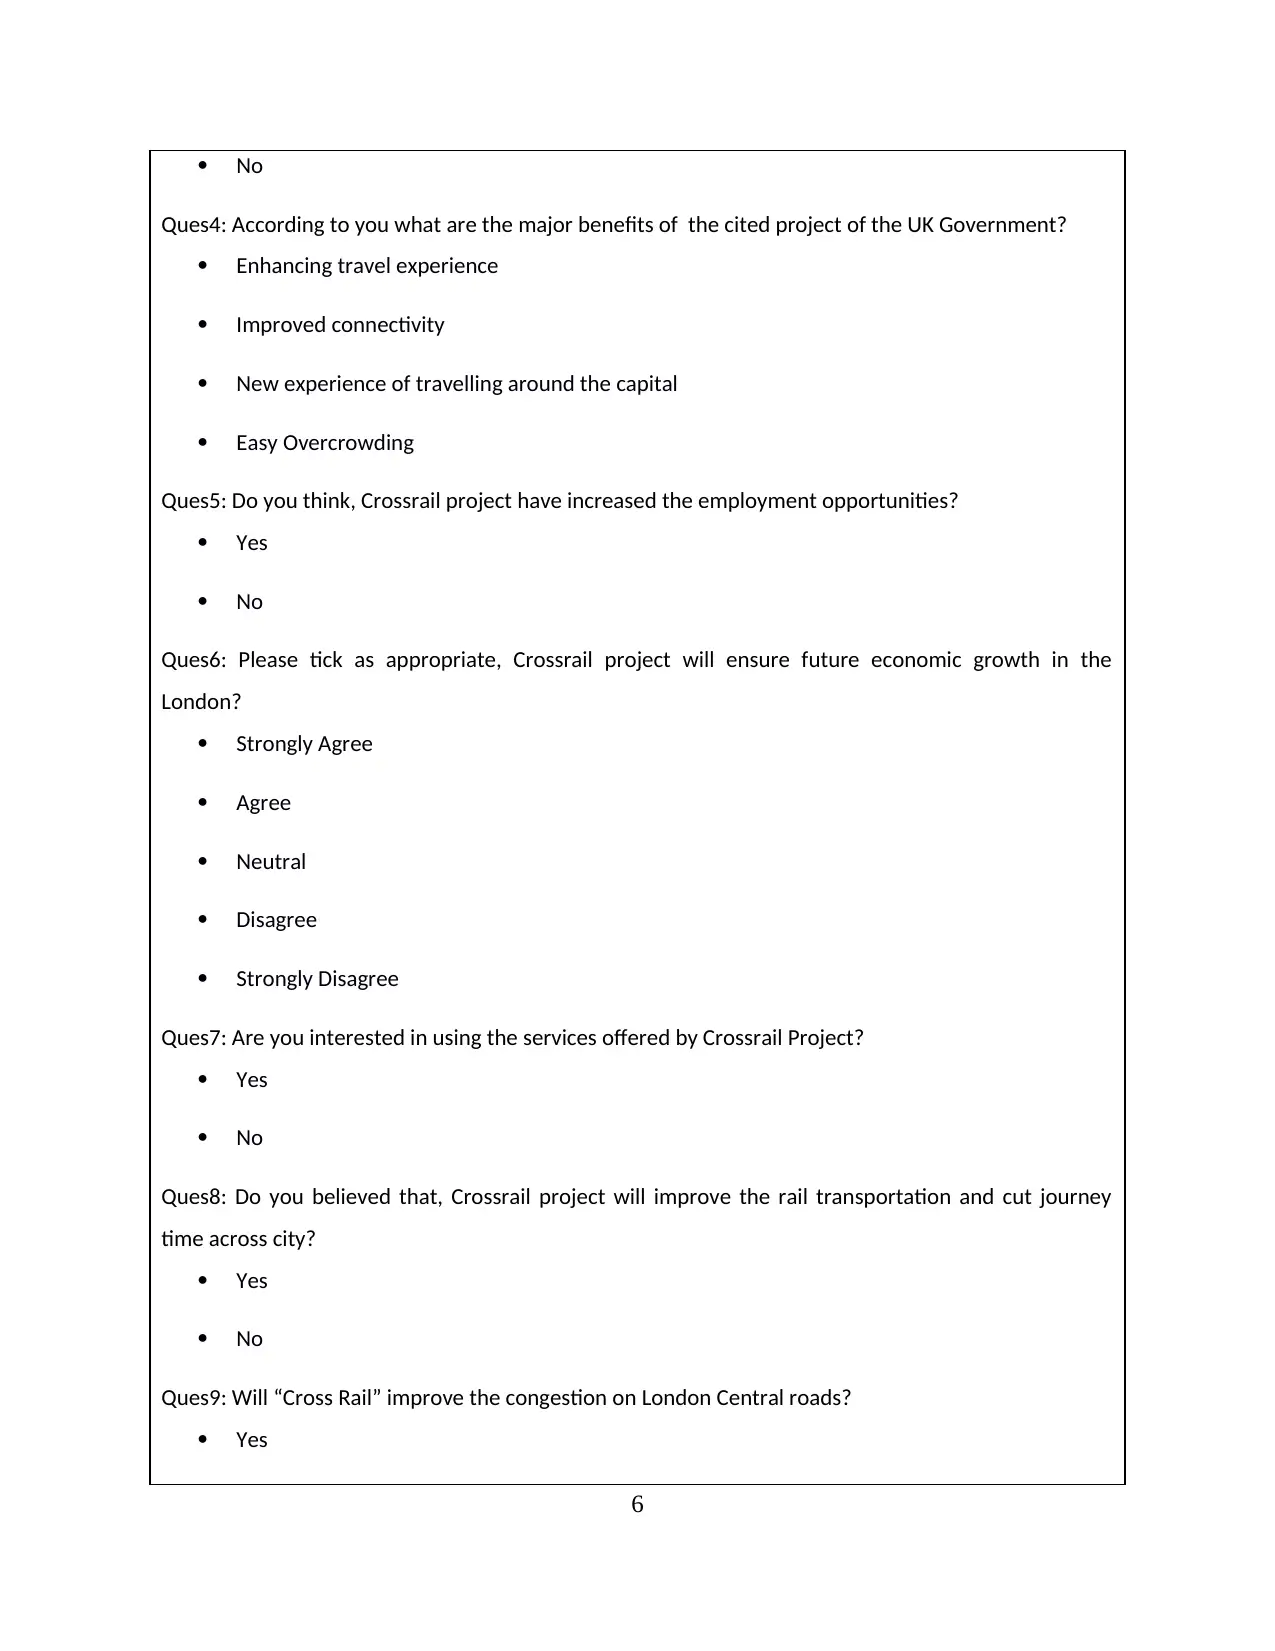
No
Ques4: According to you what are the major benefits of the cited project of the UK Government?
Enhancing travel experience
Improved connectivity
New experience of travelling around the capital
Easy Overcrowding
Ques5: Do you think, Crossrail project have increased the employment opportunities?
Yes
No
Ques6: Please tick as appropriate, Crossrail project will ensure future economic growth in the
London?
Strongly Agree
Agree
Neutral
Disagree
Strongly Disagree
Ques7: Are you interested in using the services offered by Crossrail Project?
Yes
No
Ques8: Do you believed that, Crossrail project will improve the rail transportation and cut journey
time across city?
Yes
No
Ques9: Will “Cross Rail” improve the congestion on London Central roads?
Yes
6
⊘ This is a preview!⊘
Do you want full access?
Subscribe today to unlock all pages.
Trusted by 1+ million students worldwide
No
Maybe
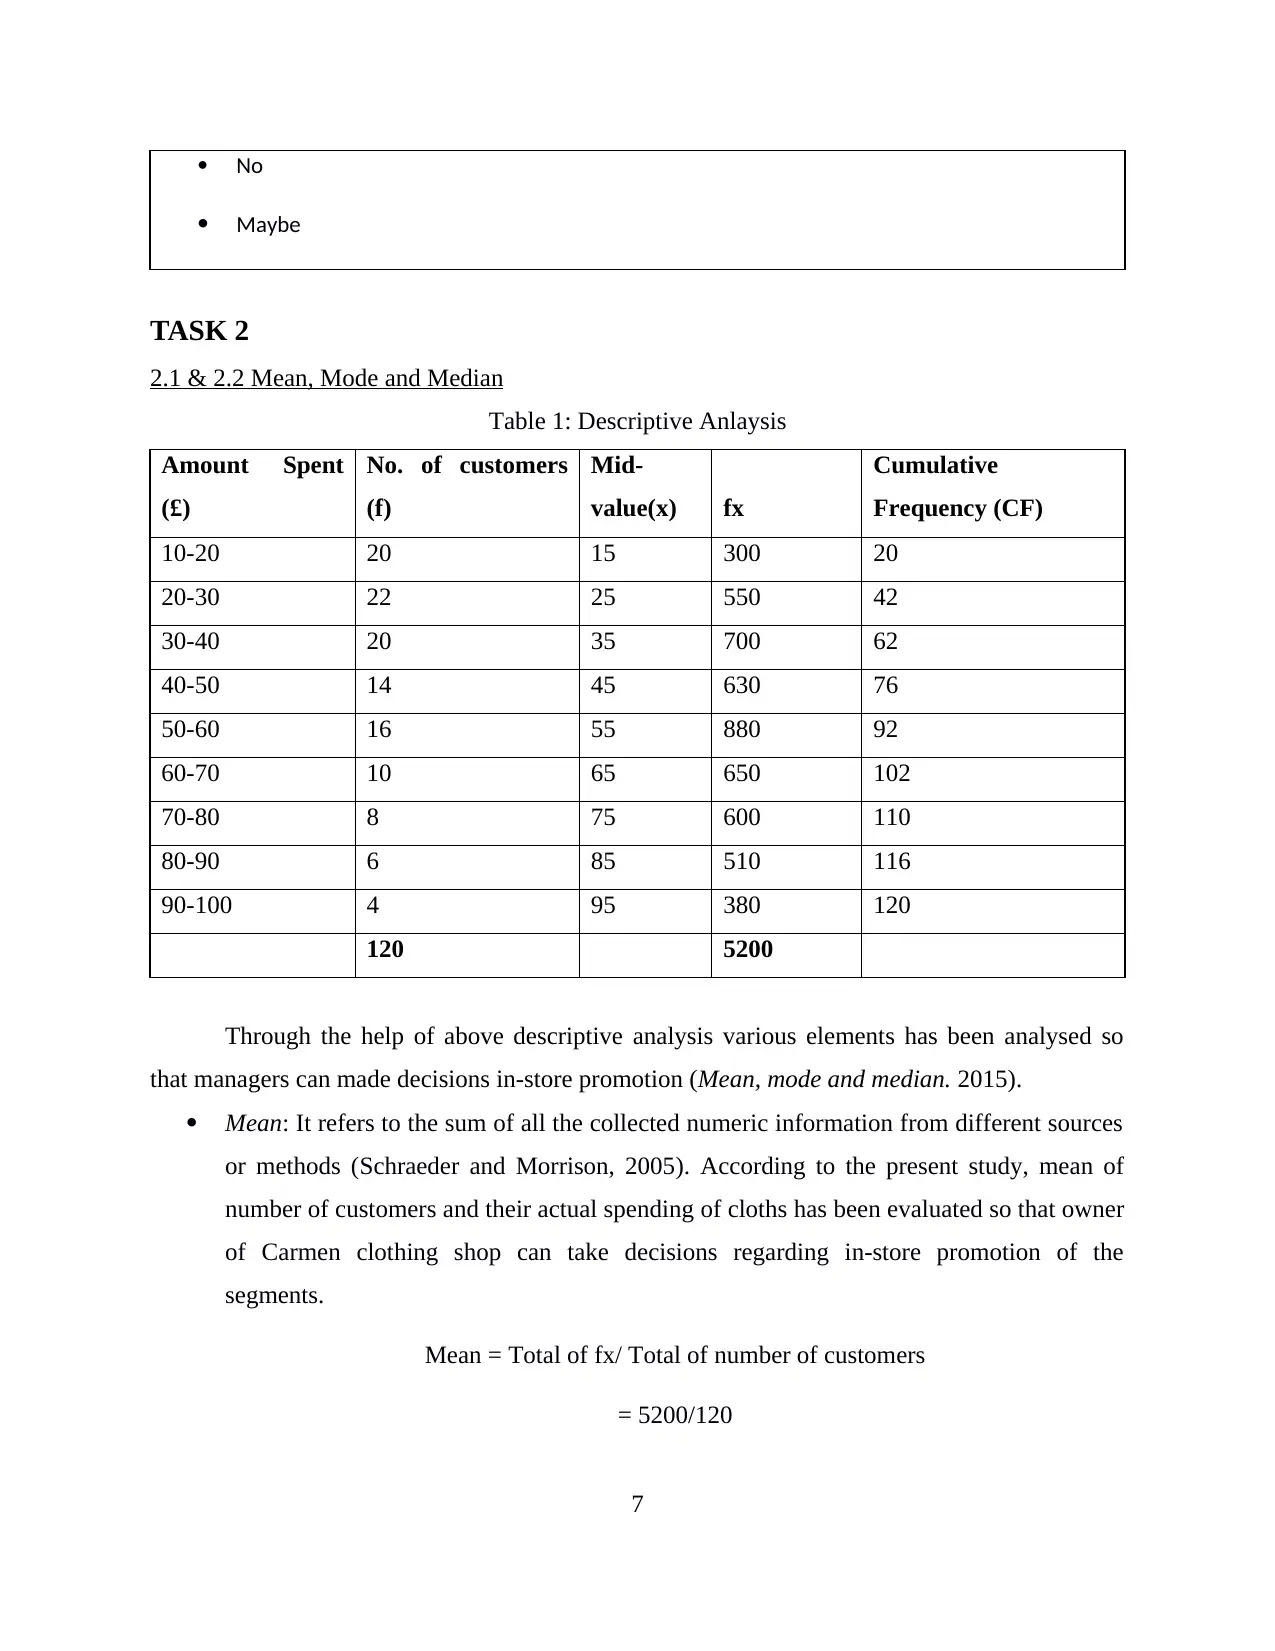
TASK 2
2.1 & 2.2 Mean, Mode and Median
Table 1: Descriptive Anlaysis
Amount Spent
(£)
No. of customers
(f)
Mid-
value(x) fx
Cumulative
Frequency (CF)
10-20 20 15 300 20
20-30 22 25 550 42
30-40 20 35 700 62
40-50 14 45 630 76
50-60 16 55 880 92
60-70 10 65 650 102
70-80 8 75 600 110
80-90 6 85 510 116
90-100 4 95 380 120
120 5200
Through the help of above descriptive analysis various elements has been analysed so
that managers can made decisions in-store promotion (Mean, mode and median. 2015).
Mean: It refers to the sum of all the collected numeric information from different sources
or methods (Schraeder and Morrison, 2005). According to the present study, mean of
number of customers and their actual spending of cloths has been evaluated so that owner
of Carmen clothing shop can take decisions regarding in-store promotion of the
segments.
Mean = Total of fx/ Total of number of customers
= 5200/120
7
Maybe
TASK 2
2.1 & 2.2 Mean, Mode and Median
Table 1: Descriptive Anlaysis
Amount Spent
(£)
No. of customers
(f)
Mid-
value(x) fx
Cumulative
Frequency (CF)
10-20 20 15 300 20
20-30 22 25 550 42
30-40 20 35 700 62
40-50 14 45 630 76
50-60 16 55 880 92
60-70 10 65 650 102
70-80 8 75 600 110
80-90 6 85 510 116
90-100 4 95 380 120
120 5200
Through the help of above descriptive analysis various elements has been analysed so
that managers can made decisions in-store promotion (Mean, mode and median. 2015).
Mean: It refers to the sum of all the collected numeric information from different sources
or methods (Schraeder and Morrison, 2005). According to the present study, mean of
number of customers and their actual spending of cloths has been evaluated so that owner
of Carmen clothing shop can take decisions regarding in-store promotion of the
segments.
Mean = Total of fx/ Total of number of customers
= 5200/120
7
Paraphrase This Document
Need a fresh take? Get an instant paraphrase of this document with our AI Paraphraser
Mode: It is the number which frequently appears within the collected information for the
present study (Aripin, Tower and Taylor, 2011). The amount spend by customers of £20-
£30 has the highest frequency of 22 customers. Hence, mode for the present study is as
follows:
Mode = Lmo + (Δ1/ Δ1 + Δ2) * i
= 20 + (22-20) / (22-20) + (22-20)* 10
= 25
Median: In statistical term, it is the middle value of the collected information. Thus,
median for present study is:
Median = lower limit + (60- CF of previous class interval)/Frequency * class interval
= 30 + (60-42)/20*10
= 30+18/20 *10
= 30+9
= 39
2.3 Range and Standard Deviation
Table 1: Measure of Dispersion
Amount Spent (£)
No. of customers
(f) Mid- value(x) X^2 fx^2 fx
10-20 20 15 225 4500 300
20-30 22 25 625 13750 550
30-40 20 35 1225 24500 700
40-50 14 45 2025 28350 630
50-60 16 55 3025 48400 880
60-70 10 65 4225 42250 650
70-80 8 75 5625 45000 600
80-90 6 85 7225 43350 510
90-100 4 95 9025 36100 380
8
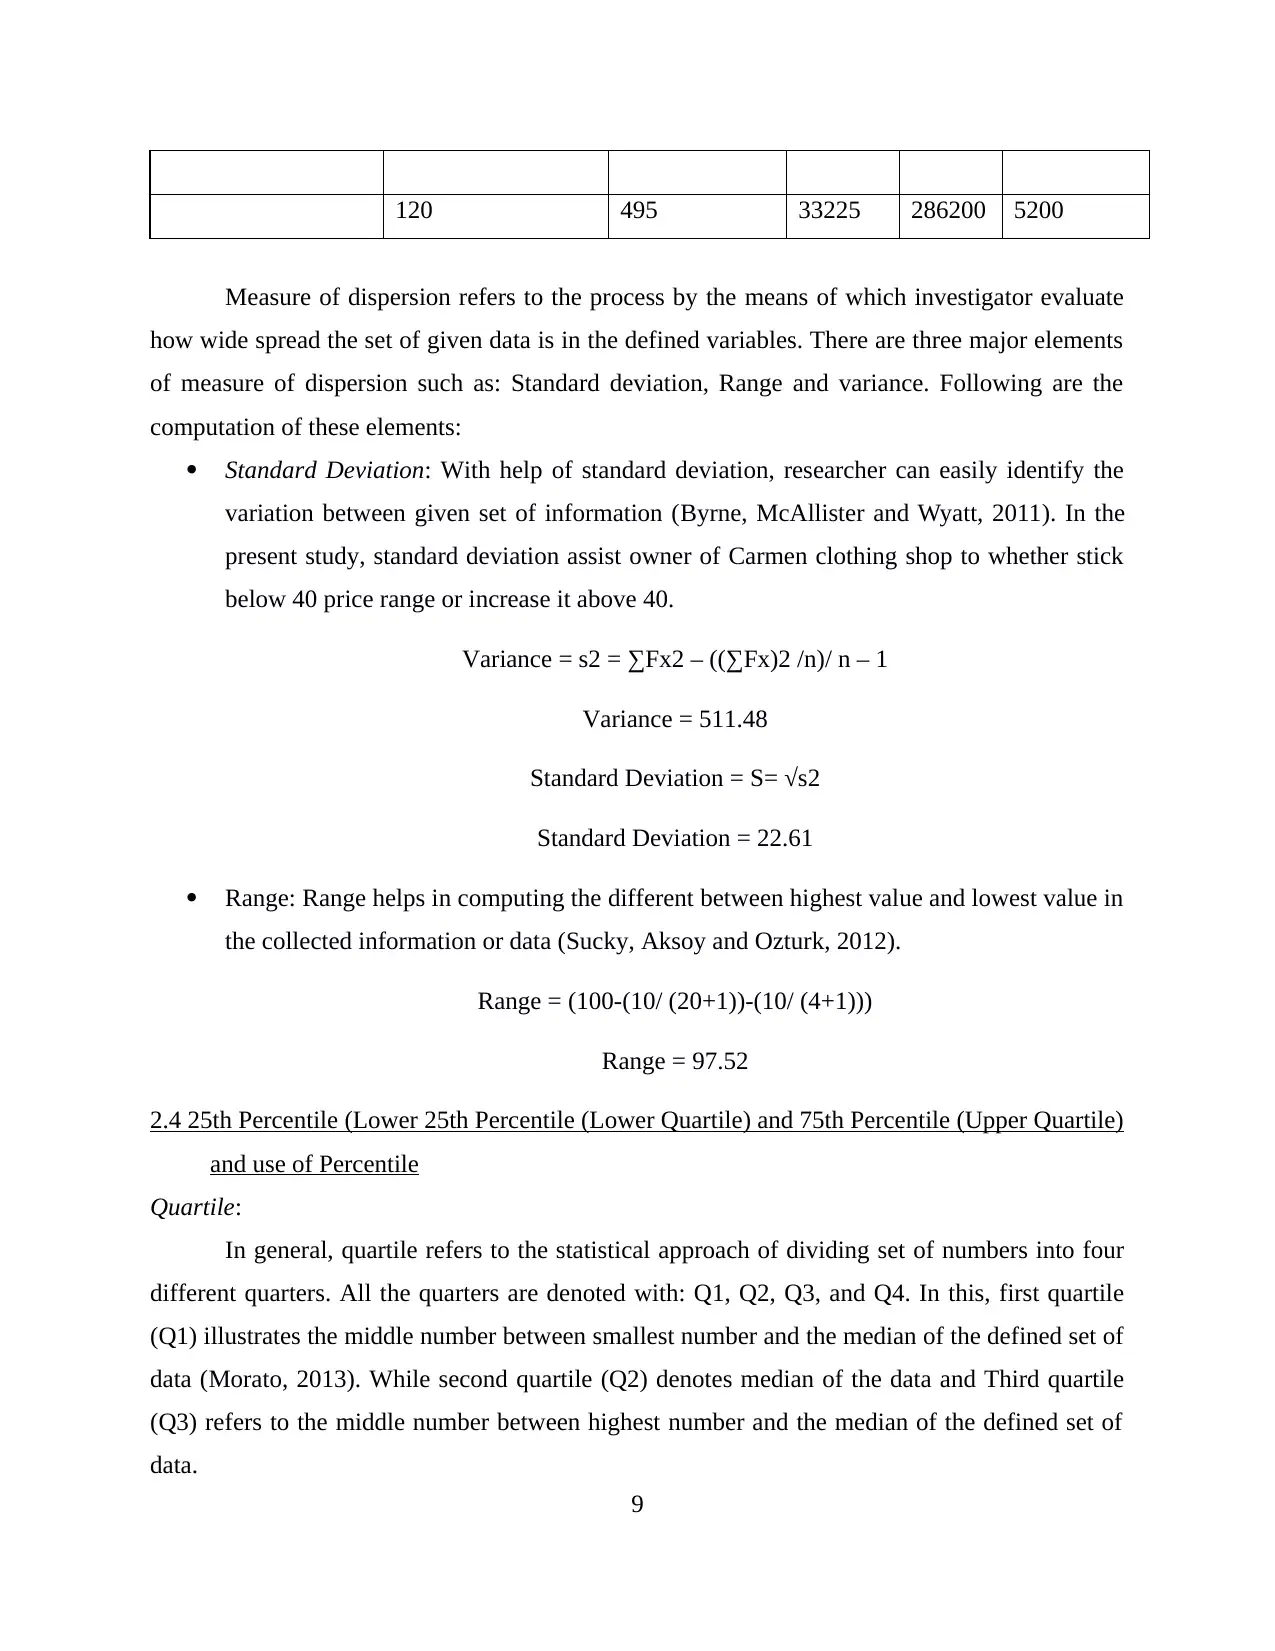
120 495 33225 286200 5200
Measure of dispersion refers to the process by the means of which investigator evaluate
how wide spread the set of given data is in the defined variables. There are three major elements
of measure of dispersion such as: Standard deviation, Range and variance. Following are the
computation of these elements:
Standard Deviation: With help of standard deviation, researcher can easily identify the
variation between given set of information (Byrne, McAllister and Wyatt, 2011). In the
present study, standard deviation assist owner of Carmen clothing shop to whether stick
below 40 price range or increase it above 40.
Variance = s2 = ∑Fx2 – ((∑Fx)2 /n)/ n – 1
Variance = 511.48
Standard Deviation = S= √s2
Standard Deviation = 22.61
Range: Range helps in computing the different between highest value and lowest value in
the collected information or data (Sucky, Aksoy and Ozturk, 2012).
Range = (100-(10/ (20+1))-(10/ (4+1)))
Range = 97.52
2.4 25th Percentile (Lower 25th Percentile (Lower Quartile) and 75th Percentile (Upper Quartile)
and use of Percentile
Quartile:
In general, quartile refers to the statistical approach of dividing set of numbers into four
different quarters. All the quarters are denoted with: Q1, Q2, Q3, and Q4. In this, first quartile
(Q1) illustrates the middle number between smallest number and the median of the defined set of
data (Morato, 2013). While second quartile (Q2) denotes median of the data and Third quartile
(Q3) refers to the middle number between highest number and the median of the defined set of
data.
9
⊘ This is a preview!⊘
Do you want full access?
Subscribe today to unlock all pages.
Trusted by 1+ million students worldwide
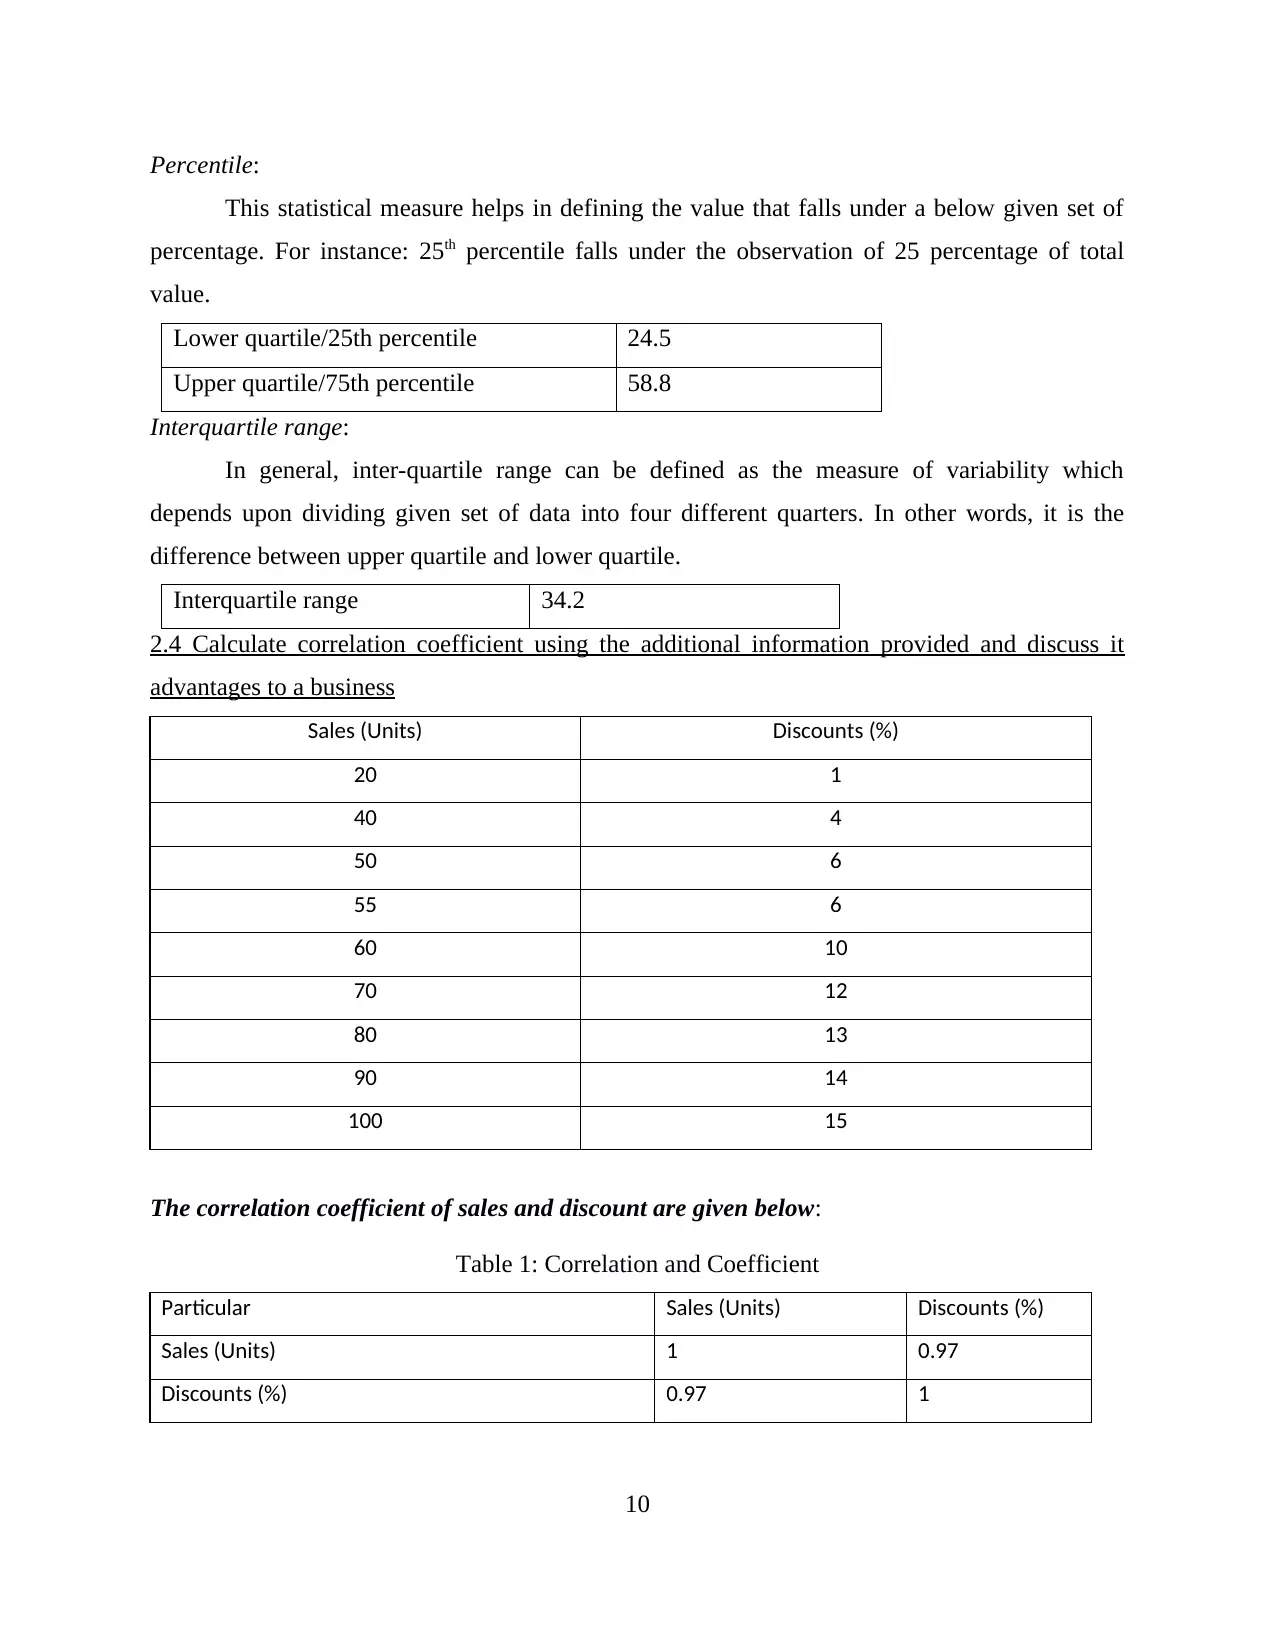
Percentile:
This statistical measure helps in defining the value that falls under a below given set of
percentage. For instance: 25th percentile falls under the observation of 25 percentage of total
value.
Lower quartile/25th percentile 24.5
Upper quartile/75th percentile 58.8
Interquartile range:
In general, inter-quartile range can be defined as the measure of variability which
depends upon dividing given set of data into four different quarters. In other words, it is the
difference between upper quartile and lower quartile.
Interquartile range 34.2
2.4 Calculate correlation coefficient using the additional information provided and discuss it
advantages to a business
Sales (Units) Discounts (%)
20 1
40 4
50 6
55 6
60 10
70 12
80 13
90 14
100 15
The correlation coefficient of sales and discount are given below:
Table 1: Correlation and Coefficient
Particular Sales (Units) Discounts (%)
Sales (Units) 1 0.97
Discounts (%) 0.97 1
10
Paraphrase This Document
Need a fresh take? Get an instant paraphrase of this document with our AI Paraphraser
As per the formula R2 =0.97
On the basis of above computation of correlation coefficient it has been evaluated that,
sales and discounts are highly correlated to the each other. Hence, if the units of sales increases,
discount rates also increase and vice-verse.
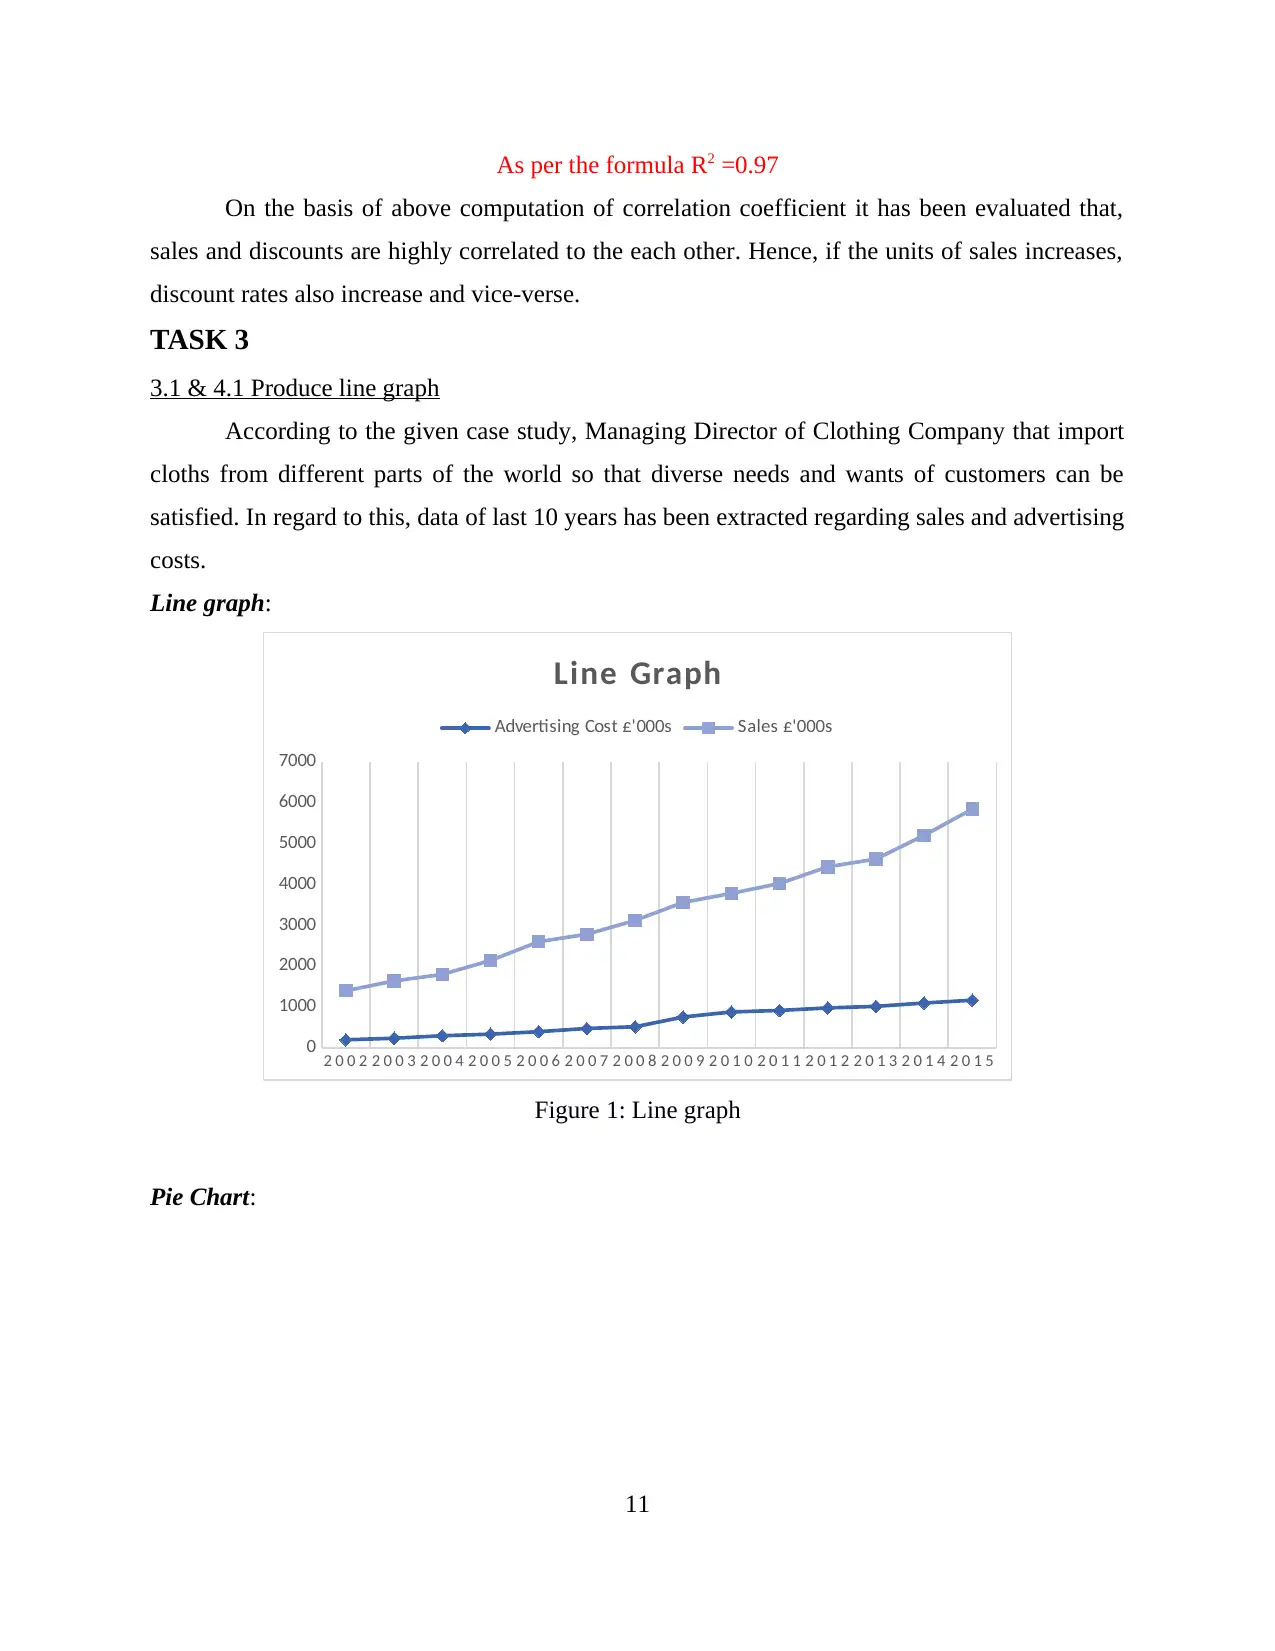
TASK 3
3.1 & 4.1 Produce line graph
According to the given case study, Managing Director of Clothing Company that import
cloths from different parts of the world so that diverse needs and wants of customers can be
satisfied. In regard to this, data of last 10 years has been extracted regarding sales and advertising
costs.
Line graph:
2 0 0 2 2 0 0 3 2 0 0 4 2 0 0 5 2 0 0 6 2 0 0 7 2 0 0 8 2 0 0 9 2 0 1 0 2 0 1 1 2 0 1 2 2 0 1 3 2 0 1 4 2 0 1 5
0
1000
2000
3000
4000
5000
6000
7000
Line Graph
Advertising Cost £'000s Sales £'000s
Figure 1: Line graph
Pie Chart:
11
On the basis of above computation of correlation coefficient it has been evaluated that,
sales and discounts are highly correlated to the each other. Hence, if the units of sales increases,
discount rates also increase and vice-verse.
TASK 3
3.1 & 4.1 Produce line graph
According to the given case study, Managing Director of Clothing Company that import
cloths from different parts of the world so that diverse needs and wants of customers can be
satisfied. In regard to this, data of last 10 years has been extracted regarding sales and advertising
costs.
Line graph:
2 0 0 2 2 0 0 3 2 0 0 4 2 0 0 5 2 0 0 6 2 0 0 7 2 0 0 8 2 0 0 9 2 0 1 0 2 0 1 1 2 0 1 2 2 0 1 3 2 0 1 4 2 0 1 5
0
1000
2000
3000
4000
5000
6000
7000
Line Graph
Advertising Cost £'000s Sales £'000s
Figure 1: Line graph
Pie Chart:
11
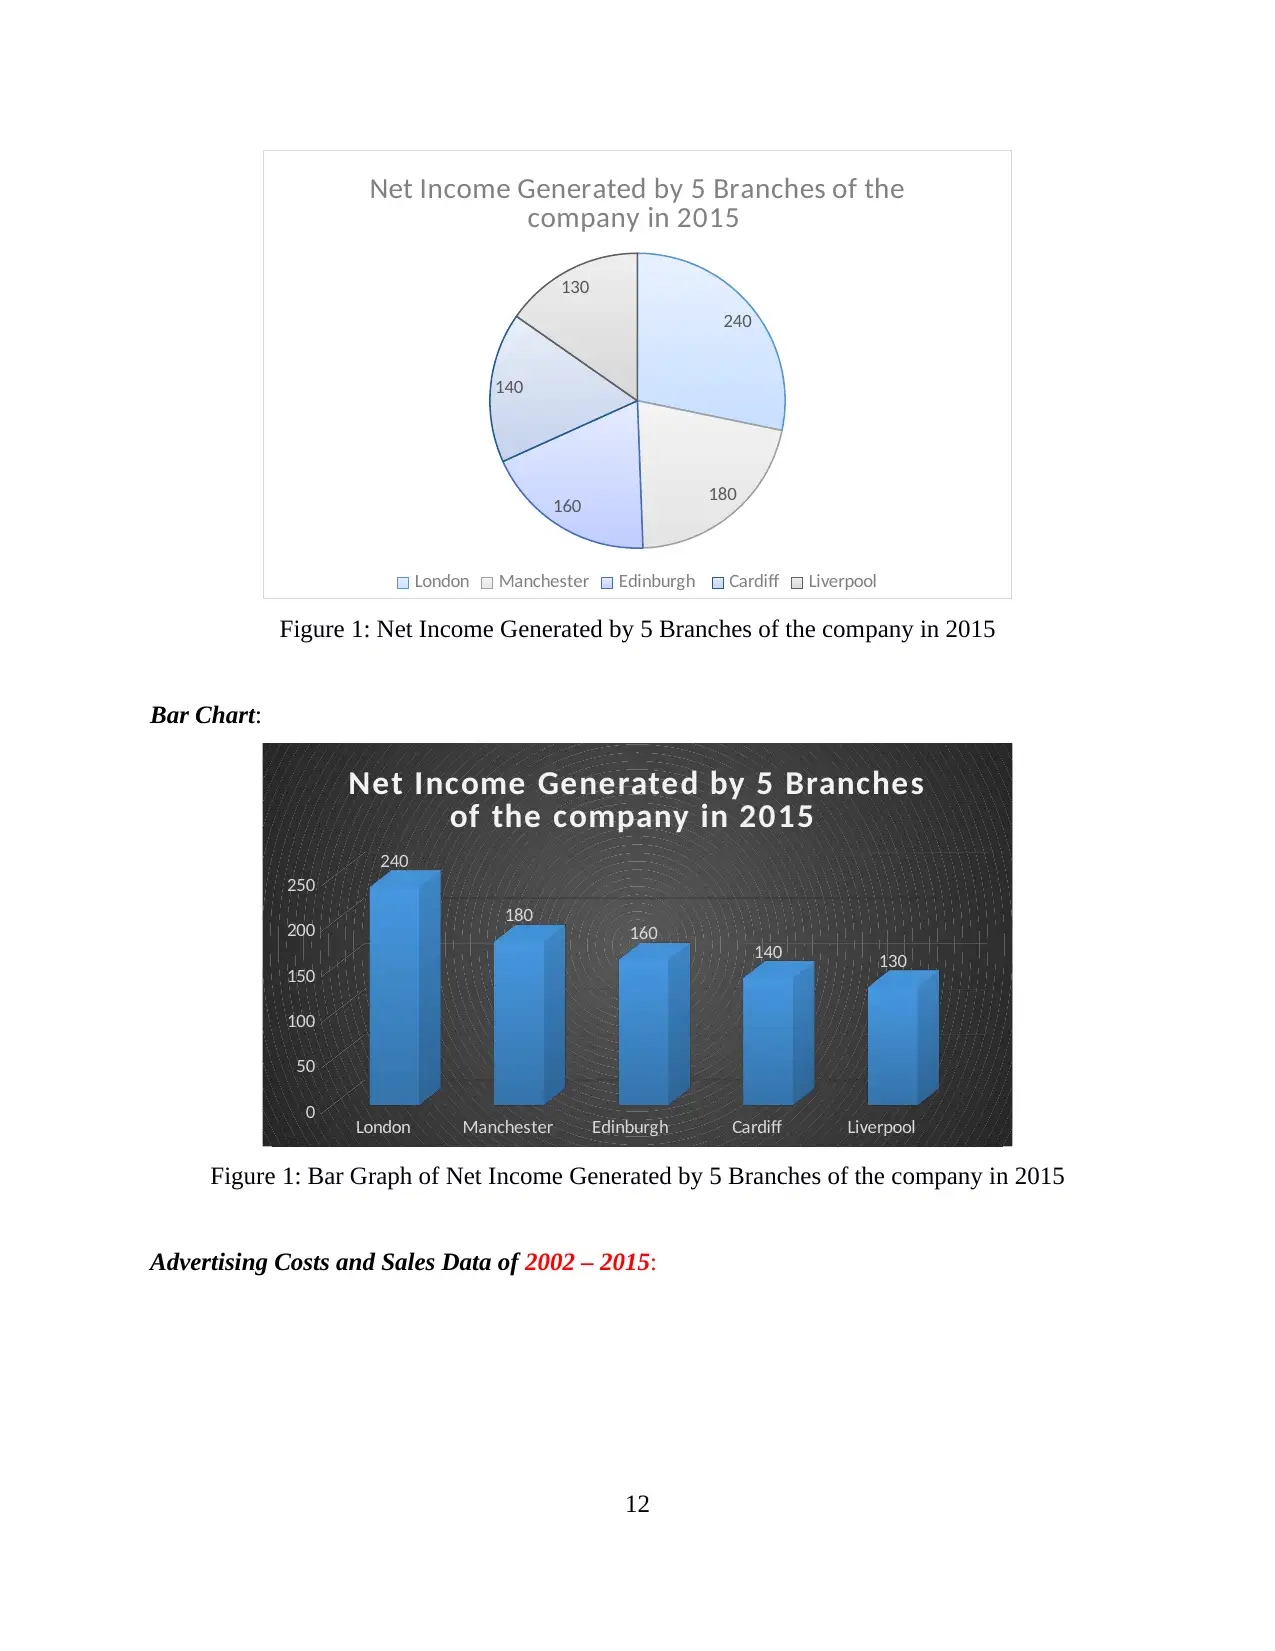
240
180
160
140
130
Net Income Generated by 5 Branches of the
company in 2015
London Manchester Edinburgh Cardiff Liverpool
Figure 1: Net Income Generated by 5 Branches of the company in 2015
Bar Chart:
London Manchester Edinburgh Cardiff Liverpool
0
50
100
150
200
250
240
180 160 140 130
Net Income Generated by 5 Branches
of the company in 2015
Figure 1: Bar Graph of Net Income Generated by 5 Branches of the company in 2015
Advertising Costs and Sales Data of 2002 – 2015:
12
⊘ This is a preview!⊘
Do you want full access?
Subscribe today to unlock all pages.
Trusted by 1+ million students worldwide
1 out of 22
Related Documents


Your All-in-One AI-Powered Toolkit for Academic Success.
+13062052269
info@desklib.com
Available 24*7 on WhatsApp / Email
![[object Object]](/_next/static/media/star-bottom.7253800d.svg)
Unlock your academic potential
Copyright © 2020–2026 A2Z Services. All Rights Reserved. Developed and managed by ZUCOL.