HND Business Level 5: Business Decision Making Report - Analysis
VerifiedAdded on 2020/07/22
|21
|4352
|41
Report
AI Summary
This report, created for an HND Business course, focuses on business decision-making processes. It begins with an introduction to the importance of decisions in a competitive market and highlights the role of research. The report then details the collection of primary and secondary data, including survey methodologies, sampling frames, and questionnaire design for a restaurant expansion scenario. Task 2 involves summarizing and analyzing the collected data, calculating measures of central tendency (mean, median, mode) and dispersion (standard deviation, variance), and utilizing quartiles, percentiles, and correlation coefficients. Task 3 focuses on data presentation using graphs and trend lines, culminating in a business presentation and formal report. The final task explores information processing tools and financial tools used in decision-making, concluding with a project plan and financial analysis for a business activity. The report provides comprehensive insights into data-driven decision-making in a business context.

BUSINESS DECISION
MAKING
MAKING
Paraphrase This Document
Need a fresh take? Get an instant paraphrase of this document with our AI Paraphraser
Table of Contents
INTRODUCTION...........................................................................................................................1
TASK 1 ..........................................................................................................................................1
1.1 Plan for collection of primary and secondary data................................................................1
1.2 Survey methodologies and sampling frame used..................................................................2
1.3 Questionnaire design for given problem...............................................................................2
TASK 2 ...........................................................................................................................................4
2.1 Summarisation of information..............................................................................................4
2.2 Results analysis.....................................................................................................................5
2.3 Analysis of measure of dispersion with standard deviation..................................................6
2.4 Use of quartile, percentile and correlation coefficient for data calculation..........................6
TASK 3 ...........................................................................................................................................7
3.1 Graph production through using spreadsheet........................................................................7
3.2 Formulation of trend lines in order to determine the results................................................9
3.3 Business presentation for dissemination of information.....................................................11
3.4 Formal business report........................................................................................................11
TASK 4 .........................................................................................................................................11
4.1 Appropriate information processing tool............................................................................11
4.2 Project plan for an activity..................................................................................................12
.......................................................................................................................................................13
4.3 Financial tools use in decision making...............................................................................14
CONCLUSION .............................................................................................................................15
REFERENCES..............................................................................................................................16

⊘ This is a preview!⊘
Do you want full access?
Subscribe today to unlock all pages.
Trusted by 1+ million students worldwide
INTRODUCTION
Business decision are very important for any organisation working in dynamic
environment. These decisions shows where a firm is standing in terms of its rivals. To survive in
today's dynamic market with presence of numerous competitors is not easy for any business
organisation. Thus, a manager has to given utmost care to each and every decisions that are taken
by him. Also right time is one of the essence. That's why it is said to take appropriate decisions at
right time. Research department has to play key role in gathering essential data that are
transformed into useful information. The information will help business to frame strategies of
firm. Also conclusions and results drawn from these informations will be helpful for stakeholders
too for assessing position of brand in market. Murano is one of the most popular restaurant in
London. They are known for their brand image. The business is successful because of its
appropriate decisions taken by manager of organisation.
TASK 1
1.1 Plan for collection of primary and secondary data
London is one of the most exciting place in the world. The number of tourists who visit
London are increasing day by-day. The business opportunities there are enormous. Obviously
every organisation like to get benefit from such business opportunities. Murano is a popular
restaurant known for its customer service. They are liking to expand their business. Thus, data
collection is must.
Primary data- The primary data can be collected through loyal customers and data can
be gathered. The ways to collect those data can be questionnaires, survey etc.
Secondary data- The second data can also be used by understanding different
philosophies required to carry out expansion effectively. The journals, publications, online etc.
To understand marketing conditions are most important. Interview can be one of the best
technique of data collection from customers. A restaurant can also adopt questionnaires methods
by getting feedback in the form of greeting thank you to them. They can also use their websites
and e-commerce links in order to get reviews from customers. It is said that customers are king
of market and satisfying them is the utmost concern for them. The records that re readily can also
be of great importance. The rivals data and information helps the firm to effectively manage their
enhancement of business. Both qualitative and quantitative techniques should be used.
1
Paraphrase This Document
Need a fresh take? Get an instant paraphrase of this document with our AI Paraphraser
Observations, images can also generate great information. The decision making should be
appropriate so that it will serve organisation in future course of time.
1.2 Survey methodologies and sampling frame used
Survey methodologies is the kind of tool used for gathering essential information. A firm
like to targets different segments and collection should be done in a way that best possible get
useful information to business organisation. Wants and needs, product preferences and new
methods to improve customer service can be important and considered at the time of data
gatherings. A sample should be chosen in such a way that best represent characteristics of total
population. There are two kinds i.e. probability and non-probability sampling. Probability
sampling consist of simple random sampling, stratified sampling, cluster sampling and
systematic sampling. Non-probability sampling can be snowball sampling, quota sampling and
judgement sampling (Goodwin and Wright, 2014). The survey methodologies can be interviews,
questionnaires and focus groups. The qualitative and quantitative assessment needs to be done.
Social media- It is one of the best tool of data collection. The social media presence is
increasing day by day. Thus, presence in social media can help out to know customers
willingness. They can suggest what products will satisfy them most. It also give various
viewpoints and opinions.
Interviews- Interviews can be done face-to-face or telephonic. Murano can interviewed
their internal as well as external customers to better gather the data. They can also get feedback
from customers while greeting them and asking questions about the delivery of services.
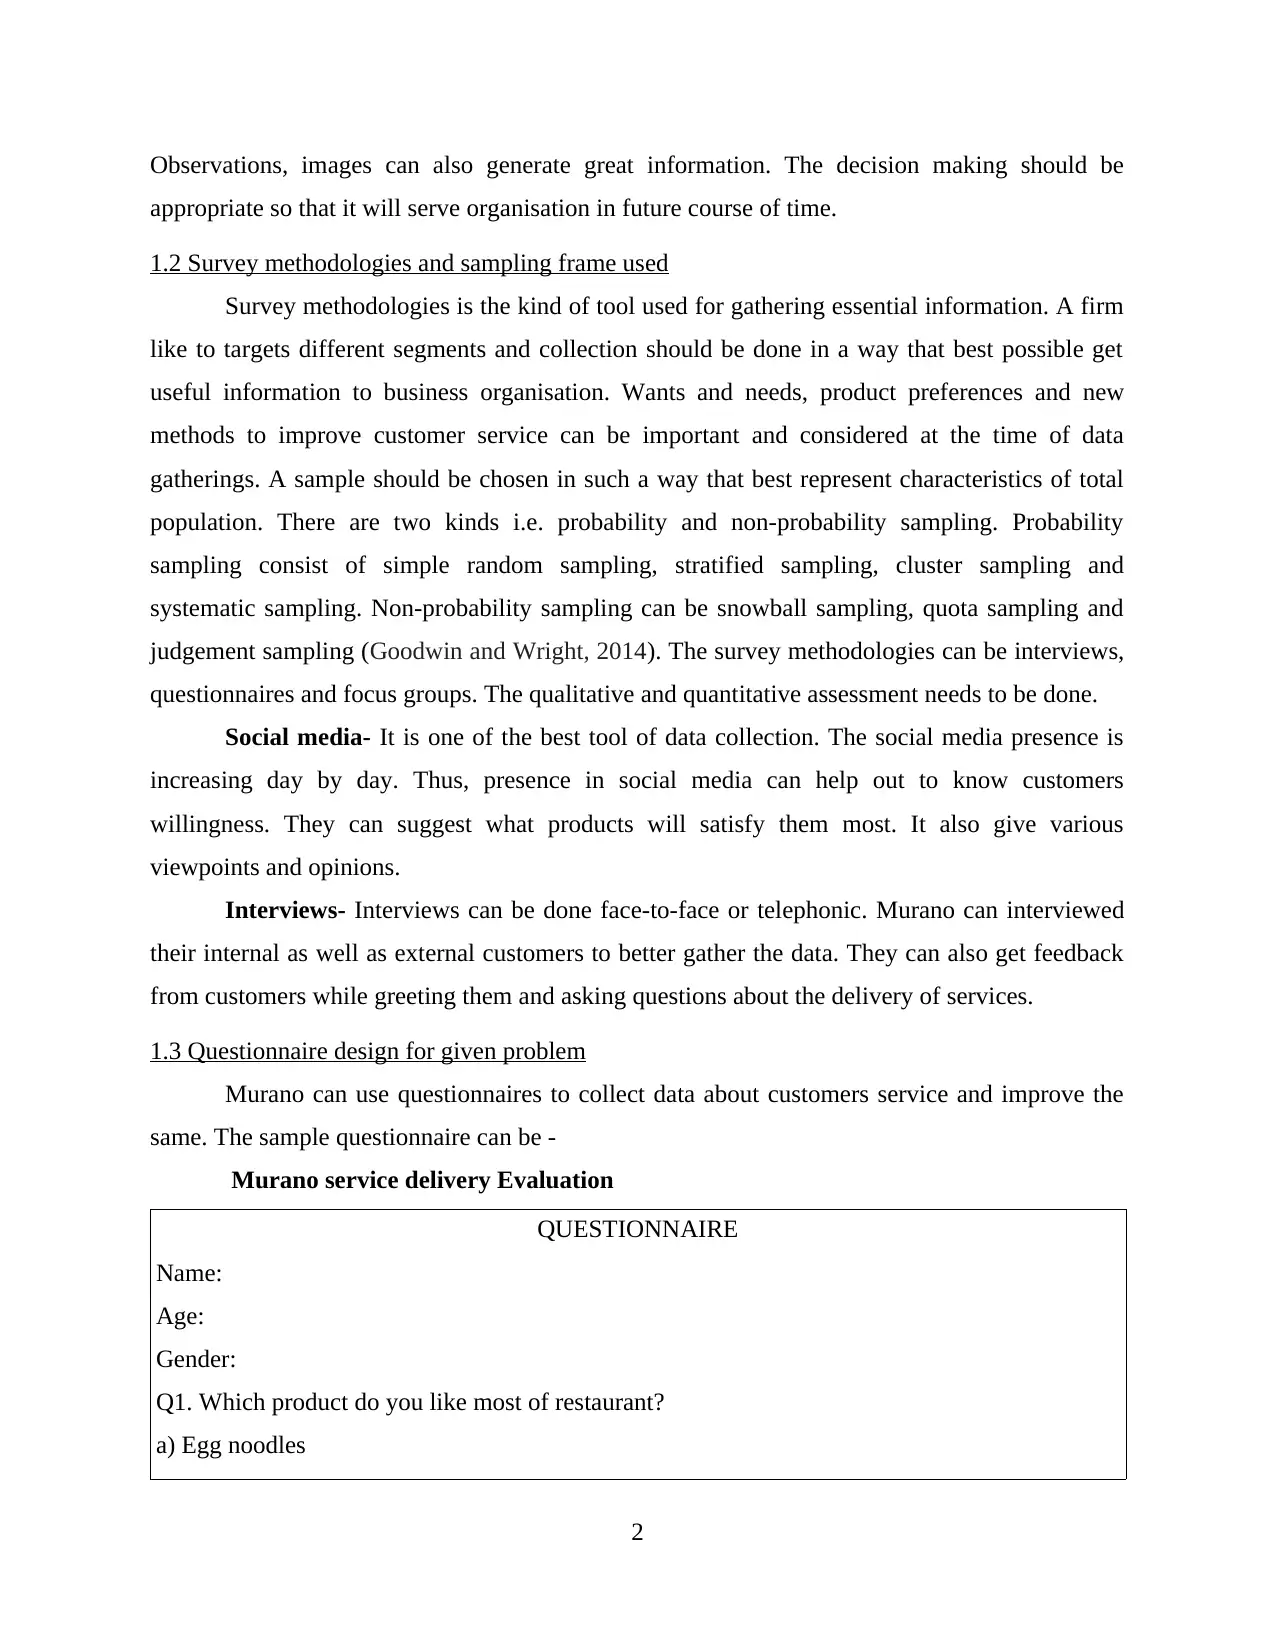
1.3 Questionnaire design for given problem
Murano can use questionnaires to collect data about customers service and improve the
same. The sample questionnaire can be -
Murano service delivery Evaluation
QUESTIONNAIRE
Name:
Age:
Gender:
Q1. Which product do you like most of restaurant?
a) Egg noodles
2
appropriate so that it will serve organisation in future course of time.
1.2 Survey methodologies and sampling frame used
Survey methodologies is the kind of tool used for gathering essential information. A firm
like to targets different segments and collection should be done in a way that best possible get
useful information to business organisation. Wants and needs, product preferences and new
methods to improve customer service can be important and considered at the time of data
gatherings. A sample should be chosen in such a way that best represent characteristics of total
population. There are two kinds i.e. probability and non-probability sampling. Probability
sampling consist of simple random sampling, stratified sampling, cluster sampling and
systematic sampling. Non-probability sampling can be snowball sampling, quota sampling and
judgement sampling (Goodwin and Wright, 2014). The survey methodologies can be interviews,
questionnaires and focus groups. The qualitative and quantitative assessment needs to be done.
Social media- It is one of the best tool of data collection. The social media presence is
increasing day by day. Thus, presence in social media can help out to know customers
willingness. They can suggest what products will satisfy them most. It also give various
viewpoints and opinions.
Interviews- Interviews can be done face-to-face or telephonic. Murano can interviewed
their internal as well as external customers to better gather the data. They can also get feedback
from customers while greeting them and asking questions about the delivery of services.
1.3 Questionnaire design for given problem
Murano can use questionnaires to collect data about customers service and improve the
same. The sample questionnaire can be -
Murano service delivery Evaluation
QUESTIONNAIRE
Name:
Age:
Gender:
Q1. Which product do you like most of restaurant?
a) Egg noodles
2
b) Dried egg
c) Chicken
d) Meet
Q2. Which is the most competitive rivalry for restaurant?
a) Blackfriars Restaurant
b) Balti Palace
Q3. Which price group you belong to ?
a) More than 25 dollar
b) More than 50 Dollar
c) More than 100 dollar
Q4. How is the customer service in restaurant?
a) Good
b) Average
c) poor
Q5. Which location can be most preferable?
a) Seaside
b) Rooftop
Q6. Does the services provided by staff are up to mark
a)Yes
b)No
Q7. Does the environment of restaurant is good enough
a)Yes
b)No
Q8. Does the quality of food is appropriate
a)Best
b)average
c)Poor
Q9. Which thing attract the most to customers
a) Environment
b) Service
3
⊘ This is a preview!⊘
Do you want full access?
Subscribe today to unlock all pages.
Trusted by 1+ million students worldwide
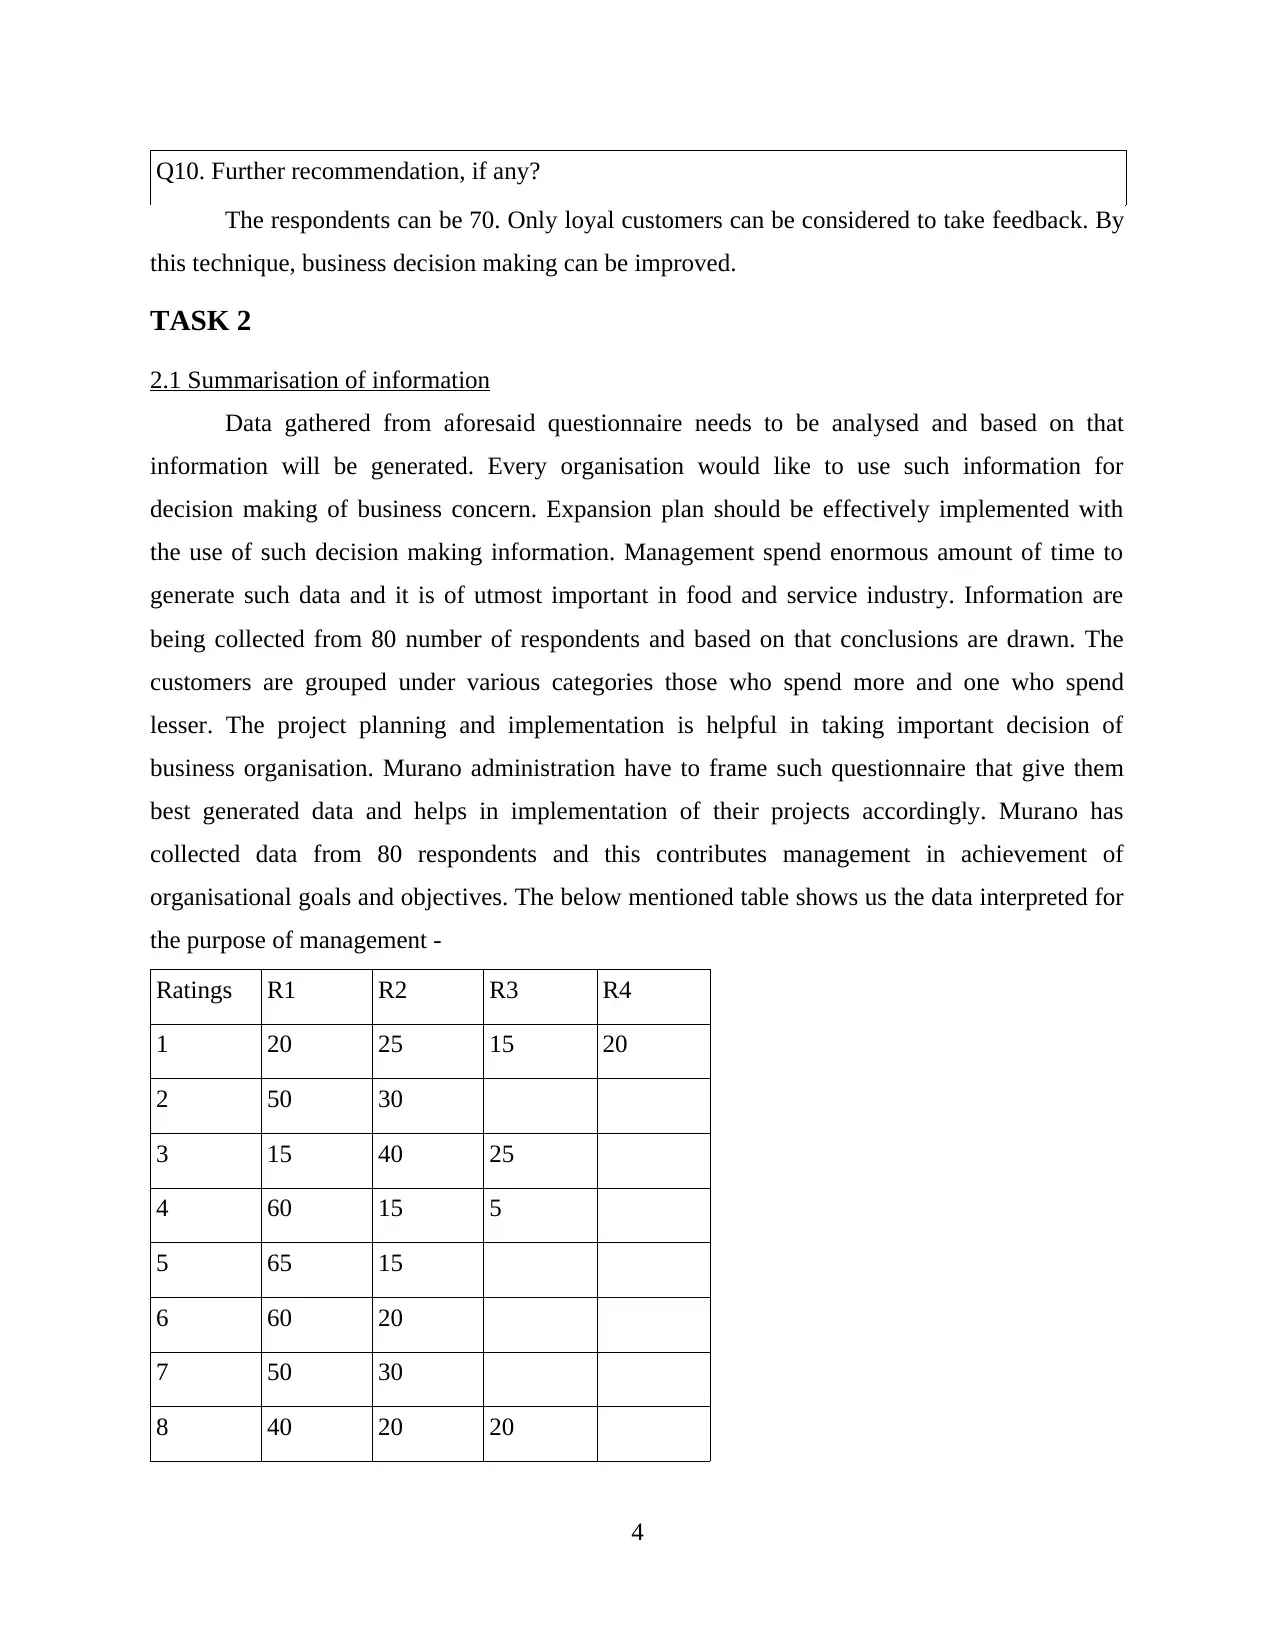
Q10. Further recommendation, if any?
The respondents can be 70. Only loyal customers can be considered to take feedback. By
this technique, business decision making can be improved.
TASK 2
2.1 Summarisation of information
Data gathered from aforesaid questionnaire needs to be analysed and based on that
information will be generated. Every organisation would like to use such information for
decision making of business concern. Expansion plan should be effectively implemented with
the use of such decision making information. Management spend enormous amount of time to
generate such data and it is of utmost important in food and service industry. Information are
being collected from 80 number of respondents and based on that conclusions are drawn. The
customers are grouped under various categories those who spend more and one who spend
lesser. The project planning and implementation is helpful in taking important decision of
business organisation. Murano administration have to frame such questionnaire that give them
best generated data and helps in implementation of their projects accordingly. Murano has
collected data from 80 respondents and this contributes management in achievement of
organisational goals and objectives. The below mentioned table shows us the data interpreted for
the purpose of management -
Ratings R1 R2 R3 R4
1 20 25 15 20
2 50 30
3 15 40 25
4 60 15 5
5 65 15
6 60 20
7 50 30
8 40 20 20
4
Paraphrase This Document
Need a fresh take? Get an instant paraphrase of this document with our AI Paraphraser
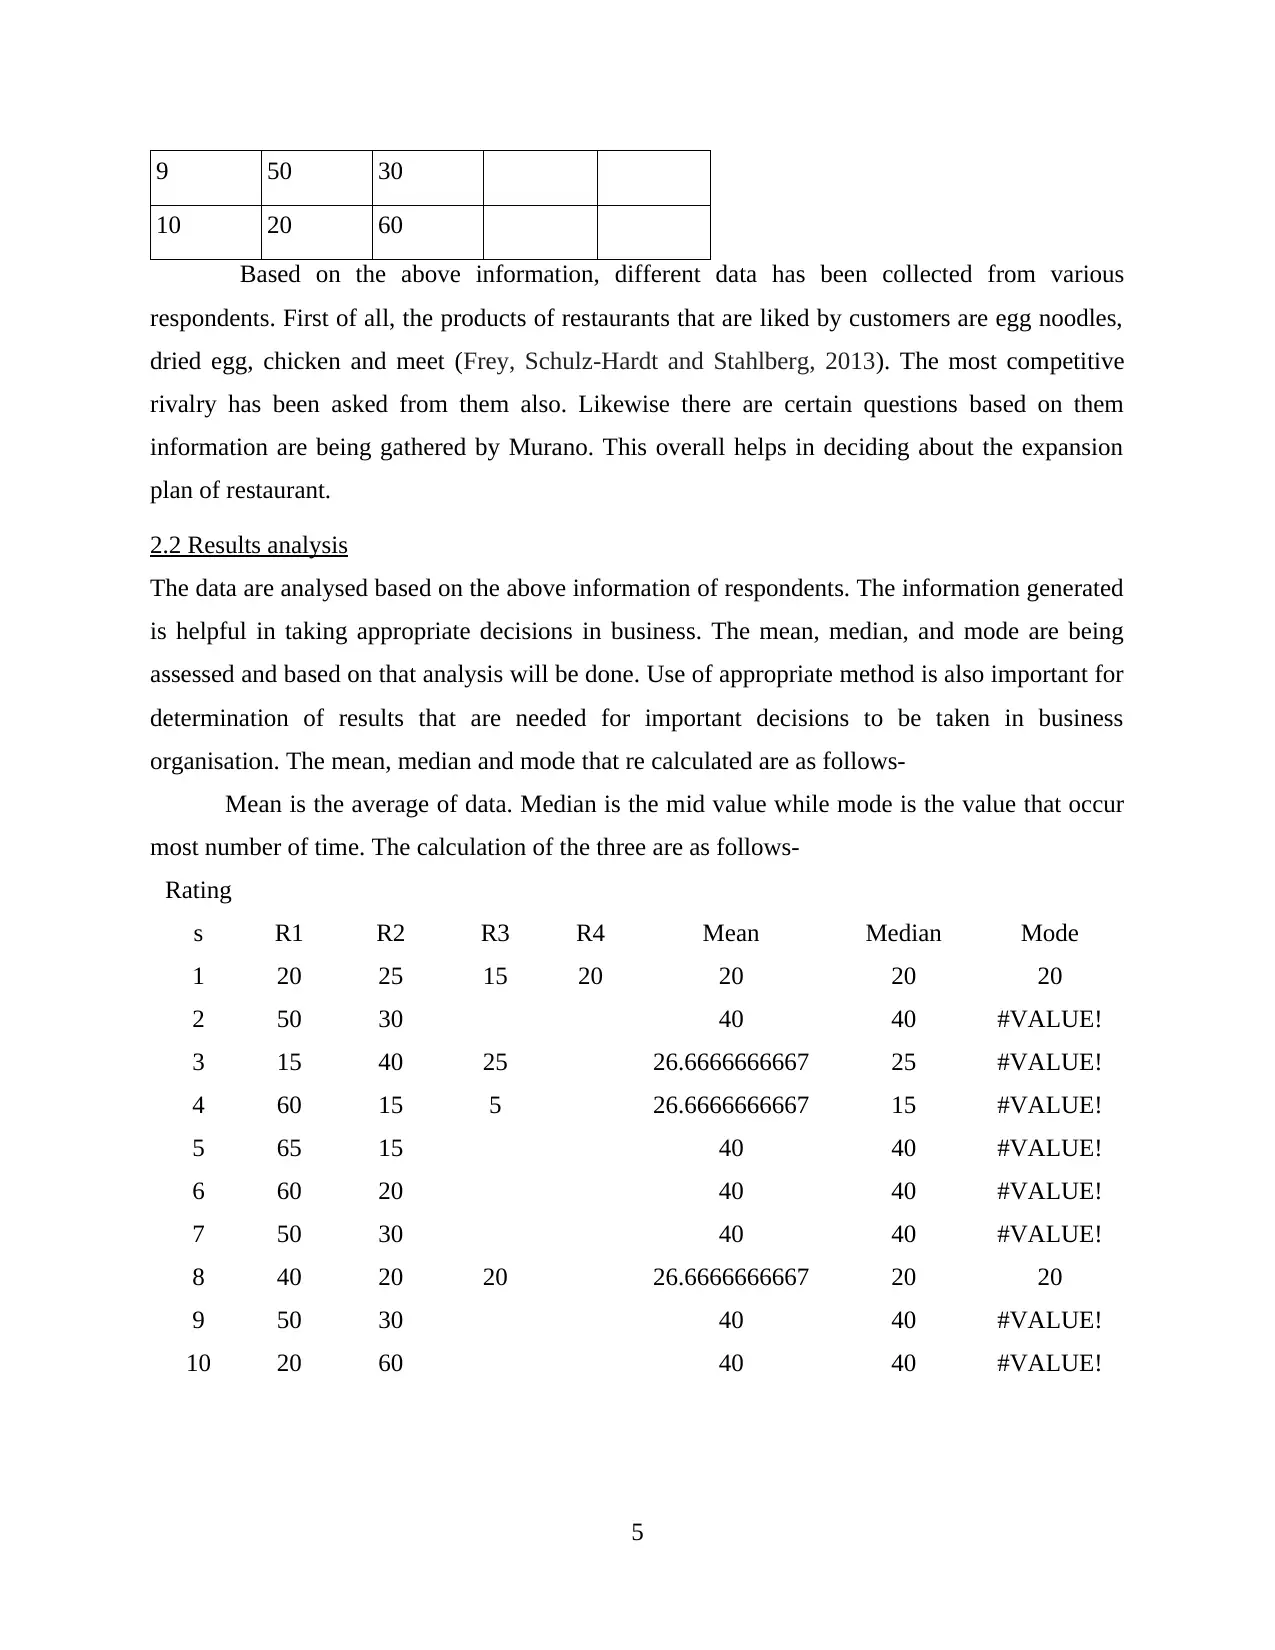
9 50 30
10 20 60
Based on the above information, different data has been collected from various
respondents. First of all, the products of restaurants that are liked by customers are egg noodles,
dried egg, chicken and meet (Frey, Schulz-Hardt and Stahlberg, 2013). The most competitive
rivalry has been asked from them also. Likewise there are certain questions based on them
information are being gathered by Murano. This overall helps in deciding about the expansion
plan of restaurant.
2.2 Results analysis
The data are analysed based on the above information of respondents. The information generated
is helpful in taking appropriate decisions in business. The mean, median, and mode are being
assessed and based on that analysis will be done. Use of appropriate method is also important for
determination of results that are needed for important decisions to be taken in business
organisation. The mean, median and mode that re calculated are as follows-
Mean is the average of data. Median is the mid value while mode is the value that occur
most number of time. The calculation of the three are as follows-
Rating
s R1 R2 R3 R4 Mean Median Mode
1 20 25 15 20 20 20 20
2 50 30 40 40 #VALUE!
3 15 40 25 26.6666666667 25 #VALUE!
4 60 15 5 26.6666666667 15 #VALUE!
5 65 15 40 40 #VALUE!
6 60 20 40 40 #VALUE!
7 50 30 40 40 #VALUE!
8 40 20 20 26.6666666667 20 20
9 50 30 40 40 #VALUE!
10 20 60 40 40 #VALUE!
5
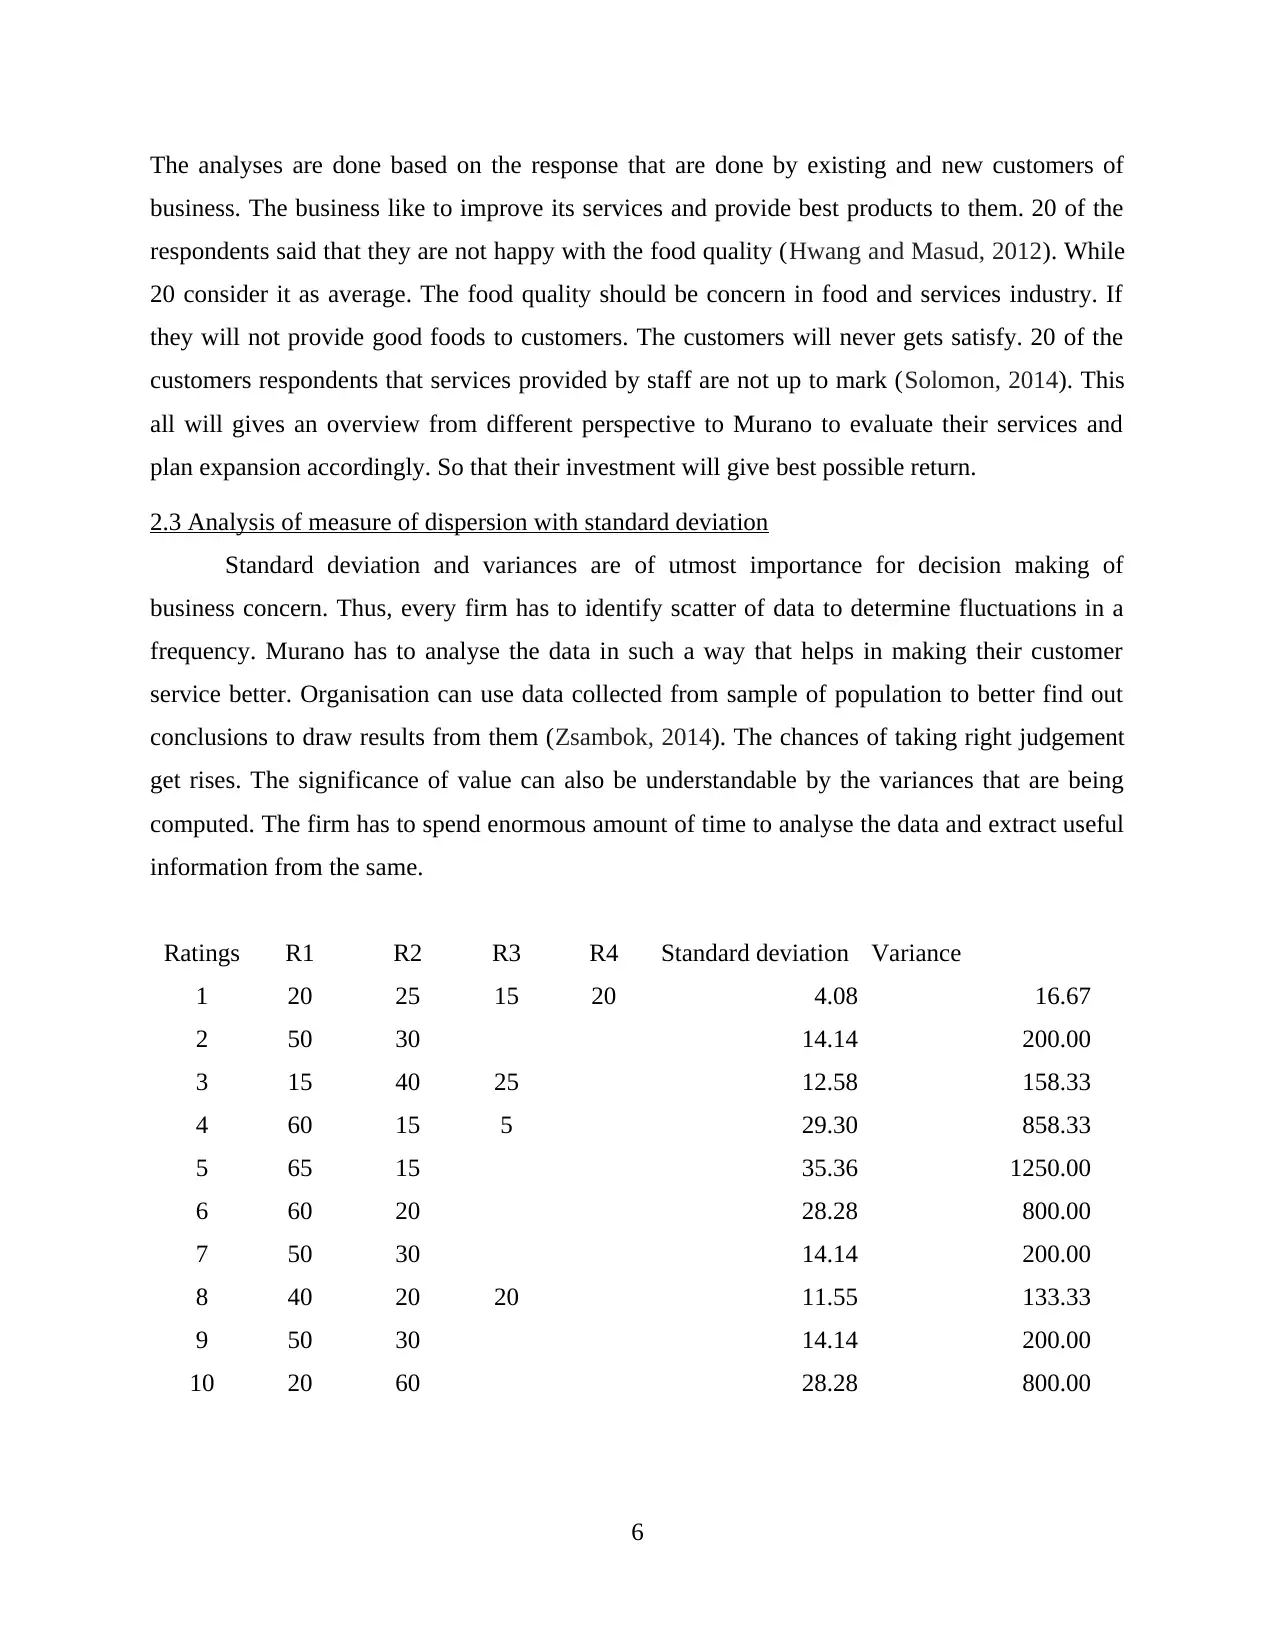
The analyses are done based on the response that are done by existing and new customers of
business. The business like to improve its services and provide best products to them. 20 of the
respondents said that they are not happy with the food quality (Hwang and Masud, 2012). While
20 consider it as average. The food quality should be concern in food and services industry. If
they will not provide good foods to customers. The customers will never gets satisfy. 20 of the
customers respondents that services provided by staff are not up to mark (Solomon, 2014). This
all will gives an overview from different perspective to Murano to evaluate their services and
plan expansion accordingly. So that their investment will give best possible return.
2.3 Analysis of measure of dispersion with standard deviation
Standard deviation and variances are of utmost importance for decision making of
business concern. Thus, every firm has to identify scatter of data to determine fluctuations in a
frequency. Murano has to analyse the data in such a way that helps in making their customer
service better. Organisation can use data collected from sample of population to better find out
conclusions to draw results from them (Zsambok, 2014). The chances of taking right judgement
get rises. The significance of value can also be understandable by the variances that are being
computed. The firm has to spend enormous amount of time to analyse the data and extract useful
information from the same.
Ratings R1 R2 R3 R4 Standard deviation Variance
1 20 25 15 20 4.08 16.67
2 50 30 14.14 200.00
3 15 40 25 12.58 158.33
4 60 15 5 29.30 858.33
5 65 15 35.36 1250.00
6 60 20 28.28 800.00
7 50 30 14.14 200.00
8 40 20 20 11.55 133.33
9 50 30 14.14 200.00
10 20 60 28.28 800.00
6
⊘ This is a preview!⊘
Do you want full access?
Subscribe today to unlock all pages.
Trusted by 1+ million students worldwide
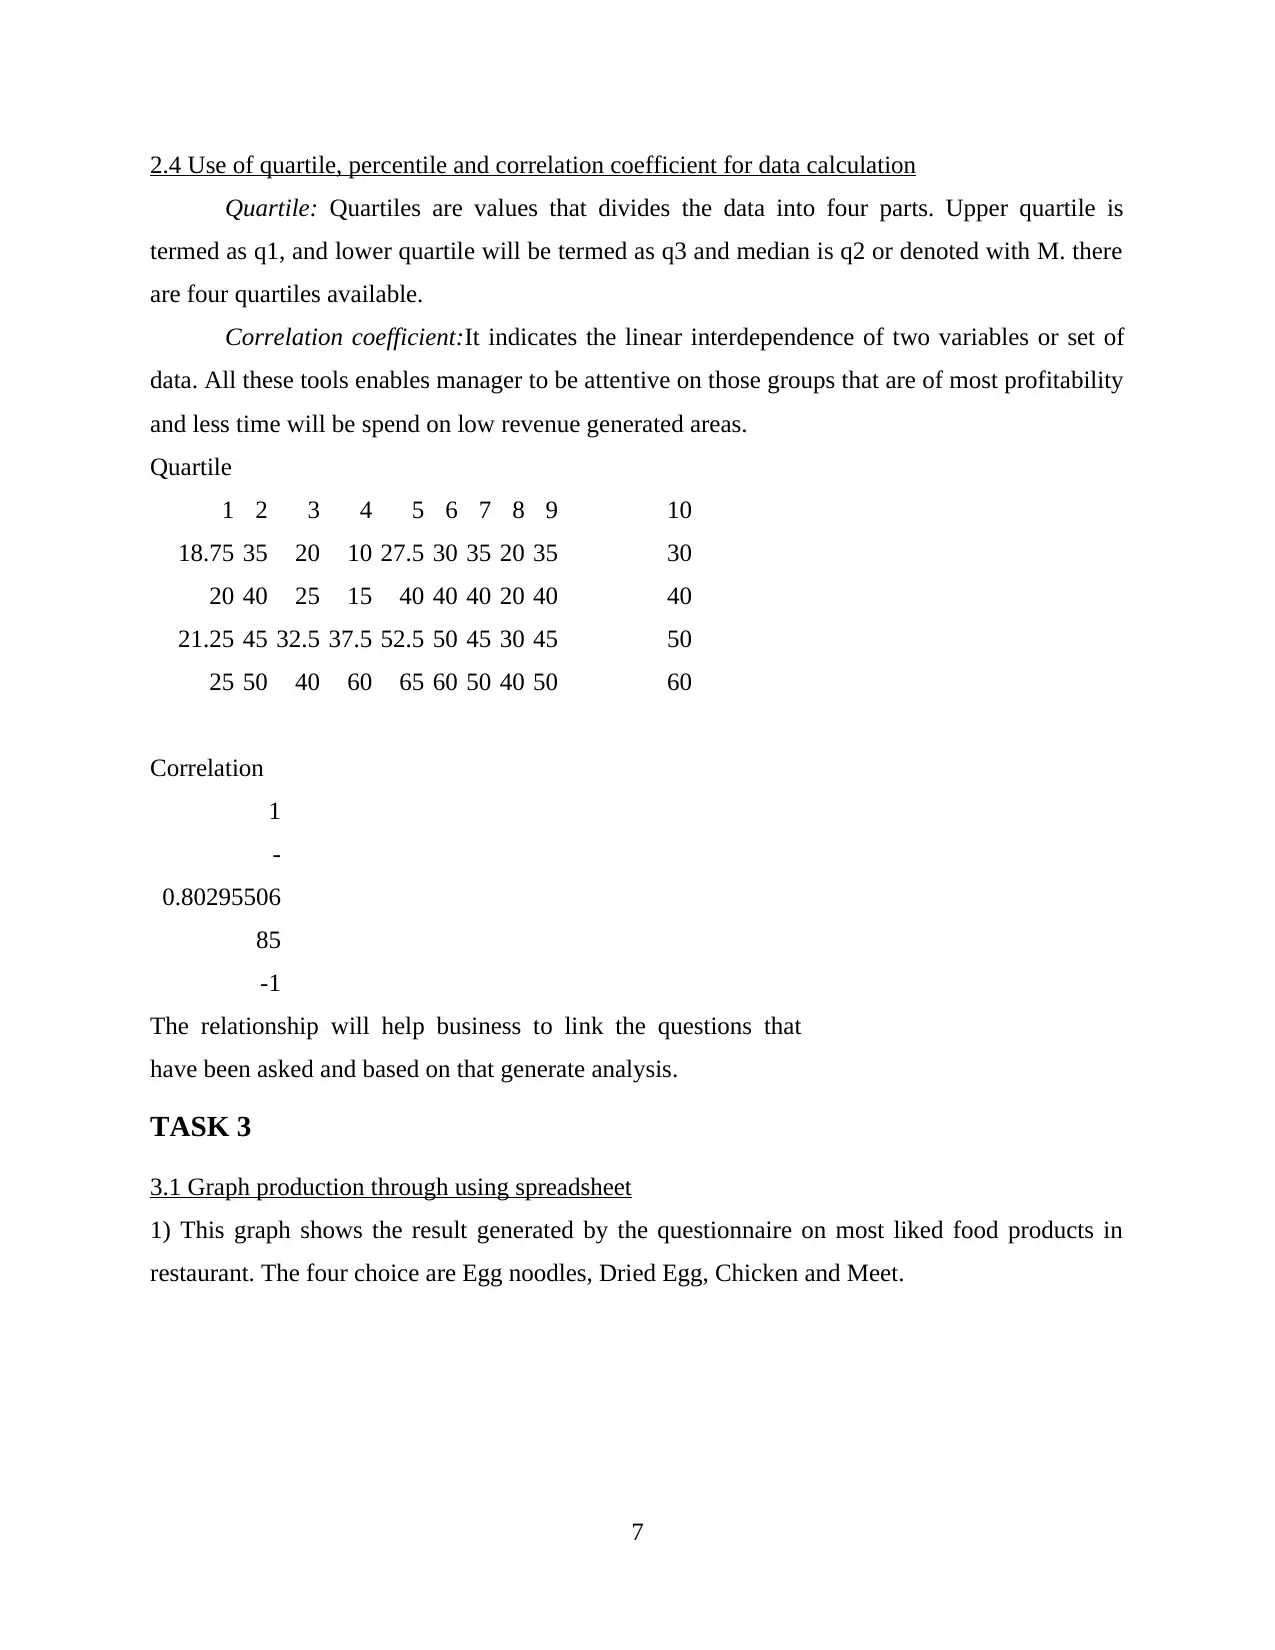
2.4 Use of quartile, percentile and correlation coefficient for data calculation
Quartile: Quartiles are values that divides the data into four parts. Upper quartile is
termed as q1, and lower quartile will be termed as q3 and median is q2 or denoted with M. there
are four quartiles available.
Correlation coefficient:It indicates the linear interdependence of two variables or set of
data. All these tools enables manager to be attentive on those groups that are of most profitability
and less time will be spend on low revenue generated areas.
Quartile
1 2 3 4 5 6 7 8 9 10
18.75 35 20 10 27.5 30 35 20 35 30
20 40 25 15 40 40 40 20 40 40
21.25 45 32.5 37.5 52.5 50 45 30 45 50
25 50 40 60 65 60 50 40 50 60
Correlation
1
-
0.80295506
85
-1
The relationship will help business to link the questions that
have been asked and based on that generate analysis.
TASK 3
3.1 Graph production through using spreadsheet
1) This graph shows the result generated by the questionnaire on most liked food products in
restaurant. The four choice are Egg noodles, Dried Egg, Chicken and Meet.
7
Paraphrase This Document
Need a fresh take? Get an instant paraphrase of this document with our AI Paraphraser
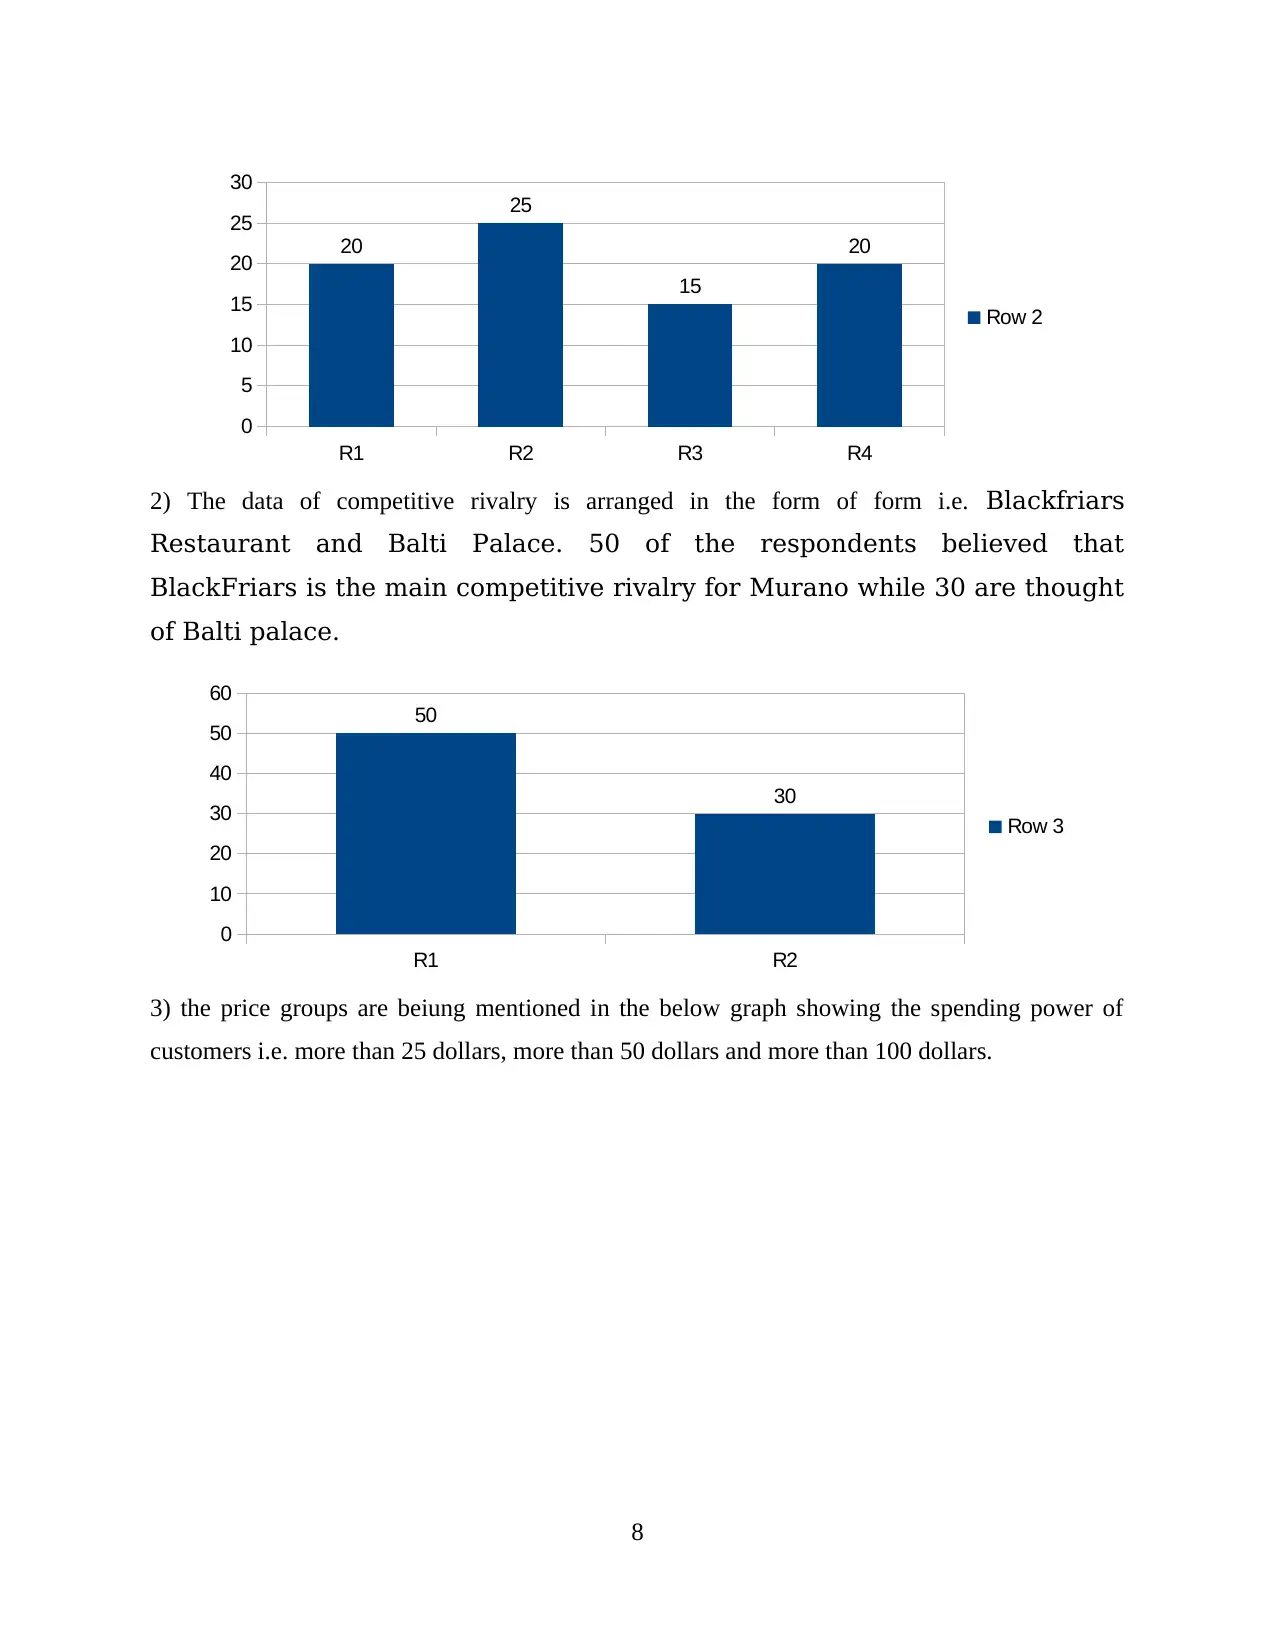
2) The data of competitive rivalry is arranged in the form of form i.e. Blackfriars
Restaurant and Balti Palace. 50 of the respondents believed that
BlackFriars is the main competitive rivalry for Murano while 30 are thought
of Balti palace.
3) the price groups are beiung mentioned in the below graph showing the spending power of
customers i.e. more than 25 dollars, more than 50 dollars and more than 100 dollars.
8
R1 R2 R3 R4
0
5
10
15
20
25
30
20
25
15
20
Row 2
R1 R2
0
10
20
30
40
50
60
50
30
Row 3
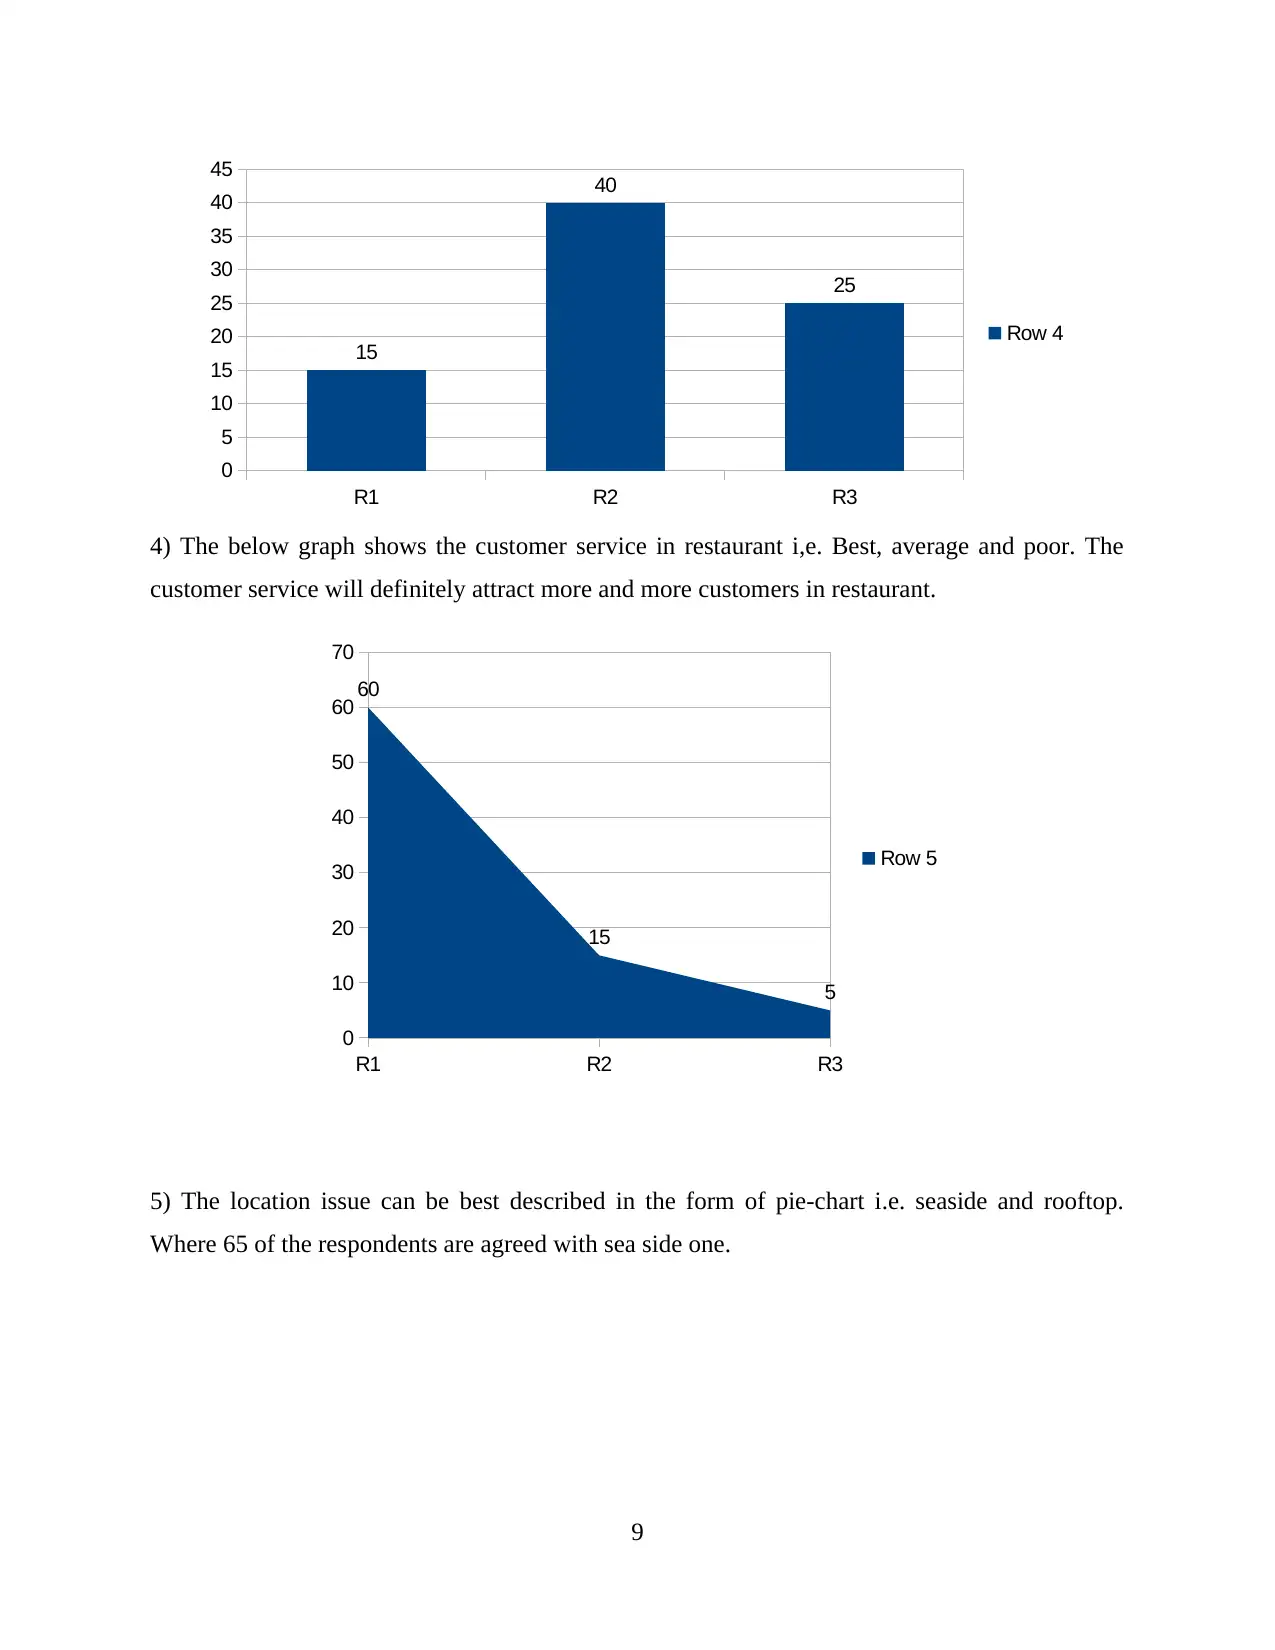
4) The below graph shows the customer service in restaurant i,e. Best, average and poor. The
customer service will definitely attract more and more customers in restaurant.
5) The location issue can be best described in the form of pie-chart i.e. seaside and rooftop.
Where 65 of the respondents are agreed with sea side one.
9
R1 R2 R3
0
5
10
15
20
25
30
35
40
45
15
40
25
Row 4
R1 R2 R3
0
10
20
30
40
50
60
70
60
15
5
Row 5
⊘ This is a preview!⊘
Do you want full access?
Subscribe today to unlock all pages.
Trusted by 1+ million students worldwide
1 out of 21
Related Documents


Your All-in-One AI-Powered Toolkit for Academic Success.
+13062052269
info@desklib.com
Available 24*7 on WhatsApp / Email
![[object Object]](/_next/static/media/star-bottom.7253800d.svg)
Unlock your academic potential
Copyright © 2020–2026 A2Z Services. All Rights Reserved. Developed and managed by ZUCOL.