Business Decision Making Report: Analyzing Tour Product Decisions
VerifiedAdded on 2020/02/05
|19
|4230
|235
Report
AI Summary
This report analyzes the business decision-making process for TUI Travels, a UK-based tour operator, focusing on the development of a new tour product. The report utilizes both primary and secondary data sources, including surveys and past sales records, to understand customer preferences and attitudes. It details the survey methodology, including sampling techniques and questionnaire design. The analysis incorporates various statistical tools, such as mean, median, standard deviation, quartiles, percentiles, and correlation coefficients, to summarize and interpret the collected data. The report also includes the use of graphs, charts, and trend lines to visualize sales data and predict future trends. Additionally, it covers the creation of a formal business report and the application of information processing and financial tools for project planning and decision-making. The analysis aims to provide insights into customer behavior and guide TUI Travels in making informed decisions about new tour destinations and product offerings.

BUSINESS DECISION MAKING
1
1
Paraphrase This Document
Need a fresh take? Get an instant paraphrase of this document with our AI Paraphraser
Table of Contents
INTRODUCTION...........................................................................................................................3
TASK 1............................................................................................................................................3
1.1 Source of primary and secondary data for the development of new tour product.................3
1.2 Present the survey methodology with an appropriate sampling frame:.................................4
1.3 Questionnaire:........................................................................................................................4
TASK 2............................................................................................................................................6
2.1 Creating information for decision making by summarizing data..........................................6
2.2 Analyze the range of results:.................................................................................................7
2.3 Analyzing data using measures of Dispersion:......................................................................7
2.4 Analyzing the quartiles, percentiles and correlation coefficient:..........................................8
TASK 3............................................................................................................................................9
3.1 Graphs and charts...................................................................................................................9
3.2 Creating a trend line:............................................................................................................11
3.3 Presentation..........................................................................................................................12
3.4 Formal business report.........................................................................................................12
TASK 4..........................................................................................................................................13
4.1 Information processing tools:..............................................................................................13
4.2 Preparing a project plan:......................................................................................................14
4.3 Using financial tools:...........................................................................................................16
REFERENCES:.............................................................................................................................18
2
INTRODUCTION
Decision making is considered to be very useful for a business. Decision making leads to
the prosperity and success of the business. Decision making has always be an important part of
business and good decisions always leads to good and successful business. Problems should be
identified, assessed and evaluated to make a quality decision. Choosing among different
alternatives and analysing the selected alternative is the main aim of a decision maker to make a
business successful. In this report, a tour operator of UK has been selected “TUI Travels” tour
operator who is organizing tour in various countries. This study aims at identifying the attitude
and perception of the customers regarding the launching of tour operations at a new destination
by using some survey methods and statistical tools and techniques. These tools and techniques
are used to analyze the preferences of customers.
TASK 1
1.1 Source of primary and secondary data for the development of new tour product
Primary sources:
Primary sources are the first hand data collected by the the researcher. Primary data can
be obtained by the researcher using survey methods, questionnaires, observation or by interview
methods. In this study, TUI Travels is using both primary as well as secondary data to analyze
the customer preferences as well as attitude regarding the new product launch i.e planning new
destination for the tour. Primary sources mainly includes survey methods or questionnaire
method which must be filled by the prospective customers. Customers fill the questionnaires and
according to their perception tour operator plans exotic and customized destinations (Alexakos
and et.al., 2016.)
Secondary sources:
secondary sources can be defined as the data collected originally by someone else and not
by the user. This data source is considered as the second hand data as it has already been
collected. Secondary data can be collected by using past records, magazines, referrals, business
journals, census methods, internet etc. in the current research, tour operator can collect secondary
data by referring past sales records that is used to analyze what customers prefer, what are their
3
⊘ This is a preview!⊘
Do you want full access?
Subscribe today to unlock all pages.
Trusted by 1+ million students worldwide
needs and wants, what is their attitude towards trying a new destination etc. Tour operators
should select the location according to the age group of the customers who are willing to visit.
Competitor products must be taken into consideration before selecting and launching a new
product (Popovič and et.al., 2012)
1.2 Present the survey methodology with an appropriate sampling frame:
Survey Methodology:
To assess the customers attitudes survey must be done by the tour operator on the basis of which
destination can be launched. After all, for any tour operating agency, customized product must
be the main aim. Questionnaires must be considered as the main instrument for analyzing the
customer perception towards new tour product. Various e-questionnaire, online questionnaires
can be used to survey for the new product launch. Sampling strategies must be used to make a
survey of the customers (Neuman and Robson, 2012)
Sampling:
sampling can be defined as a statistical tool or a technique to determine the characteristics of
some elements based on a larger population. Sampling technique is mainly used by the tour
operator because as TUI Travels is a diverse tour agency operating in UK so it becomes very
difficult for them to make a survey of large number of customers. Therefore, sampling technique
is used so that on the basis of some elements, attitude or preferences of the whole population can
be determined (Baum and Crosby, 2014)
Quantitative data is to be used by the tour operator as quantitative data refers to
measuring facts, figures and numbers. In the present study, tour operator must consider
quantitative data as they must ask to the customers about the prices they are ready to pay for the
new tour product launch. Price decision must be taken by the tour operator before launching any
new product. It may also include qualitative data as questionnaire method is used and
qualitative data is concerned with the human behavior and attitudes. This factor is analyzed by
the qualitative data. Therefore, tour operator can consider quantitative as well as qualitative data
for assessing the attitude of the customers.
1.3 Questionnaire:
Dear participants
4
Paraphrase This Document
Need a fresh take? Get an instant paraphrase of this document with our AI Paraphraser
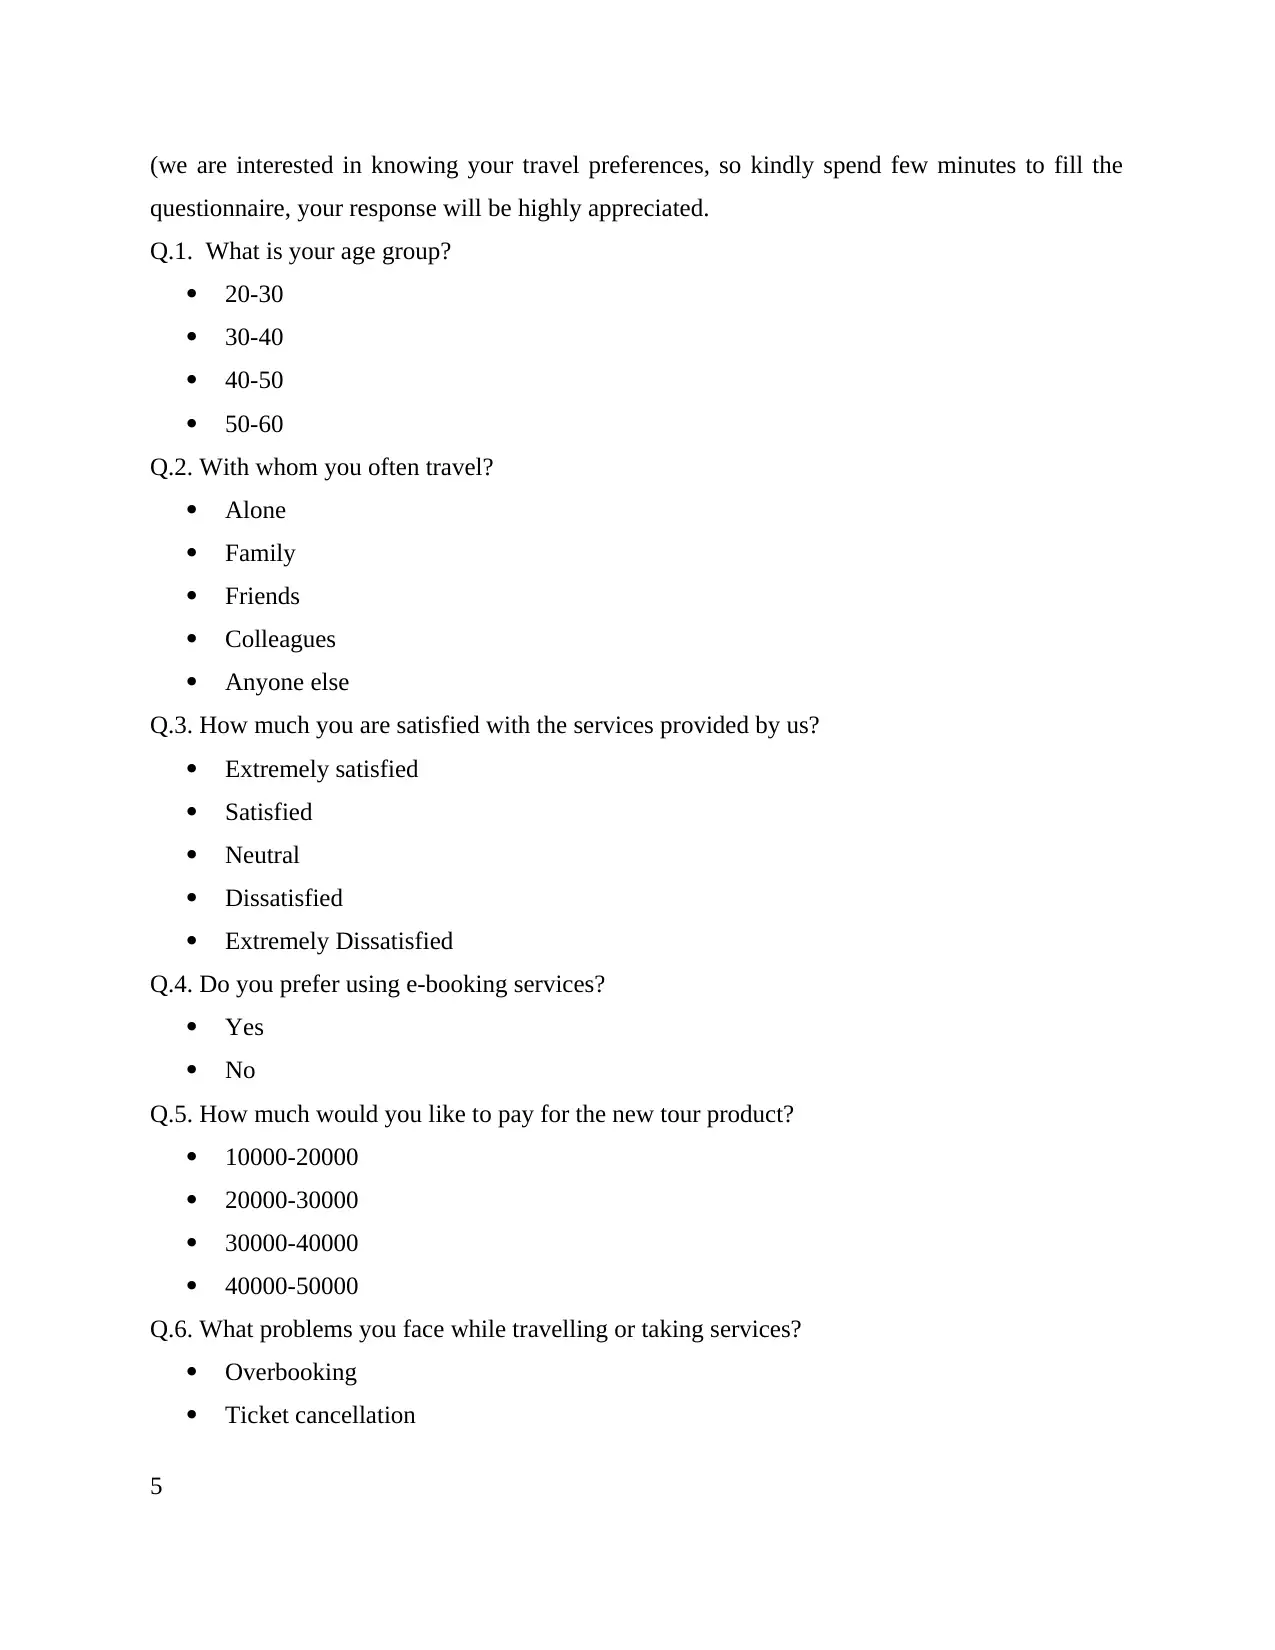
(we are interested in knowing your travel preferences, so kindly spend few minutes to fill the
questionnaire, your response will be highly appreciated.
Q.1. What is your age group?
20-30
30-40
40-50
50-60
Q.2. With whom you often travel?
Alone
Family
Friends
Colleagues
Anyone else
Q.3. How much you are satisfied with the services provided by us?
Extremely satisfied
Satisfied
Neutral
Dissatisfied
Extremely Dissatisfied
Q.4. Do you prefer using e-booking services?
Yes
No
Q.5. How much would you like to pay for the new tour product?
10000-20000
20000-30000
30000-40000
40000-50000
Q.6. What problems you face while travelling or taking services?
Overbooking
Ticket cancellation
5
Any other reason
TASK 2
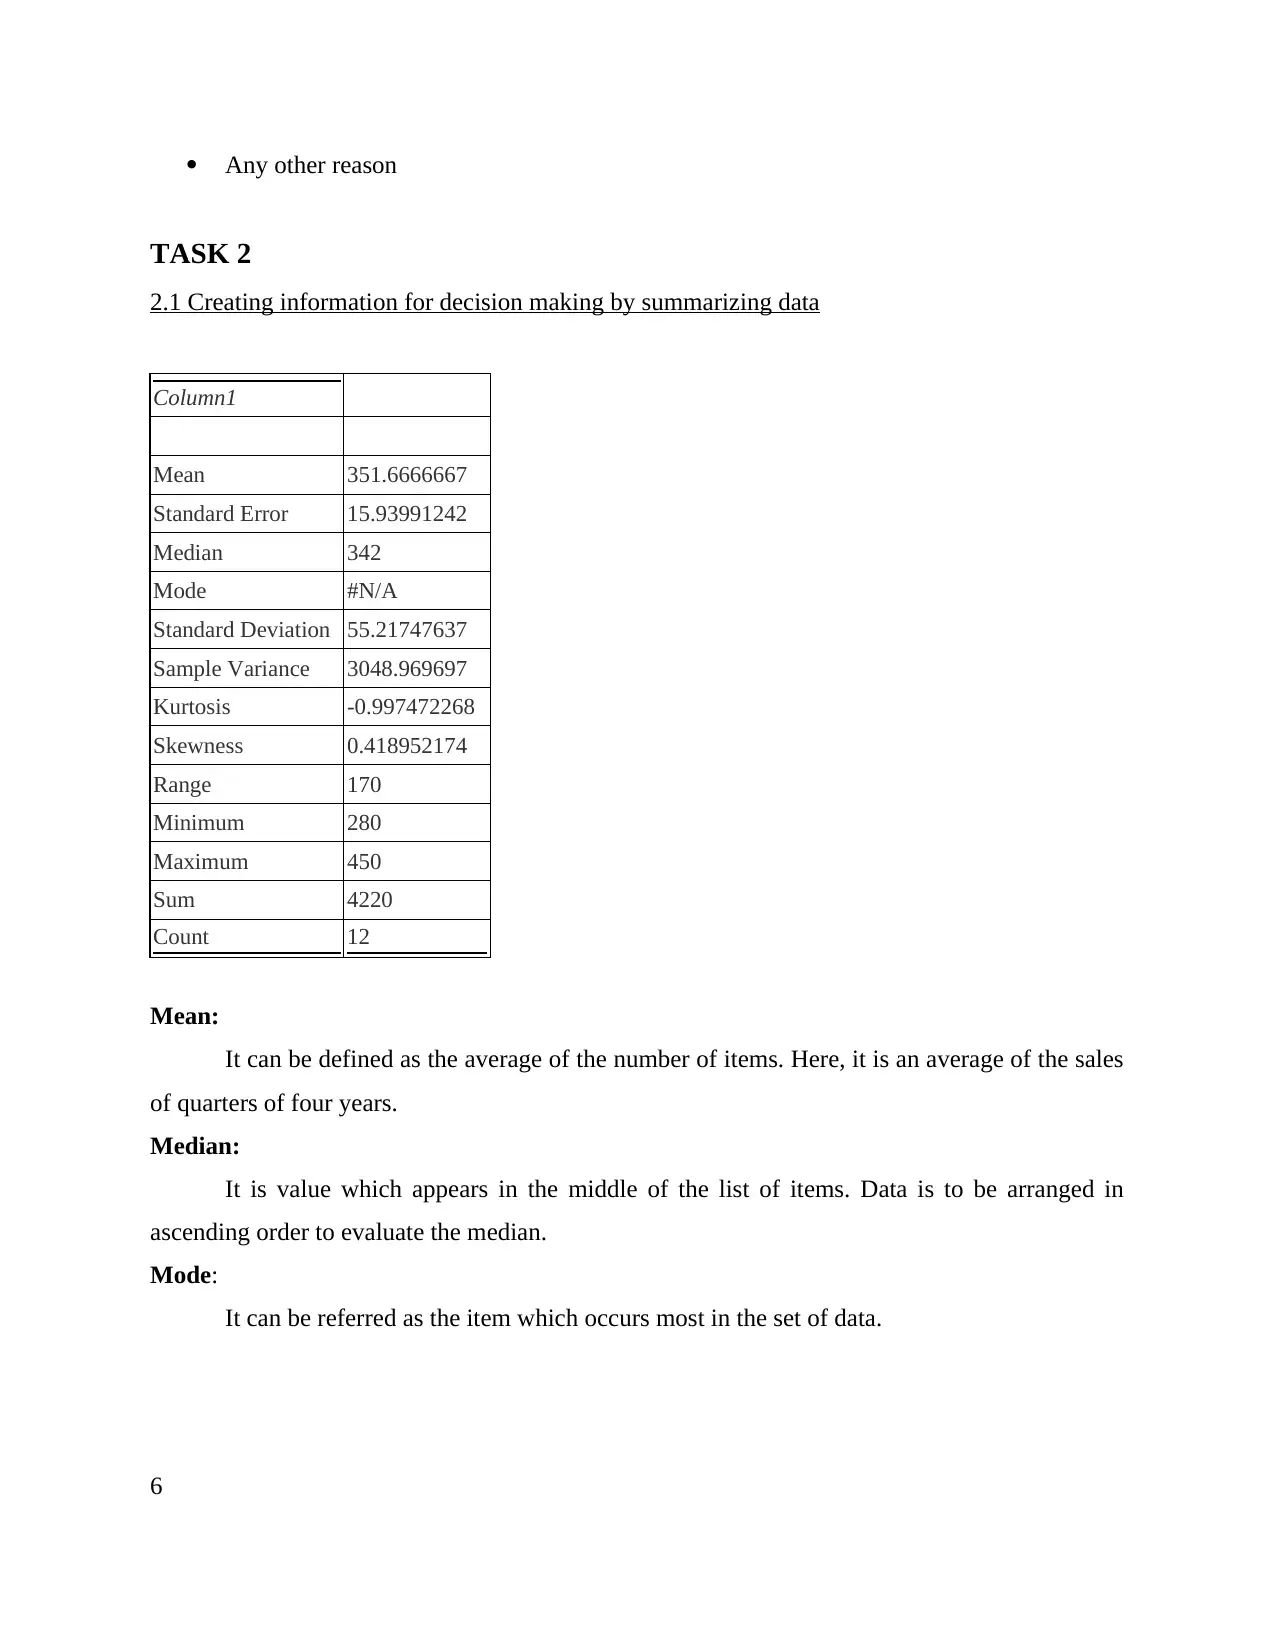
2.1 Creating information for decision making by summarizing data
Column1
Mean 351.6666667
Standard Error 15.93991242
Median 342
Mode #N/A
Standard Deviation 55.21747637
Sample Variance 3048.969697
Kurtosis -0.997472268
Skewness 0.418952174
Range 170
Minimum 280
Maximum 450
Sum 4220
Count 12
Mean:
It can be defined as the average of the number of items. Here, it is an average of the sales
of quarters of four years.
Median:
It is value which appears in the middle of the list of items. Data is to be arranged in
ascending order to evaluate the median.
Mode:
It can be referred as the item which occurs most in the set of data.
6
TASK 2
2.1 Creating information for decision making by summarizing data
Column1
Mean 351.6666667
Standard Error 15.93991242
Median 342
Mode #N/A
Standard Deviation 55.21747637
Sample Variance 3048.969697
Kurtosis -0.997472268
Skewness 0.418952174
Range 170
Minimum 280
Maximum 450
Sum 4220
Count 12
Mean:
It can be defined as the average of the number of items. Here, it is an average of the sales
of quarters of four years.
Median:
It is value which appears in the middle of the list of items. Data is to be arranged in
ascending order to evaluate the median.
Mode:
It can be referred as the item which occurs most in the set of data.
6
⊘ This is a preview!⊘
Do you want full access?
Subscribe today to unlock all pages.
Trusted by 1+ million students worldwide
2.2 Analyze the range of results:
As per the raw data collected, it can be interpreted that the average of the quarters of the
four years is 351.66. It can be evaluated from the data that mean is necessary to be calculated
that it helps the researcher to inference better information. As mean is based on all observations
so it gives accurate information about the project. It is unbiased as it includes all the elements of
data.
TUI Travels tour operating agency has a large numbers of customers that's why it is
adopting sampling technique which in turn helps the tour operator to find out mean because
mean can be calculated on finite data. As per the data, it is observed that people mostly prefer to
travel in the first quarter and not in the later quarters. Median is also evaluated and it is the
middle element of the whole data which is 342. median the central element and not at all affected
by the terminal values. It helps in assessing the overall profitability of the tour operator and also
shows the trend of the sales records.
2.3 Analyzing data using measures of Dispersion:
Decision maker also considers measures of dispersion such as range, standard deviation,
semi interquartile range.
Standard deviation:
It can be defined as the amount of variation from the set of data. It helps the analyst in
decision making as it is very less affected by the variations in the data. It is also not at all
affected by the terminal values. The higher the value of the standard deviation, the greater the
variation from the mean value.
Range:
It can be defined as the difference between the upper limit and the lower limit values. It
helps in decision making as to in which range the tour operator should operate. Thus, it specifies
the limit in which he has to work.
Interquartile range:
It is a measure of statistical variation in which data is divided in four equal parts
accordingly rank is given. This is also a decision making tool as half of the data values are
divided making it easier to make decisions.
Interpretation:
7
Paraphrase This Document
Need a fresh take? Get an instant paraphrase of this document with our AI Paraphraser
As per the statistical and quantitative measures of dispersion, it has been evaluated that standard
deviation is very much deviated from the mean value. Standard deviation is most widely used
measure of dispersion by the decision makers. Standard deviation is closely linked with the mean
and due to this, it is greatly affected by the mean values.
2.4 Analyzing the quartiles, percentiles and correlation coefficient:
Quartiles:
Whole data is divided into four equal parts and it is used in decision making as it divides the vast
data into equal parts and it is easier to make decisions.
Percentile:
Each of the 100 equal groups can be divided from the entire dataset. It also aids in decision
making as entire data is divided making it easier to make decisions.
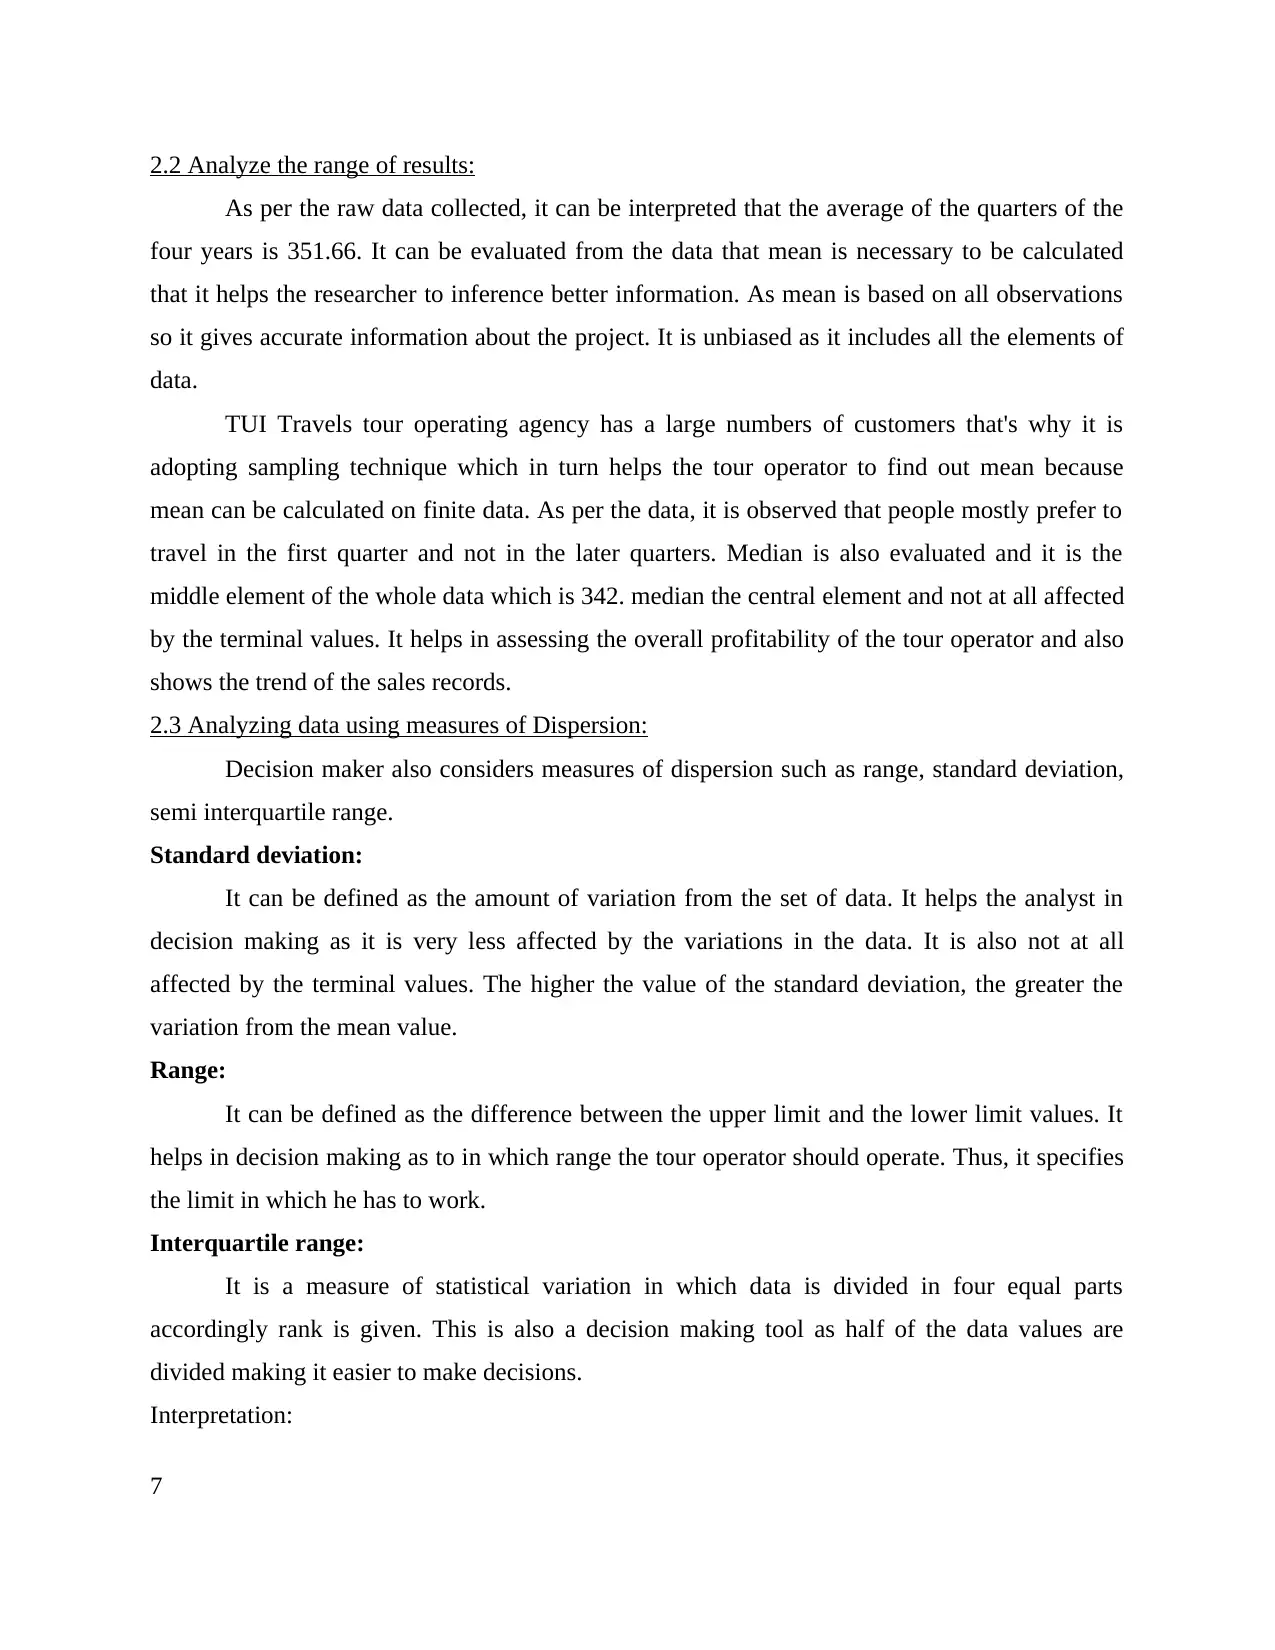
Correlation coefficient:
It can be defined as the statistical relationship between two or more variables. It always lies
between +1 and -1. It is helpful in decision making as it defines the link between the variables
which helps the decision maker to identify the tour packages and also identify the attitude and
perception of customers.
Year Revenue (In Euro Mil) Profit (In Euro Mil)
2007 20514 -890
2008 21865 236
2009 18631 -142
2010 16350 101
2011 17480 23
2012 18330 -15
2013 18478 -11
2014 18715 105
8
deviation is very much deviated from the mean value. Standard deviation is most widely used
measure of dispersion by the decision makers. Standard deviation is closely linked with the mean
and due to this, it is greatly affected by the mean values.
2.4 Analyzing the quartiles, percentiles and correlation coefficient:
Quartiles:
Whole data is divided into four equal parts and it is used in decision making as it divides the vast
data into equal parts and it is easier to make decisions.
Percentile:
Each of the 100 equal groups can be divided from the entire dataset. It also aids in decision
making as entire data is divided making it easier to make decisions.
Correlation coefficient:
It can be defined as the statistical relationship between two or more variables. It always lies
between +1 and -1. It is helpful in decision making as it defines the link between the variables
which helps the decision maker to identify the tour packages and also identify the attitude and
perception of customers.
Year Revenue (In Euro Mil) Profit (In Euro Mil)
2007 20514 -890
2008 21865 236
2009 18631 -142
2010 16350 101
2011 17480 23
2012 18330 -15
2013 18478 -11
2014 18715 105
8
2015 17516 340
2016 17184 1037
Correlation-coefficient -0.42323
Interpretation:
It can be interpreted that these factors help in making decisions as interquartile range and
percentiles help in dividing the entire data set into equal parts making it easier to analyze the
data. Correlation coefficient helps in identifying the relationship between the variable say, sales
and profit which helps in analyzing and making decisions quickly. According to the above
analysis, correlation coefficient is negative which shows that sales is adversely related to the
profitability.
TASK 3
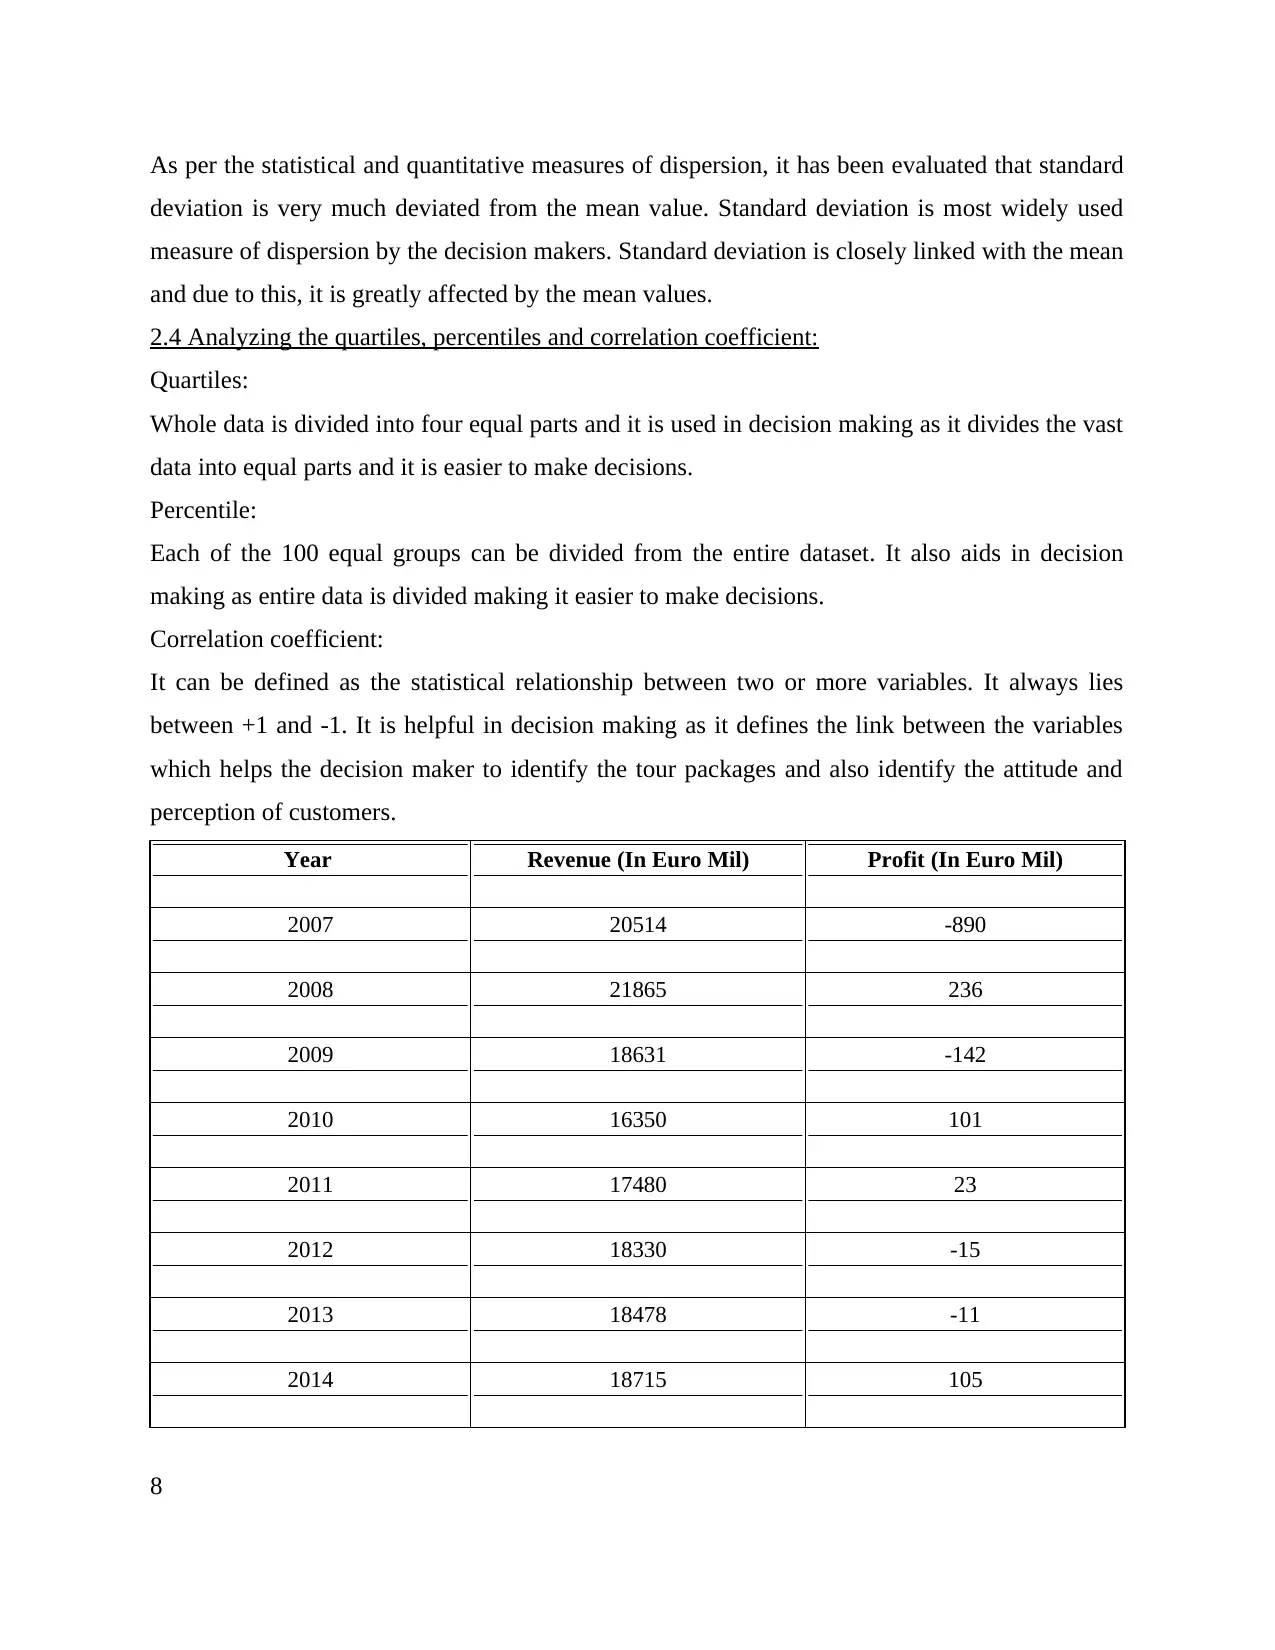
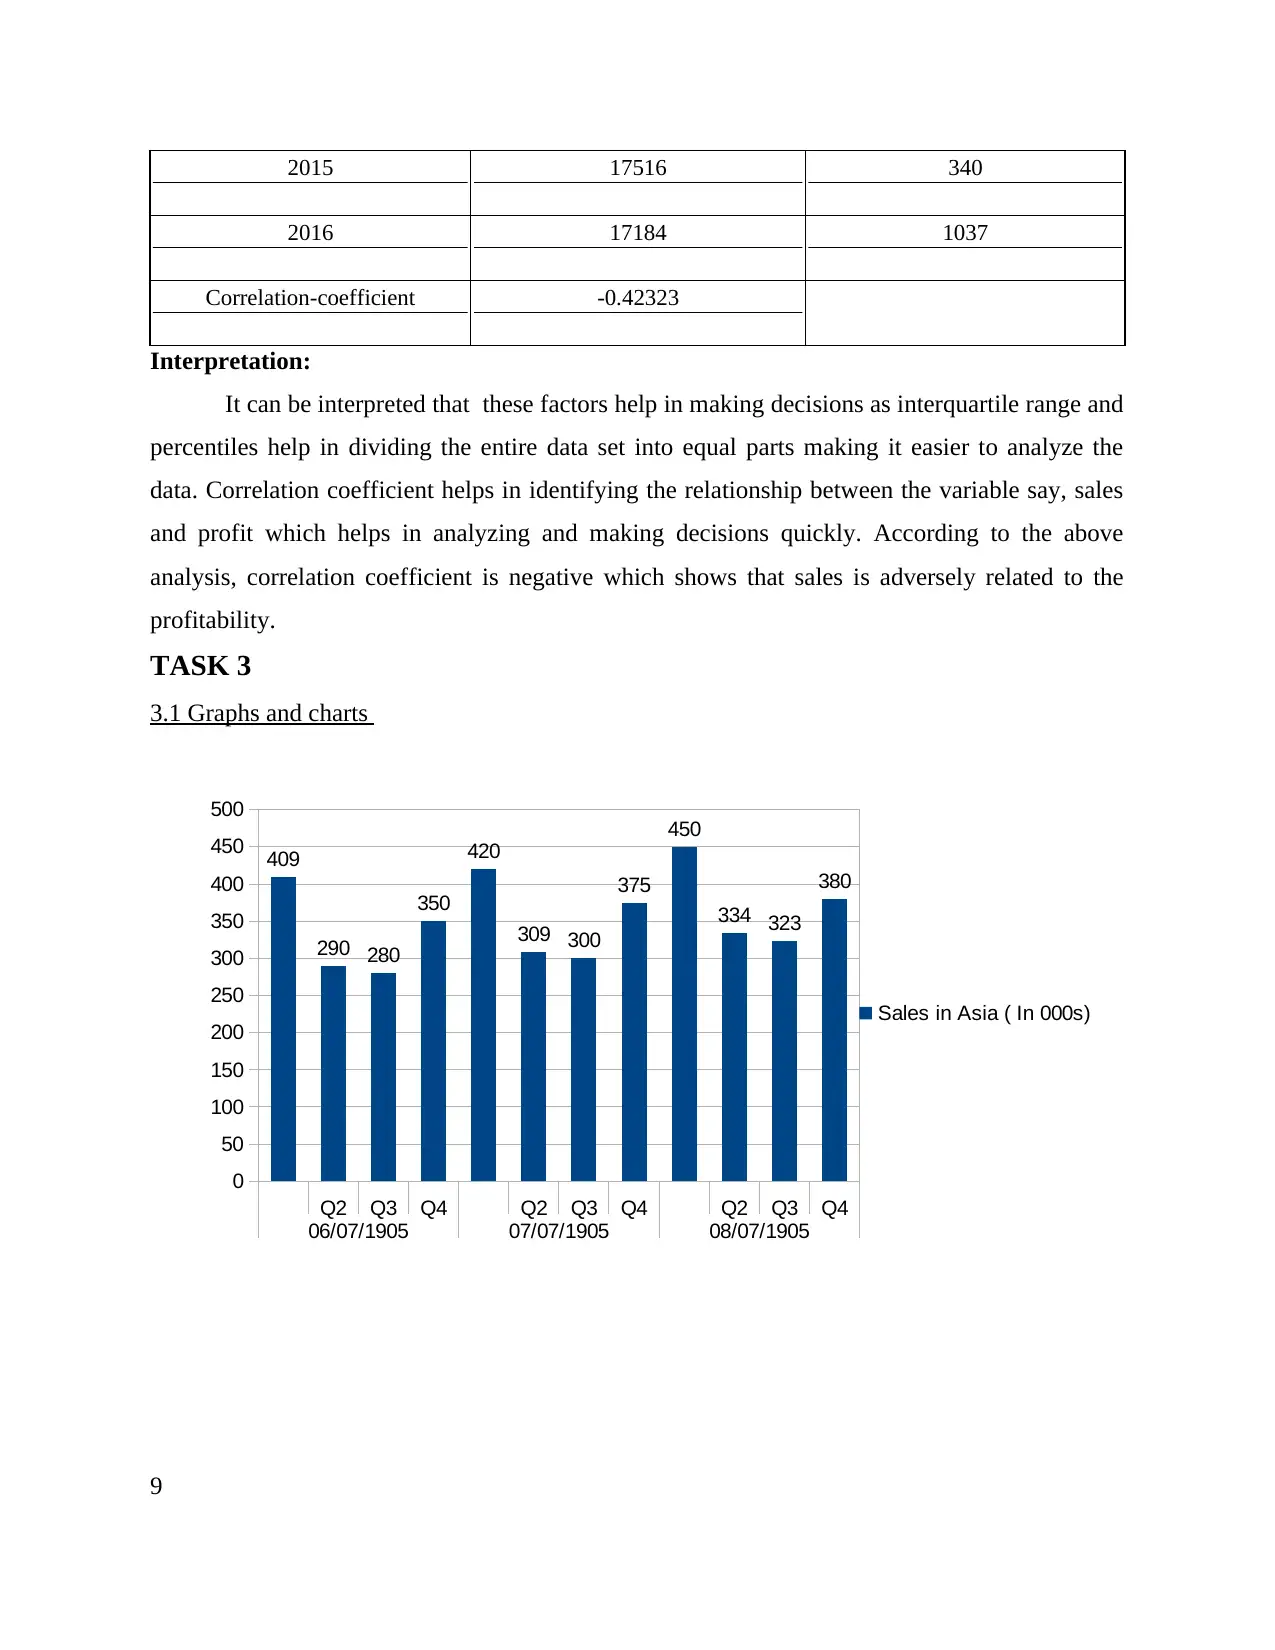
3.1 Graphs and charts
9
Q2 Q3 Q4 Q2 Q3 Q4 Q2 Q3 Q4
06/07/1905 07/07/1905 08/07/1905
0
50
100
150
200
250
300
350
400
450
500
409
290 280
350
420
309 300
375
450
334 323
380
Sales in Asia ( In 000s)
2016 17184 1037
Correlation-coefficient -0.42323
Interpretation:
It can be interpreted that these factors help in making decisions as interquartile range and
percentiles help in dividing the entire data set into equal parts making it easier to analyze the
data. Correlation coefficient helps in identifying the relationship between the variable say, sales
and profit which helps in analyzing and making decisions quickly. According to the above
analysis, correlation coefficient is negative which shows that sales is adversely related to the
profitability.
TASK 3
3.1 Graphs and charts
9
Q2 Q3 Q4 Q2 Q3 Q4 Q2 Q3 Q4
06/07/1905 07/07/1905 08/07/1905
0
50
100
150
200
250
300
350
400
450
500
409
290 280
350
420
309 300
375
450
334 323
380
Sales in Asia ( In 000s)
⊘ This is a preview!⊘
Do you want full access?
Subscribe today to unlock all pages.
Trusted by 1+ million students worldwide
10
Q2
Q3
Q4
Q2
Q3
Q4
Q2
Q3
Q4
06/07/1905 07/07/1905 08/07/1905
0 50 100 150 200 250 300 350 400 450 500
409
290
280
350
420
309
300
375
450
334
323
380
Sales in Asia ( In 000s)
409
290
280
350
420
309 300
375
450
334
323
380
Q1
Q2
Q3
Q4
Q1
Q2
Q3
Q4
Q1
Q2
Q3
Q4
Q2
Q3
Q4
Q2
Q3
Q4
Q2
Q3
Q4
06/07/1905 07/07/1905 08/07/1905
0 50 100 150 200 250 300 350 400 450 500
409
290
280
350
420
309
300
375
450
334
323
380
Sales in Asia ( In 000s)
409
290
280
350
420
309 300
375
450
334
323
380
Q1
Q2
Q3
Q4
Q1
Q2
Q3
Q4
Q1
Q2
Q3
Q4
Paraphrase This Document
Need a fresh take? Get an instant paraphrase of this document with our AI Paraphraser
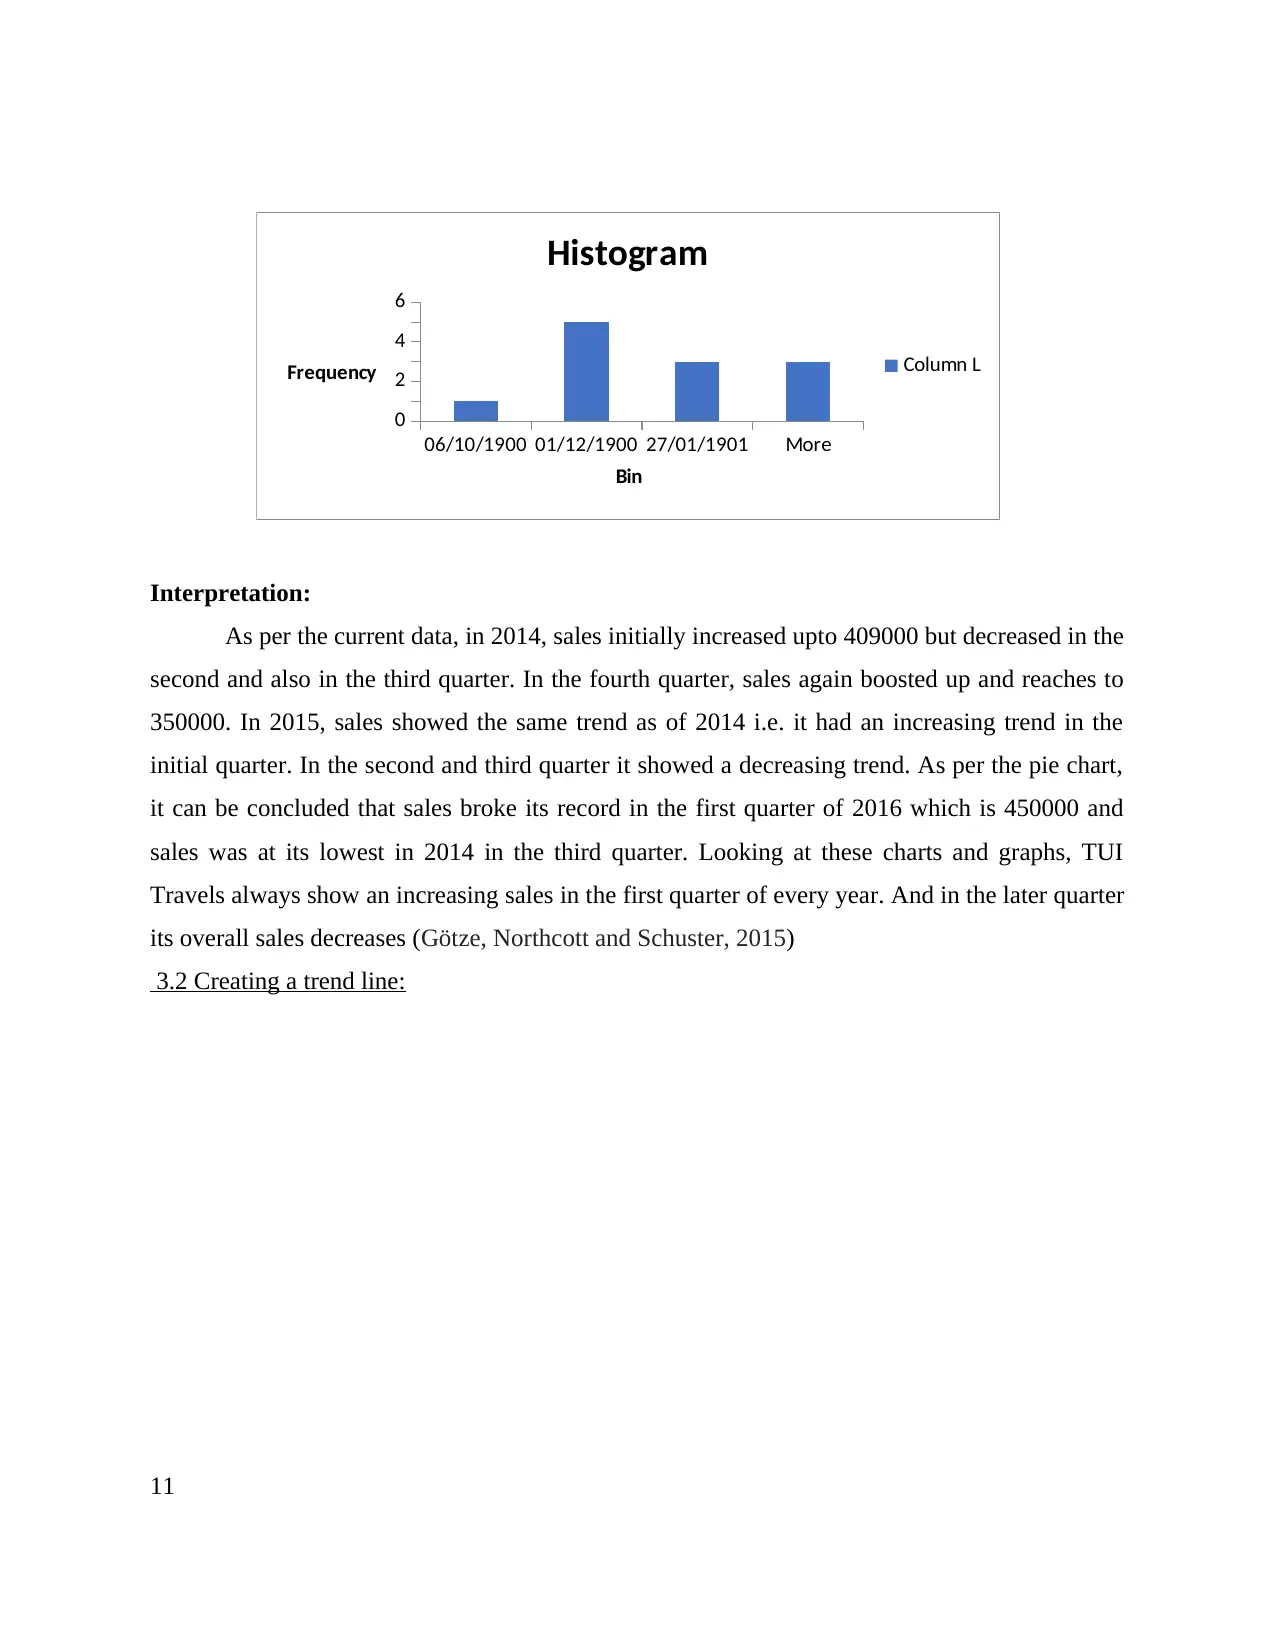
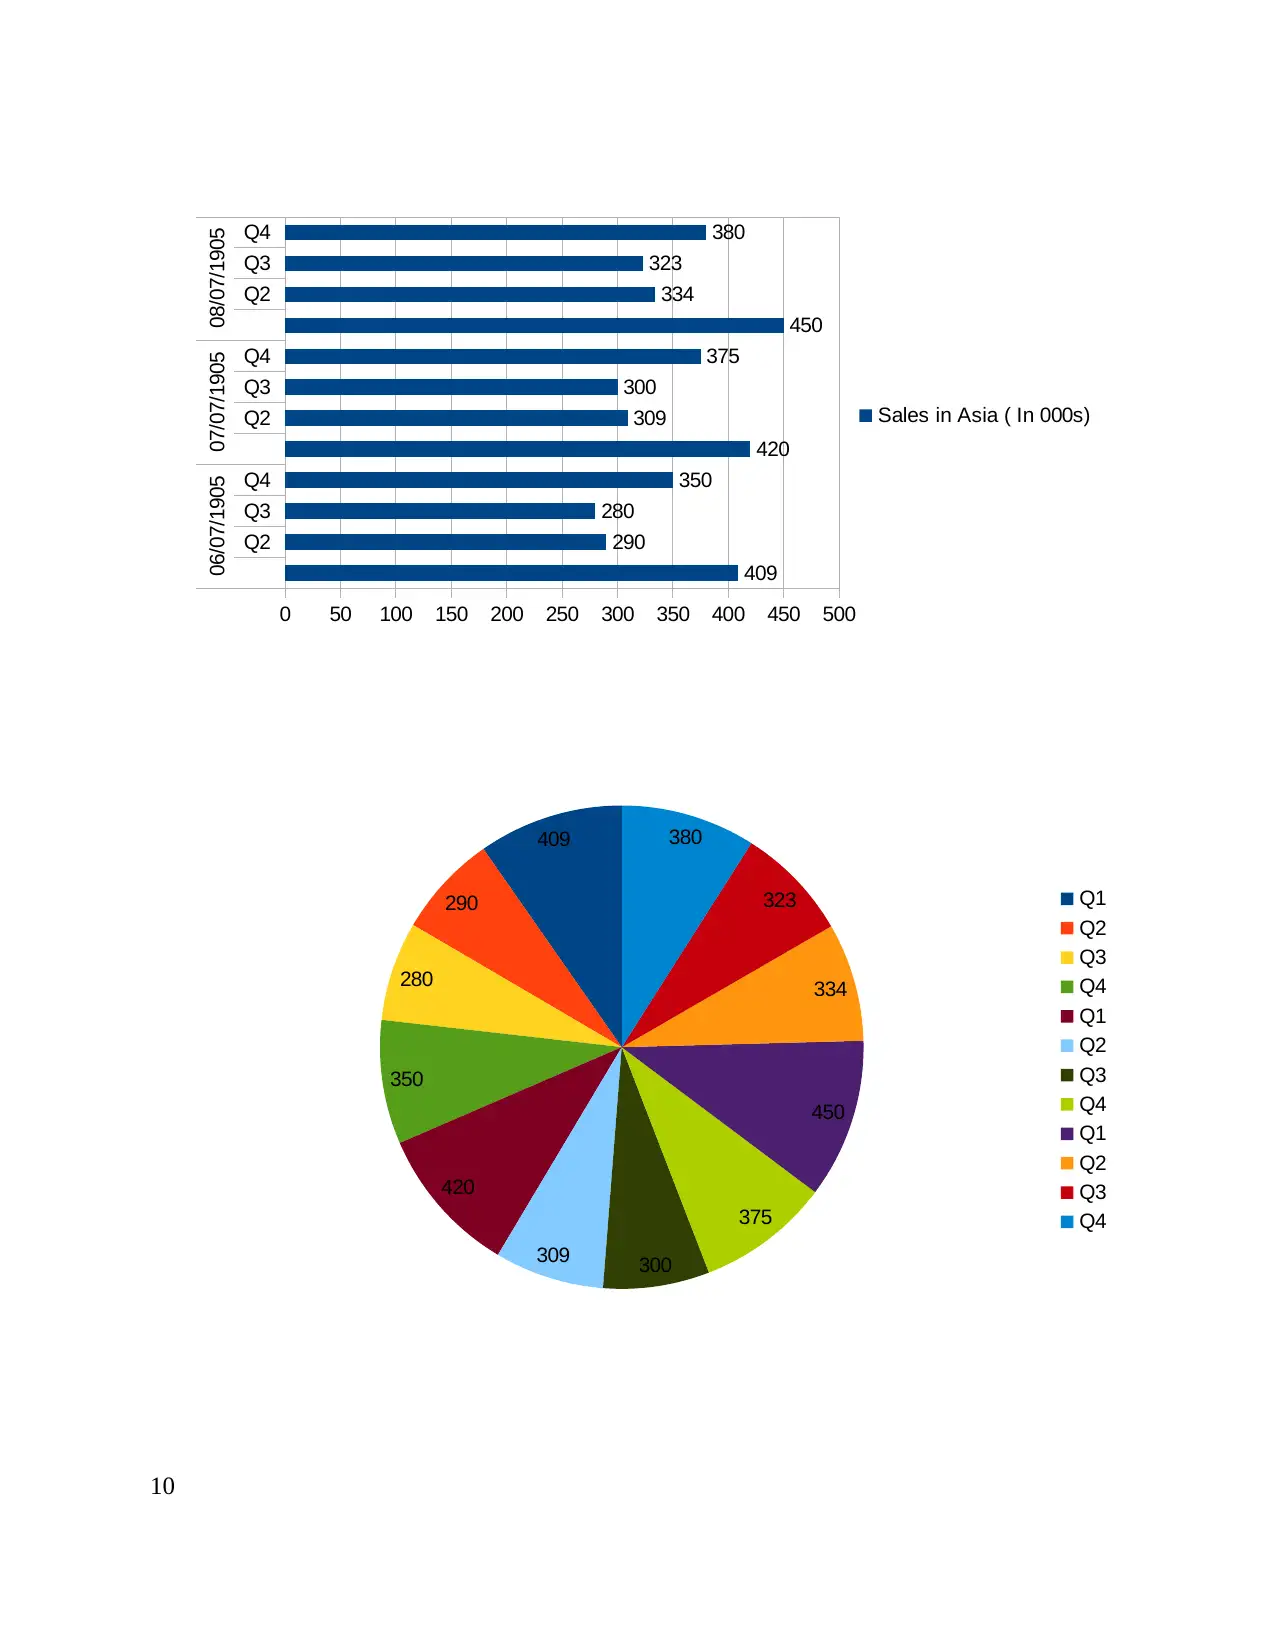
Interpretation:
As per the current data, in 2014, sales initially increased upto 409000 but decreased in the
second and also in the third quarter. In the fourth quarter, sales again boosted up and reaches to
350000. In 2015, sales showed the same trend as of 2014 i.e. it had an increasing trend in the
initial quarter. In the second and third quarter it showed a decreasing trend. As per the pie chart,
it can be concluded that sales broke its record in the first quarter of 2016 which is 450000 and
sales was at its lowest in 2014 in the third quarter. Looking at these charts and graphs, TUI
Travels always show an increasing sales in the first quarter of every year. And in the later quarter
its overall sales decreases (Götze, Northcott and Schuster, 2015)
3.2 Creating a trend line:
11
06/10/1900 01/12/1900 27/01/1901 More
0
2
4
6
Histogram
Column L
Bin
Frequency
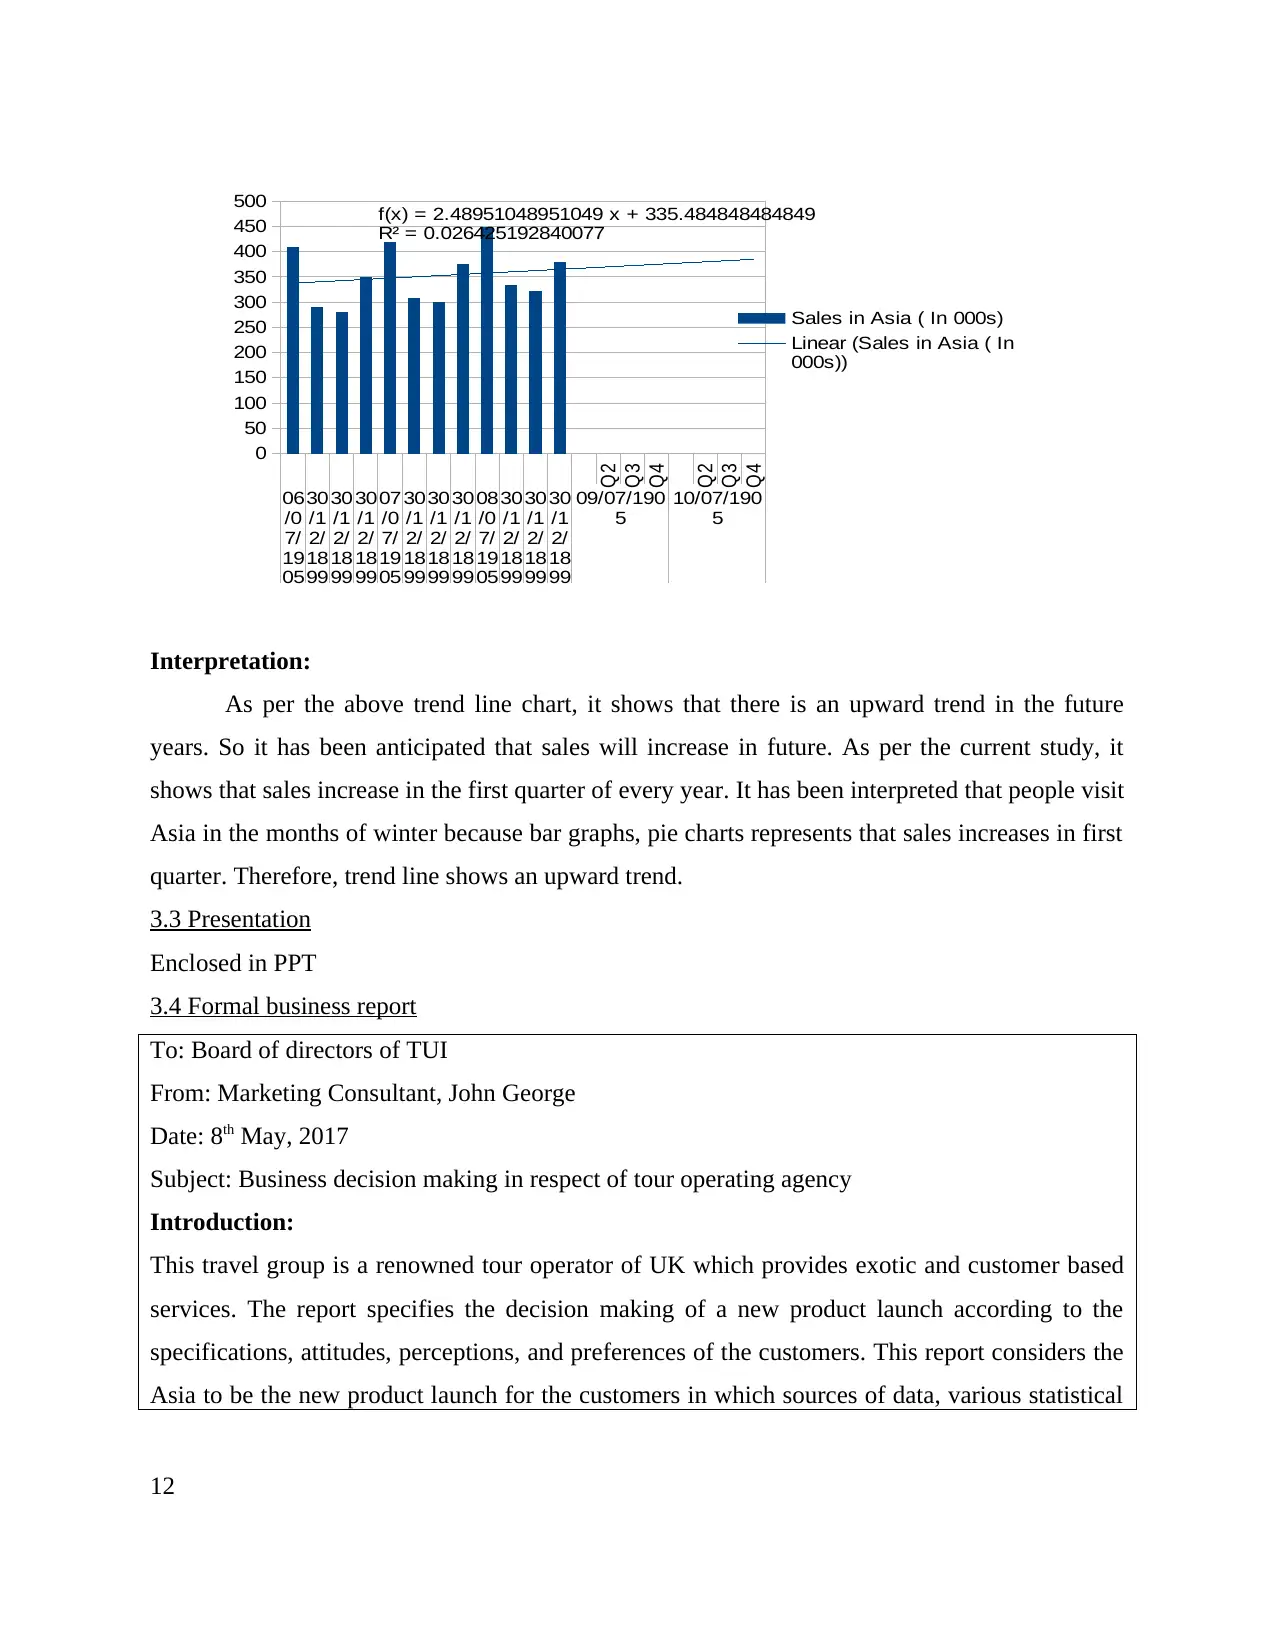
Interpretation:
As per the above trend line chart, it shows that there is an upward trend in the future
years. So it has been anticipated that sales will increase in future. As per the current study, it
shows that sales increase in the first quarter of every year. It has been interpreted that people visit
Asia in the months of winter because bar graphs, pie charts represents that sales increases in first
quarter. Therefore, trend line shows an upward trend.
3.3 Presentation
Enclosed in PPT
3.4 Formal business report
To: Board of directors of TUI
From: Marketing Consultant, John George
Date: 8th May, 2017
Subject: Business decision making in respect of tour operating agency
Introduction:
This travel group is a renowned tour operator of UK which provides exotic and customer based
services. The report specifies the decision making of a new product launch according to the
specifications, attitudes, perceptions, and preferences of the customers. This report considers the
Asia to be the new product launch for the customers in which sources of data, various statistical
12
Q 2
Q 3
Q 4
Q 2
Q 3
Q 4
06
/0
7/
19
05
30
/1
2/
18
99
30
/1
2/
18
99
30
/1
2/
18
99
07
/0
7/
19
05
30
/1
2/
18
99
30
/1
2/
18
99
30
/1
2/
18
99
08
/0
7/
19
05
30
/1
2/
18
99
30
/1
2/
18
99
30
/1
2/
18
99
09/07/190
5
10/07/190
5
0
50
100
150
200
250
300
350
400
450
500 f(x) = 2.48951048951049 x + 335.484848484849
R² = 0.026425192840077
Sales in Asia ( In 000s)
Linear (Sales in Asia ( In
000s))
⊘ This is a preview!⊘
Do you want full access?
Subscribe today to unlock all pages.
Trusted by 1+ million students worldwide
1 out of 19
Related Documents


Your All-in-One AI-Powered Toolkit for Academic Success.
+13062052269
info@desklib.com
Available 24*7 on WhatsApp / Email
![[object Object]](/_next/static/media/star-bottom.7253800d.svg)
Unlock your academic potential
Copyright © 2020–2026 A2Z Services. All Rights Reserved. Developed and managed by ZUCOL.