Business Decision Making Report: Primary and Secondary Data
VerifiedAdded on  2020/10/05
|23
|3030
|458
Report
AI Summary
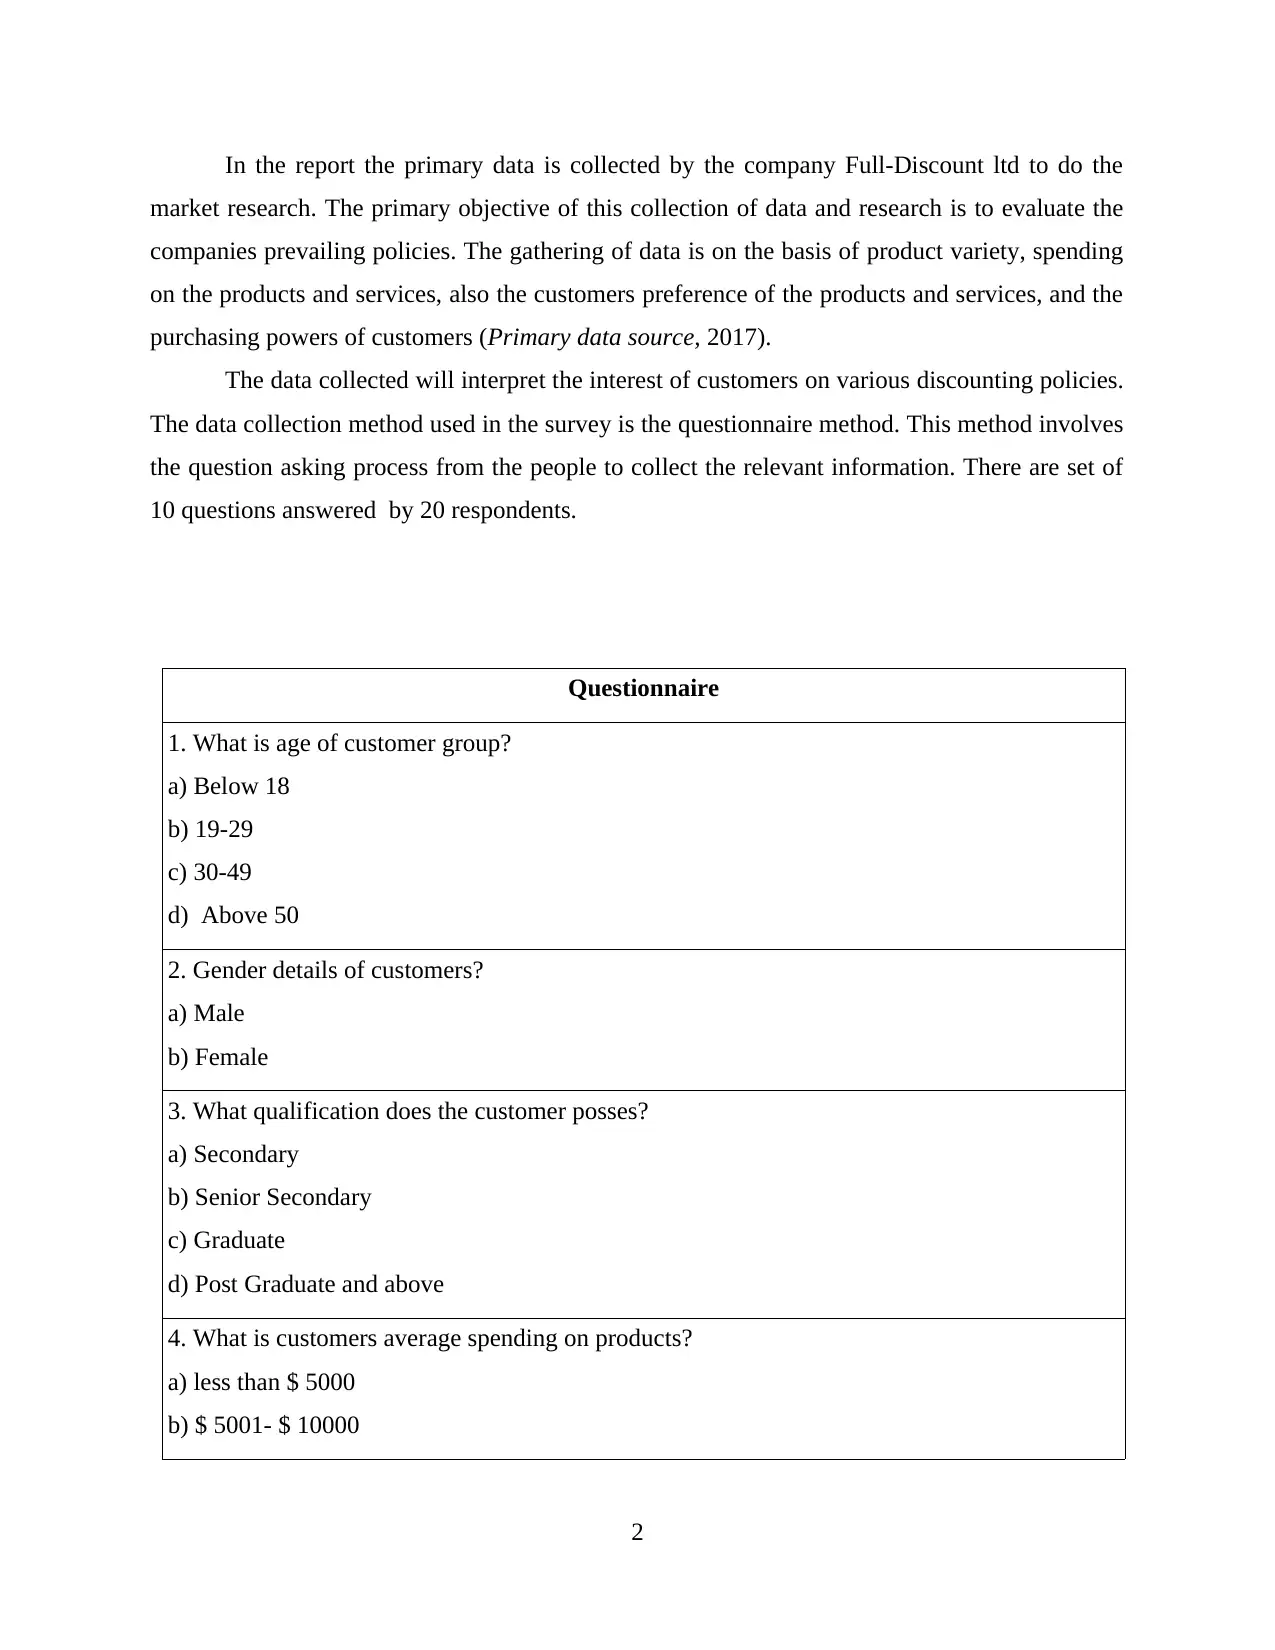
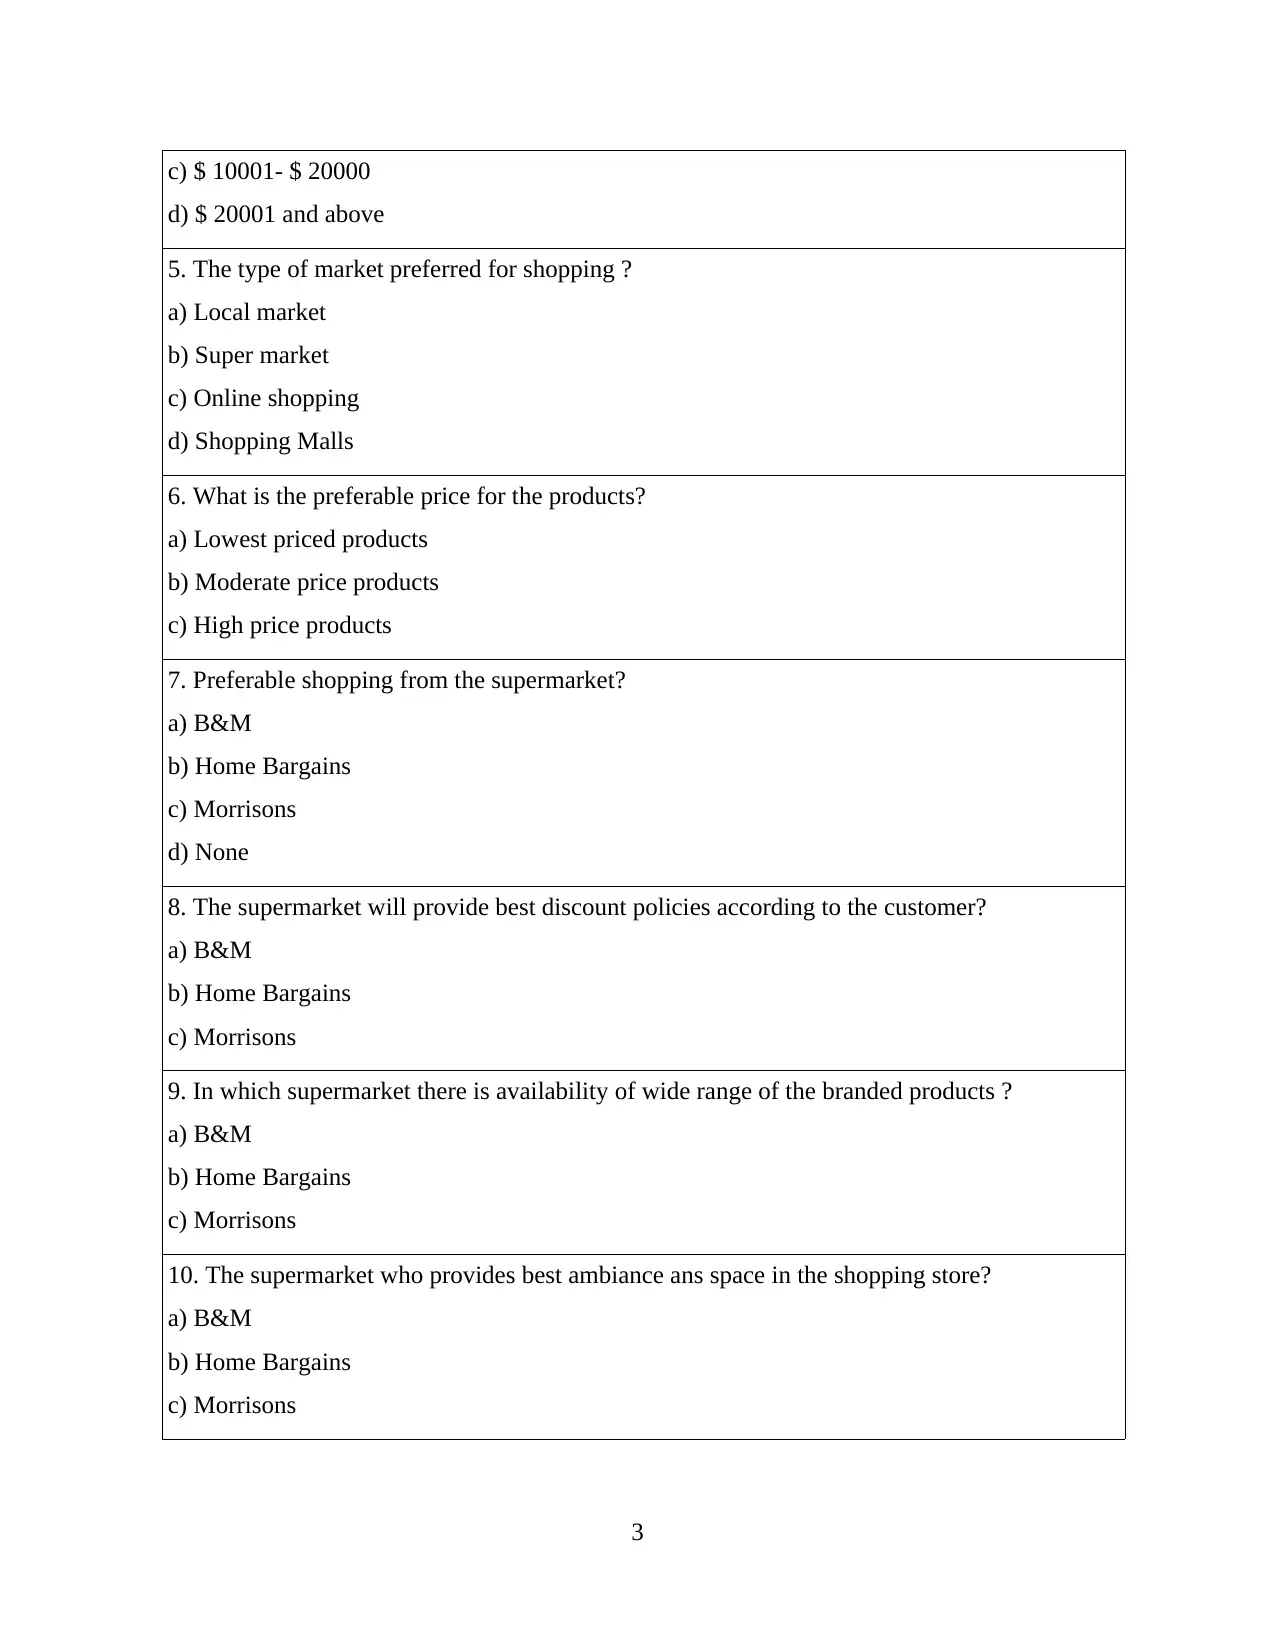
This report examines business decision-making processes, focusing on primary and secondary data collection methods. The primary data collection involves a questionnaire-based survey of 20 respondents to assess customer preferences, spending habits, and perceptions of supermarkets like B&M, Home Bargains, and Morrisons. The questionnaire explores aspects such as age, gender, education, spending, preferred shopping locations, and price preferences. The data is analyzed using frequency tables and graphs to interpret customer insights. The secondary data collection involves gathering information from internet searches and other sources to evaluate the companies' growth and financial positions, including the calculation of current and quick ratios. The report aims to provide a comprehensive understanding of how data collection and analysis can inform effective business decisions, particularly in the retail sector, and evaluates the financial health of the mentioned companies.

BUSINESS
DECISION MAKING
DECISION MAKING
Paraphrase This Document
Need a fresh take? Get an instant paraphrase of this document with our AI Paraphraser

Table of Contents
INTRODUCTION...........................................................................................................................1
TASK 1 ...........................................................................................................................................1
Primary data collection and analysis............................................................................................1
TASK 2..........................................................................................................................................15
Secondary data collection..........................................................................................................15
CONCLUSION..............................................................................................................................17
REFERENCES..............................................................................................................................19

EXECUTIVE SUMMARY
Primary data source is a data collection at the initial level. five types of methods for the
collection of primary data. primary data is collected by the company Full-Discount ltd,
secondary data is collected through the third party, current ratio is referred to as liquidity ratio
quick ratio is also a liquidity ratio ,
⊘ This is a preview!⊘
Do you want full access?
Subscribe today to unlock all pages.

Trusted by 1+ million students worldwide

INTRODUCTION
Business decision making is process of decision making in business which determines the
factors effecting the company in many ways. The decision making process helps in evaluation of
various problems in the business. It determines the policies and procedures to be followed in the
companies. The policies are made in order to achieve the goals and aims of then company.
The report will study the primary and secondary collection of data of the companies
B&M, Home Bargains and Morrisons. The collection of the primary data will include techniques
and methods. The primary data will include the questionnaire method of data collection from the
various person.
Furthermore report will state the collection of secondary data thorough the internet
searches and libraries. The data collection both primary and secondary is done to increase the
efficiency of the company by eliminating the problems of the company occurring in the normal
functioning of organization.
TASK 1
Primary data collection and analysis
Primary data collection- Primary data source is a data collection at the initial level of the
survey by the researcher. The primary data is the first hand data or the raw data which is being
further processed to evaluate the performance of the companies. The collection of the data is
from the different sources and different levels (Demil and et.al., 2015). The data collection is
done through the number of techniques. This data collection provides the true picture of the
analysis and the company at which the research is done. Primary data can be collected through
the random sampling, conducting surveys, interviews, experiments and observations of the
current prevailing conditions. Although the collection of the data is effective but it is costly and
time consuming as it requires more human resources to collect the data from the general public
(Devine and et.al., 2018). There are five types of methods for the collection of primary data
which contains-
ï‚· Delphi technique
ï‚· Interview method
ï‚· Questionnaire Method
ï‚· Projective Techniques (Ross,2016)
ï‚· Focus Group Interviews
1
Paraphrase This Document
Need a fresh take? Get an instant paraphrase of this document with our AI Paraphraser

In the report the primary data is collected by the company Full-Discount ltd to do the
market research. The primary objective of this collection of data and research is to evaluate the
companies prevailing policies. The gathering of data is on the basis of product variety, spending
on the products and services, also the customers preference of the products and services, and the
purchasing powers of customers (Primary data source, 2017).
The data collected will interpret the interest of customers on various discounting policies.
The data collection method used in the survey is the questionnaire method. This method involves
the question asking process from the people to collect the relevant information. There are set of
10 questions answered by 20 respondents.
Questionnaire
1. What is age of customer group?
a) Below 18
b) 19-29
c) 30-49
d) Above 50
2. Gender details of customers?
a) Male
b) Female
3. What qualification does the customer posses?
a) Secondary
b) Senior Secondary
c) Graduate
d) Post Graduate and above
4. What is customers average spending on products?
a) less than $ 5000
b) $ 5001- $ 10000
2

c) $ 10001- $ 20000
d) $ 20001 and above
5. The type of market preferred for shopping ?
a) Local market
b) Super market
c) Online shopping
d) Shopping Malls
6. What is the preferable price for the products?
a) Lowest priced products
b) Moderate price products
c) High price products
7. Preferable shopping from the supermarket?
a) B&M
b) Home Bargains
c) Morrisons
d) None
8. The supermarket will provide best discount policies according to the customer?
a) B&M
b) Home Bargains
c) Morrisons
9. In which supermarket there is availability of wide range of the branded products ?
a) B&M
b) Home Bargains
c) Morrisons
10. The supermarket who provides best ambiance ans space in the shopping store?
a) B&M
b) Home Bargains
c) Morrisons
3
⊘ This is a preview!⊘
Do you want full access?
Subscribe today to unlock all pages.

Trusted by 1+ million students worldwide

Frequencies
Statistics
1. What
is age
of
custom
er
group?
2.
Gender
details
of
custom
ers?
3. What
qualific
ation
does
the
custom
er
posses
?
4. What
is
custom
ers
average
spendin
g on
product
s?
5. The
type of
market
preferre
d for
shoppin
g ?
6. What
is the
prefera
ble
price for
the
product
s?
7.
Prefera
ble
shoppin
g from
the
superm
arket?
8. The
superm
arket
will
provide
best
discoun
t
policies
accordi
ng to
the
custom
er?
9. In
which
superm
arket
there is
availabil
ity of
wide
range
of the
brande
d
product
s ?
10. The
superm
arket
who
provide
s best
ambian
ce ans
space in
the
shoppin
g store?
N
Vali
d 20 20 20 20 20 20 20 20 20 20
Miss
ing 0 0 0 0 0 0 0 0 0 0
Mean 2.70 1.60 3.05 2.85 2.30 1.75 2.30 2.10 1.90 2.20
Median 3.00 2.00 3.00 3.00 2.00 2.00 2.00 2.00 2.00 2.00
Mode 3 2 4 4 2 1 2 2 2 2a
Std. Deviation 1.031 .503 1.050 1.089 1.031 .786 .923 .788 .788 .768
Variance 1.063 .253 1.103 1.187 1.063 .618 .853 .621 .621 .589
Range 3 1 3 3 3 2 3 2 2 2
a. Multiple modes exist. The smallest value is shown
Frequency Table
1. What is age of customer group?
Frequency Percent Valid Percent Cumulative Percent
Valid 1 3 15.0 15.0 15.0
2 5 25.0 25.0 40.0
3 7 35.0 35.0 75.0
4
Paraphrase This Document
Need a fresh take? Get an instant paraphrase of this document with our AI Paraphraser

4 5 25.0 25.0 100.0
Total 20 100.0 100.0
Interpretation- The above graph states that 3 respondents out of 20 respondents are below 18
years of age. And also 5 respondents are in the age group of 19 to 29, 7 respondents are in the
age group of 30 to 49 and there are 5 respondents which are above the age of 50 years.
2. Gender details of customers?
Frequency Percent Valid Percent Cumulative Percent
Valid
1 8 40.0 40.0 40.0
2 12 60.0 60.0 100.0
Total 20 100.0 100.0
5
Total 20 100.0 100.0
Interpretation- The above graph states that 3 respondents out of 20 respondents are below 18
years of age. And also 5 respondents are in the age group of 19 to 29, 7 respondents are in the
age group of 30 to 49 and there are 5 respondents which are above the age of 50 years.
2. Gender details of customers?
Frequency Percent Valid Percent Cumulative Percent
Valid
1 8 40.0 40.0 40.0
2 12 60.0 60.0 100.0
Total 20 100.0 100.0
5

Interpretation- From the above graph it is been concluded that there are 8 males and 12 females
in the respondent of questionnaire.
3. What qualification does the customer posses?
Frequency Percent Valid Percent Cumulative
Percent
Valid
1 2 10.0 10.0 10.0
2 4 20.0 20.0 30.0
3 5 25.0 25.0 55.0
4 9 45.0 45.0 100.0
Total 20 100.0 100.0
6
in the respondent of questionnaire.
3. What qualification does the customer posses?
Frequency Percent Valid Percent Cumulative
Percent
Valid
1 2 10.0 10.0 10.0
2 4 20.0 20.0 30.0
3 5 25.0 25.0 55.0
4 9 45.0 45.0 100.0
Total 20 100.0 100.0
6
⊘ This is a preview!⊘
Do you want full access?
Subscribe today to unlock all pages.

Trusted by 1+ million students worldwide

Interpretation -The above graph states that the qualification of the answer-er for the questions.
It states that there are 2 answer-er who are secondary passes, 4 answer-es who are senior
secondary qualified, 5 persons who are graduate and 9 answer-er who are post graduate and
above.
4. What is customers average spending on products?
Frequency Percent Valid Percent Cumulative Percent
Valid
1 3 15.0 15.0 15.0
2 4 20.0 20.0 35.0
3 6 30.0 30.0 65.0
4 7 35.0 35.0 100.0
Total 20 100.0 100.0
7
Paraphrase This Document
Need a fresh take? Get an instant paraphrase of this document with our AI Paraphraser

Interpretation- The above graph states the average spending of the customers on the product and
services. It states that 3 out of 20 respondents spends less than $ 5000, 4 respondents spends
$5000 to $ 10000, 6 respondents spends $ 10001 to $ 20000 and $ 20001 and above are spend
by 7 respondents.
5. The type of market preferred for shopping ?
Frequency Percent Valid Percent Cumulative Percent
Valid
1 5 25.0 25.0 25.0
2 7 35.0 35.0 60.0
3 5 25.0 25.0 85.0
4 3 15.0 15.0 100.0
Total 20 100.0 100.0
8

Interpretation- The above graph states the preference of the customers for the shopping market.
The graph stated that there are 5 persons who prefer shopping from local market, 7 persons who
prefer shopping from super market, 5 customers like to shop from online shopping apps and 3
customers who shop from the shopping malls.
6. What is the preferable price for the products?
Frequency Percent Valid Percent Cumulative Percent
Valid
1 9 45.0 45.0 45.0
2 7 35.0 35.0 80.0
3 4 20.0 20.0 100.0
Total 20 100.0 100.0
9
⊘ This is a preview!⊘
Do you want full access?
Subscribe today to unlock all pages.

Trusted by 1+ million students worldwide
1 out of 23
Related Documents

Your All-in-One AI-Powered Toolkit for Academic Success.
 +13062052269
info@desklib.com
Available 24*7 on WhatsApp / Email
Unlock your academic potential
Copyright © 2020–2025 A2Z Services. All Rights Reserved. Developed and managed by ZUCOL.