Business Decision Making Report: Data Analysis and Decision Making
VerifiedAdded on 2020/01/07
|19
|4701
|258
Report
AI Summary
This report provides a comprehensive analysis of business decision-making processes. It begins with a plan for collecting primary and secondary data, detailing survey methodologies and questionnaire design. The report then summarizes and analyzes data using descriptive statistics, measures of dispersion, quartiles, percentiles, and correlation coefficients. It also covers the creation of graphs and charts, trend line forecasting, and the preparation of a business presentation and formal report. Finally, it includes project planning, critical path determination, and an assessment of financial viability using investment appraisal tools. The report emphasizes the importance of data-driven decisions and effective communication in the business context.

Business Decision Making
Paraphrase This Document
Need a fresh take? Get an instant paraphrase of this document with our AI Paraphraser
Table of Contents
INTRODUCTION ....................................................................................................................4
TASK 1......................................................................................................................................4
1.1 Plan for the collection of primary and secondary data ....................................................4
1.2 Stating the survey methodology and sampling frame......................................................5
1.3 Preparing questionnaire....................................................................................................6
TASK 2......................................................................................................................................7
2.1 and 2.2 Creation of information for decision making by summarizing data....................7
2.3 Analyzing data by suing the measures of dispersion.....................................................11
2.4 Explaining the ways in which quartile, percentile and correlation co-efficient helps in
making effective decisions ..................................................................................................11
TASK 3....................................................................................................................................12
3.1 Producing graphs and charts using spreadsheets............................................................12
3.2 Creating a trend line for forecasting a future event........................................................13
3.3 Preparing a business presentation...................................................................................14
3.4 Producing a formal business report for the proposed new product development
initiative................................................................................................................................14
TASK 4....................................................................................................................................14
4.1 Preparing a project plan and determining the critical path.............................................14
4.2 Assessing the financial viability of the project by using the investment appraisal tool 15
CONCLUSION........................................................................................................................17
REFERENCES.........................................................................................................................18

⊘ This is a preview!⊘
Do you want full access?
Subscribe today to unlock all pages.
Trusted by 1+ million students worldwide
INTRODUCTION
In the present scenario, effective decision making is very important for overall
success of an organization. Furthermore, managers are being required to take wide range of
decision regarding areas such as human, financial, management etc. Effective decisions at
regular intervals supports in carrying out smooth flow of operations and activities. Along
with this, it also contributes in enhancing existing sales and profits of a company. At the time
of making decisions it is required by businesses to take several aspects into consideration.
This includes employee satisfaction, nature of business, size of company, changing market
trends etc. It can be expressed that all these areas and activities has huge impact on activities
and overall performance of a business enterprise. The present research report explains the key
sources from which primary and secondary data can be collected. Along with this, it also
highlights a questionnaire which has been used to collect information from sources.
TASK 1
1.1 Plan for the collection of primary and secondary data
On the basis of information provided, ABC Company will be introducing new range of
tour related services in order to acquire higher degree of customer satisfaction. In the modern
era, the competition among businesses operating in travel and tourism industry has become so
intense that it is no longer easy for companies to gain competitive advantage over other
market players (Zsambok and Klein, 2014). Along with this, firms have also started facing
issues in increasing their existing sales and customer base. In order to introduce new service
in the marketplace, it is required by ABC Company to conduct appropriate market research.
This will help the brand in identification of changing customer need and demand. Apart from
this, market research will also support in providing very useful information regarding new
product or service development. For the purpose of introducing new range of service in
marketplace, ABC Company will need to conduct two different types of researches which are
primary and secondary. The plan for collecting primary and secondary data is mentioned
below as:
Primary data- It is considered as one of the most reliable and fresh data as the
information collected is for the first time. The rationale why this type of data is
considered as more reliable is that it is collected by the researcher himself or herself.
Paraphrase This Document
Need a fresh take? Get an instant paraphrase of this document with our AI Paraphraser
Primary data also gives more detailed information about the topic which has been
taken into consideration (Power, Sharda and Burstein, 2015). In order to introduce
new range of services, ABC Company will be collecting primary information by
using survey method.
Secondary data – It is a kind of data which has been already collected by someone
else for other researches and studies. It can be stated that as compared to primary data,
secondary information is considered as very less reliable and accurate. This data can
be collected three main sources which are books, online sources and journals. Here,
all the above mentioned sources will be used by ABC Company in order to analyse
the present market trend in travel and tourism industry. Along with this, it will also
give more in-depth knowledge about the current gap between demand and supply of
services within the industry.
Primary data- The data will be collected by conducting survey through circulating
questionnaires and organising interviews.
Secondary data- The internet can be accessed in order to gather data to support the
current project aims and the objectives. The government records and census will be
observed to know the trends and patterns.
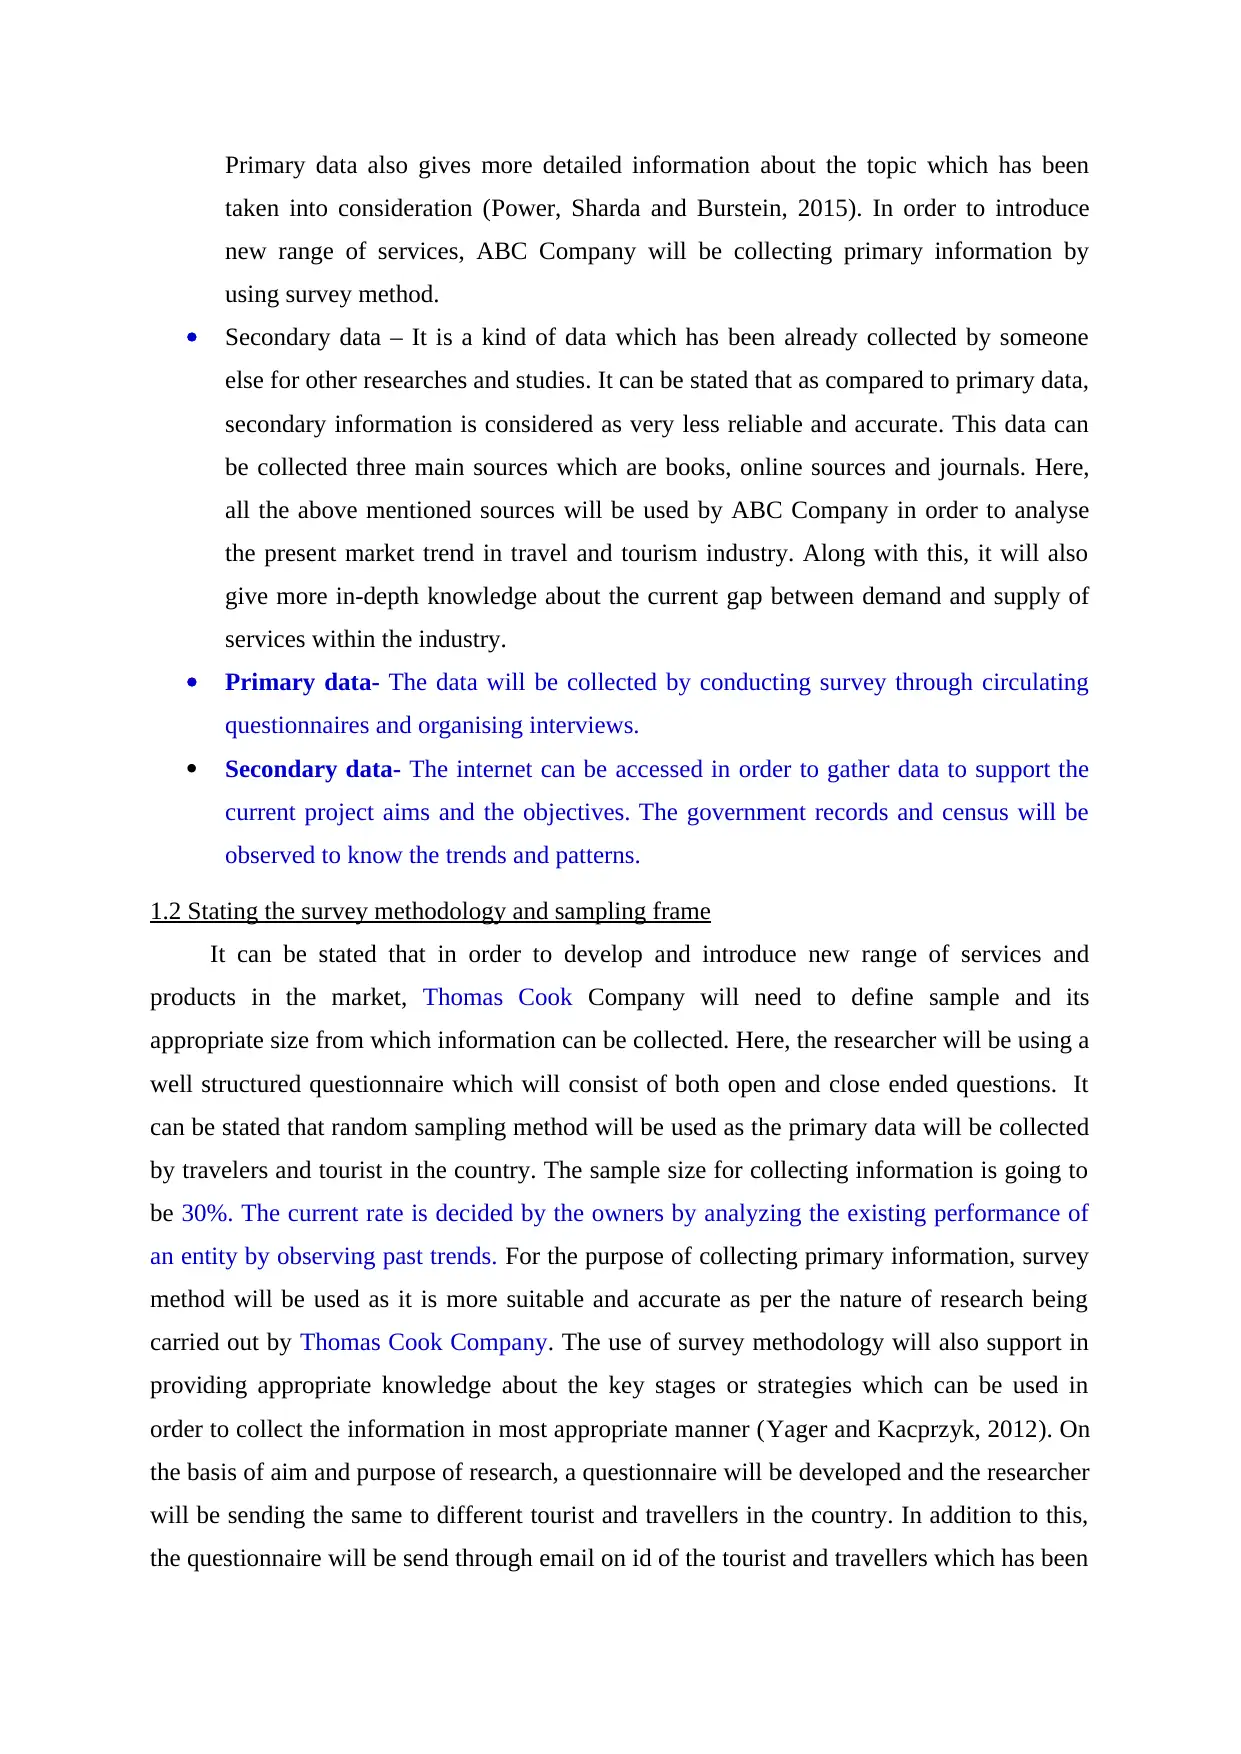
1.2 Stating the survey methodology and sampling frame
It can be stated that in order to develop and introduce new range of services and
products in the market, Thomas Cook Company will need to define sample and its
appropriate size from which information can be collected. Here, the researcher will be using a
well structured questionnaire which will consist of both open and close ended questions. It
can be stated that random sampling method will be used as the primary data will be collected
by travelers and tourist in the country. The sample size for collecting information is going to
be 30%. The current rate is decided by the owners by analyzing the existing performance of
an entity by observing past trends. For the purpose of collecting primary information, survey
method will be used as it is more suitable and accurate as per the nature of research being
carried out by Thomas Cook Company. The use of survey methodology will also support in
providing appropriate knowledge about the key stages or strategies which can be used in
order to collect the information in most appropriate manner (Yager and Kacprzyk, 2012). On
the basis of aim and purpose of research, a questionnaire will be developed and the researcher
will be sending the same to different tourist and travellers in the country. In addition to this,
the questionnaire will be send through email on id of the tourist and travellers which has been
taken into consideration (Power, Sharda and Burstein, 2015). In order to introduce
new range of services, ABC Company will be collecting primary information by
using survey method.
Secondary data – It is a kind of data which has been already collected by someone
else for other researches and studies. It can be stated that as compared to primary data,
secondary information is considered as very less reliable and accurate. This data can
be collected three main sources which are books, online sources and journals. Here,
all the above mentioned sources will be used by ABC Company in order to analyse
the present market trend in travel and tourism industry. Along with this, it will also
give more in-depth knowledge about the current gap between demand and supply of
services within the industry.
Primary data- The data will be collected by conducting survey through circulating
questionnaires and organising interviews.
Secondary data- The internet can be accessed in order to gather data to support the
current project aims and the objectives. The government records and census will be
observed to know the trends and patterns.
1.2 Stating the survey methodology and sampling frame
It can be stated that in order to develop and introduce new range of services and
products in the market, Thomas Cook Company will need to define sample and its
appropriate size from which information can be collected. Here, the researcher will be using a
well structured questionnaire which will consist of both open and close ended questions. It
can be stated that random sampling method will be used as the primary data will be collected
by travelers and tourist in the country. The sample size for collecting information is going to
be 30%. The current rate is decided by the owners by analyzing the existing performance of
an entity by observing past trends. For the purpose of collecting primary information, survey
method will be used as it is more suitable and accurate as per the nature of research being
carried out by Thomas Cook Company. The use of survey methodology will also support in
providing appropriate knowledge about the key stages or strategies which can be used in
order to collect the information in most appropriate manner (Yager and Kacprzyk, 2012). On
the basis of aim and purpose of research, a questionnaire will be developed and the researcher
will be sending the same to different tourist and travellers in the country. In addition to this,
the questionnaire will be send through email on id of the tourist and travellers which has been
randomly selected for conducting survey. This will assist in getting adequate information
about the changing need of people in the market and the gap which exists between existing
demand and supply. Here, the main objective of ABC Company is to gain reliable, adequate
and accurate information about the existing situation travel and tourism industry. Out of the
various sampling technique, random sampling method which is a part of probabilistic
sampling will be considering and the sample size selected will be 30 travelers or tourist
within London. The oxford street of the London has chosen for taking the consent of different
tourists in order to design various kinds of tour packages.
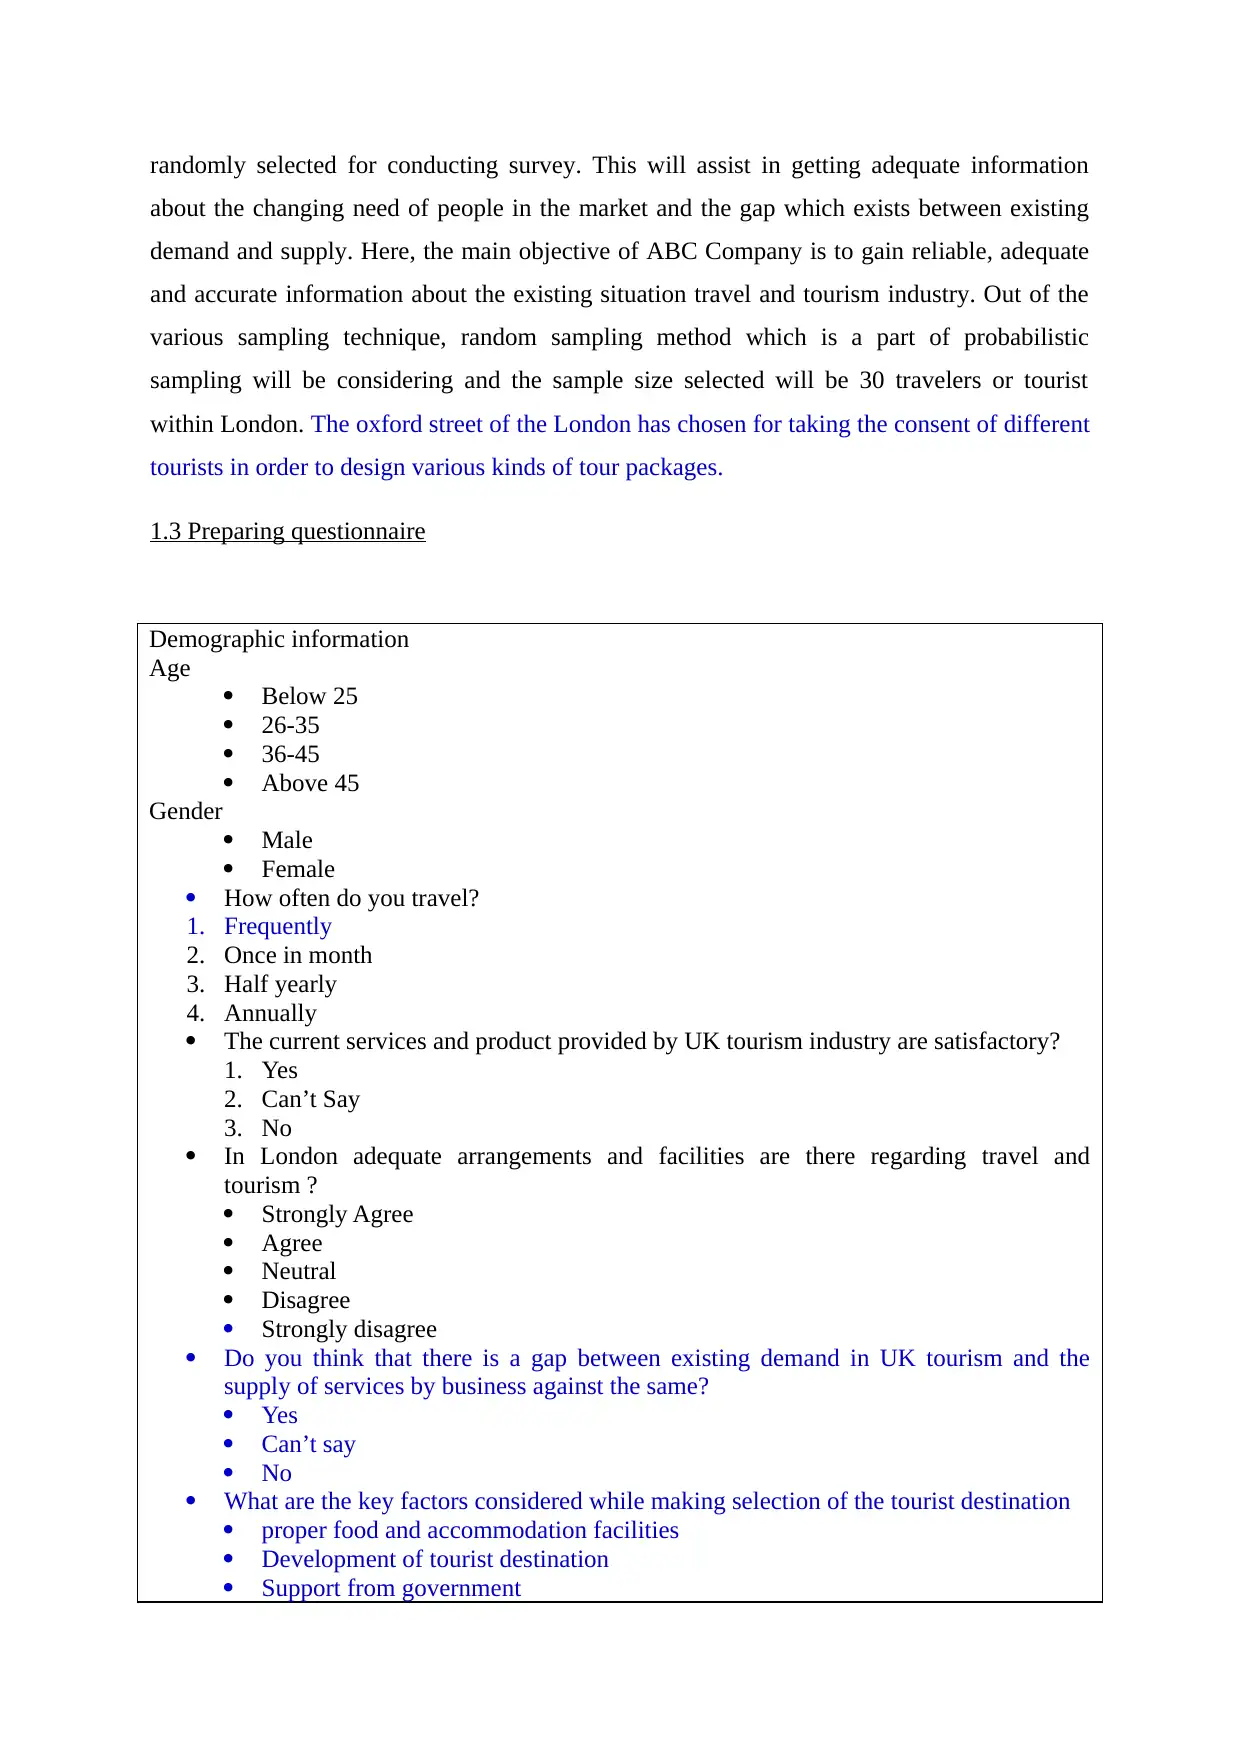
1.3 Preparing questionnaire
Demographic information
Age
Below 25
26-35
36-45
Above 45
Gender
Male
Female
How often do you travel?
1. Frequently
2. Once in month
3. Half yearly
4. Annually
The current services and product provided by UK tourism industry are satisfactory?
1. Yes
2. Can’t Say
3. No
In London adequate arrangements and facilities are there regarding travel and
tourism ?
Strongly Agree
Agree
Neutral
Disagree
Strongly disagree
Do you think that there is a gap between existing demand in UK tourism and the
supply of services by business against the same?
Yes
Can’t say
No
What are the key factors considered while making selection of the tourist destination
proper food and accommodation facilities
Development of tourist destination
Support from government
about the changing need of people in the market and the gap which exists between existing
demand and supply. Here, the main objective of ABC Company is to gain reliable, adequate
and accurate information about the existing situation travel and tourism industry. Out of the
various sampling technique, random sampling method which is a part of probabilistic
sampling will be considering and the sample size selected will be 30 travelers or tourist
within London. The oxford street of the London has chosen for taking the consent of different
tourists in order to design various kinds of tour packages.
1.3 Preparing questionnaire
Demographic information
Age
Below 25
26-35
36-45
Above 45
Gender
Male
Female
How often do you travel?
1. Frequently
2. Once in month
3. Half yearly
4. Annually
The current services and product provided by UK tourism industry are satisfactory?
1. Yes
2. Can’t Say
3. No
In London adequate arrangements and facilities are there regarding travel and
tourism ?
Strongly Agree
Agree
Neutral
Disagree
Strongly disagree
Do you think that there is a gap between existing demand in UK tourism and the
supply of services by business against the same?
Yes
Can’t say
No
What are the key factors considered while making selection of the tourist destination
proper food and accommodation facilities
Development of tourist destination
Support from government
⊘ This is a preview!⊘
Do you want full access?
Subscribe today to unlock all pages.
Trusted by 1+ million students worldwide
customized tour related product and services
What are the key services and products which you want in a customized tour package?
________________________________________________________________________
________________________________________________________________________
__________________________________________________________________
What are your recommendation to businesses in tour industry in order to enhance their
sales and profits?
________________________________________________________________________
________________________________________________________________________
__________________________________________________________________
TASK 2
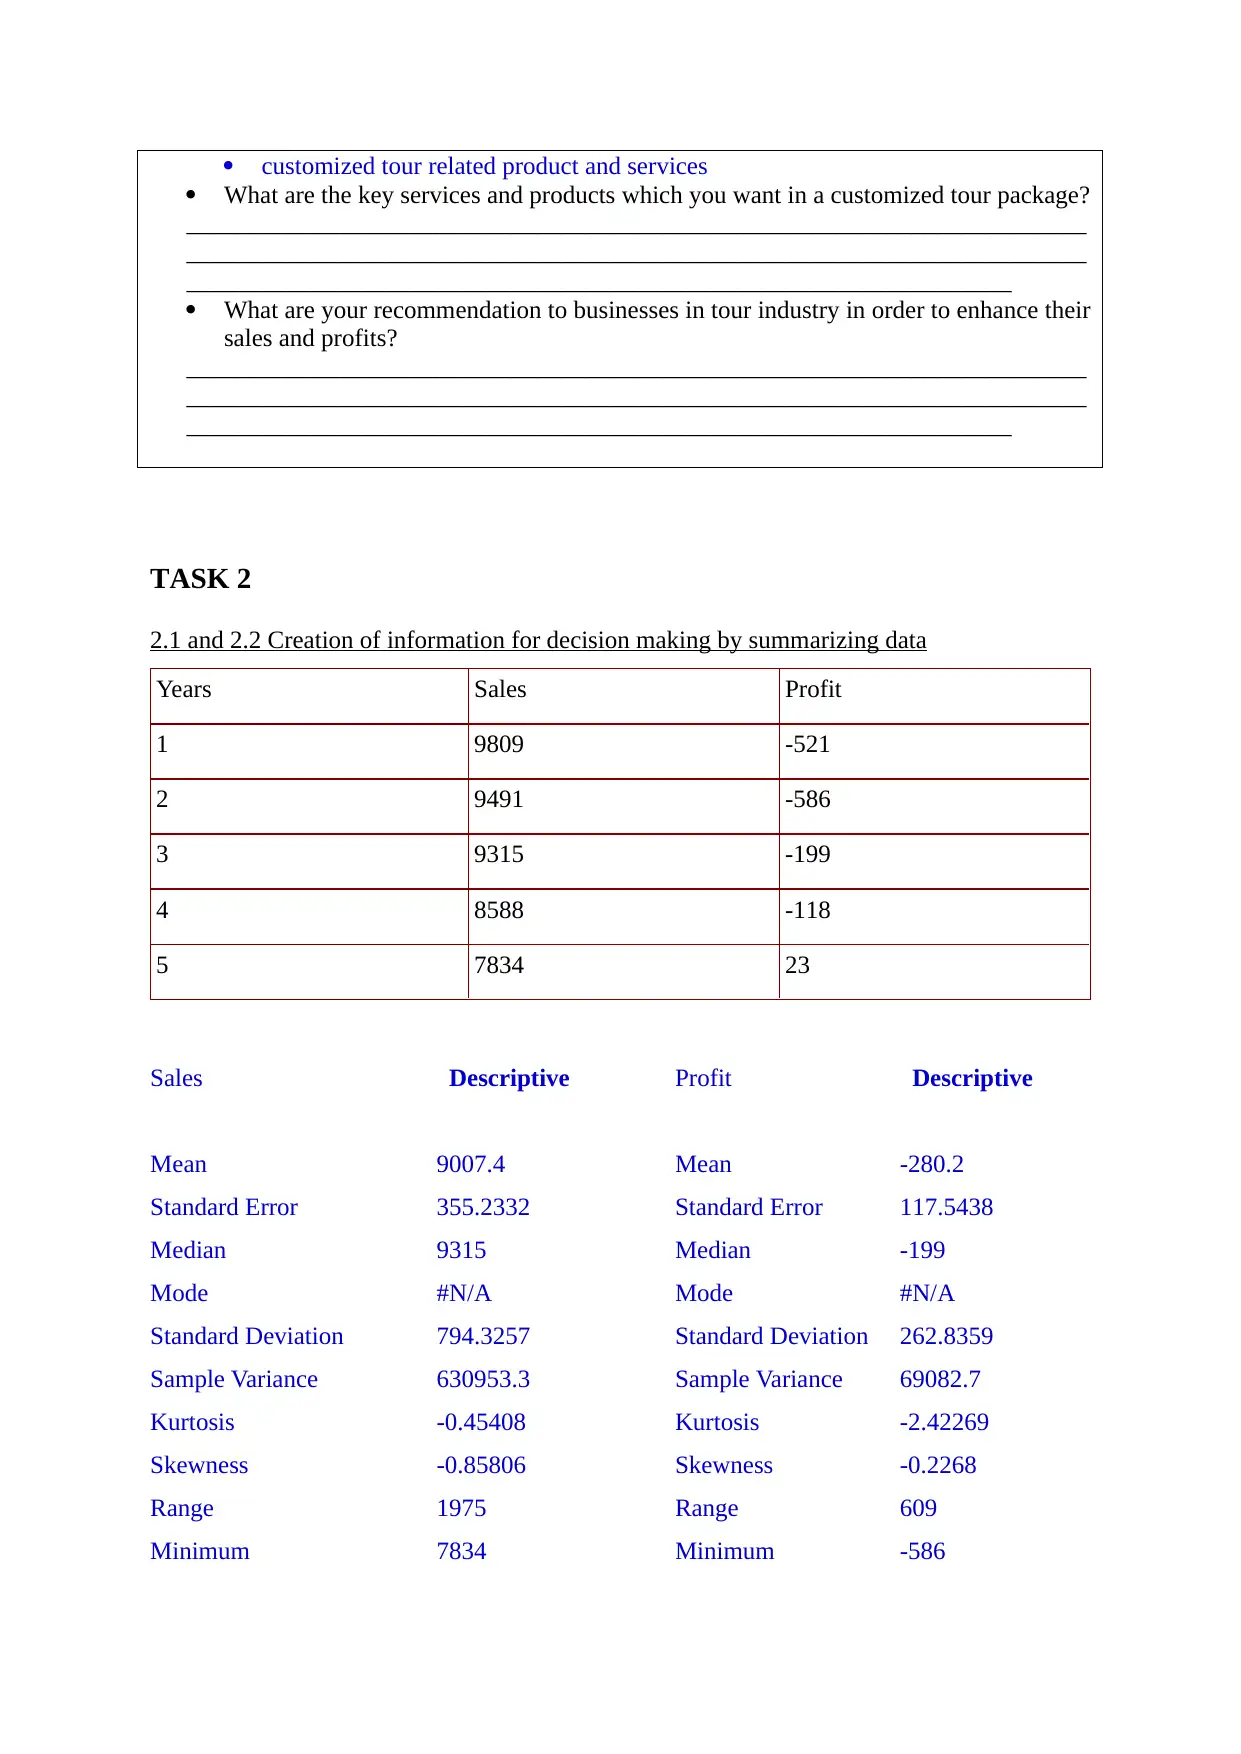
2.1 and 2.2 Creation of information for decision making by summarizing data
Years Sales Profit
1 9809 -521
2 9491 -586
3 9315 -199
4 8588 -118
5 7834 23
Sales Descriptive Profit Descriptive
Mean 9007.4 Mean -280.2
Standard Error 355.2332 Standard Error 117.5438
Median 9315 Median -199
Mode #N/A Mode #N/A
Standard Deviation 794.3257 Standard Deviation 262.8359
Sample Variance 630953.3 Sample Variance 69082.7
Kurtosis -0.45408 Kurtosis -2.42269
Skewness -0.85806 Skewness -0.2268
Range 1975 Range 609
Minimum 7834 Minimum -586
What are the key services and products which you want in a customized tour package?
________________________________________________________________________
________________________________________________________________________
__________________________________________________________________
What are your recommendation to businesses in tour industry in order to enhance their
sales and profits?
________________________________________________________________________
________________________________________________________________________
__________________________________________________________________
TASK 2
2.1 and 2.2 Creation of information for decision making by summarizing data
Years Sales Profit
1 9809 -521
2 9491 -586
3 9315 -199
4 8588 -118
5 7834 23
Sales Descriptive Profit Descriptive
Mean 9007.4 Mean -280.2
Standard Error 355.2332 Standard Error 117.5438
Median 9315 Median -199
Mode #N/A Mode #N/A
Standard Deviation 794.3257 Standard Deviation 262.8359
Sample Variance 630953.3 Sample Variance 69082.7
Kurtosis -0.45408 Kurtosis -2.42269
Skewness -0.85806 Skewness -0.2268
Range 1975 Range 609
Minimum 7834 Minimum -586
Paraphrase This Document
Need a fresh take? Get an instant paraphrase of this document with our AI Paraphraser
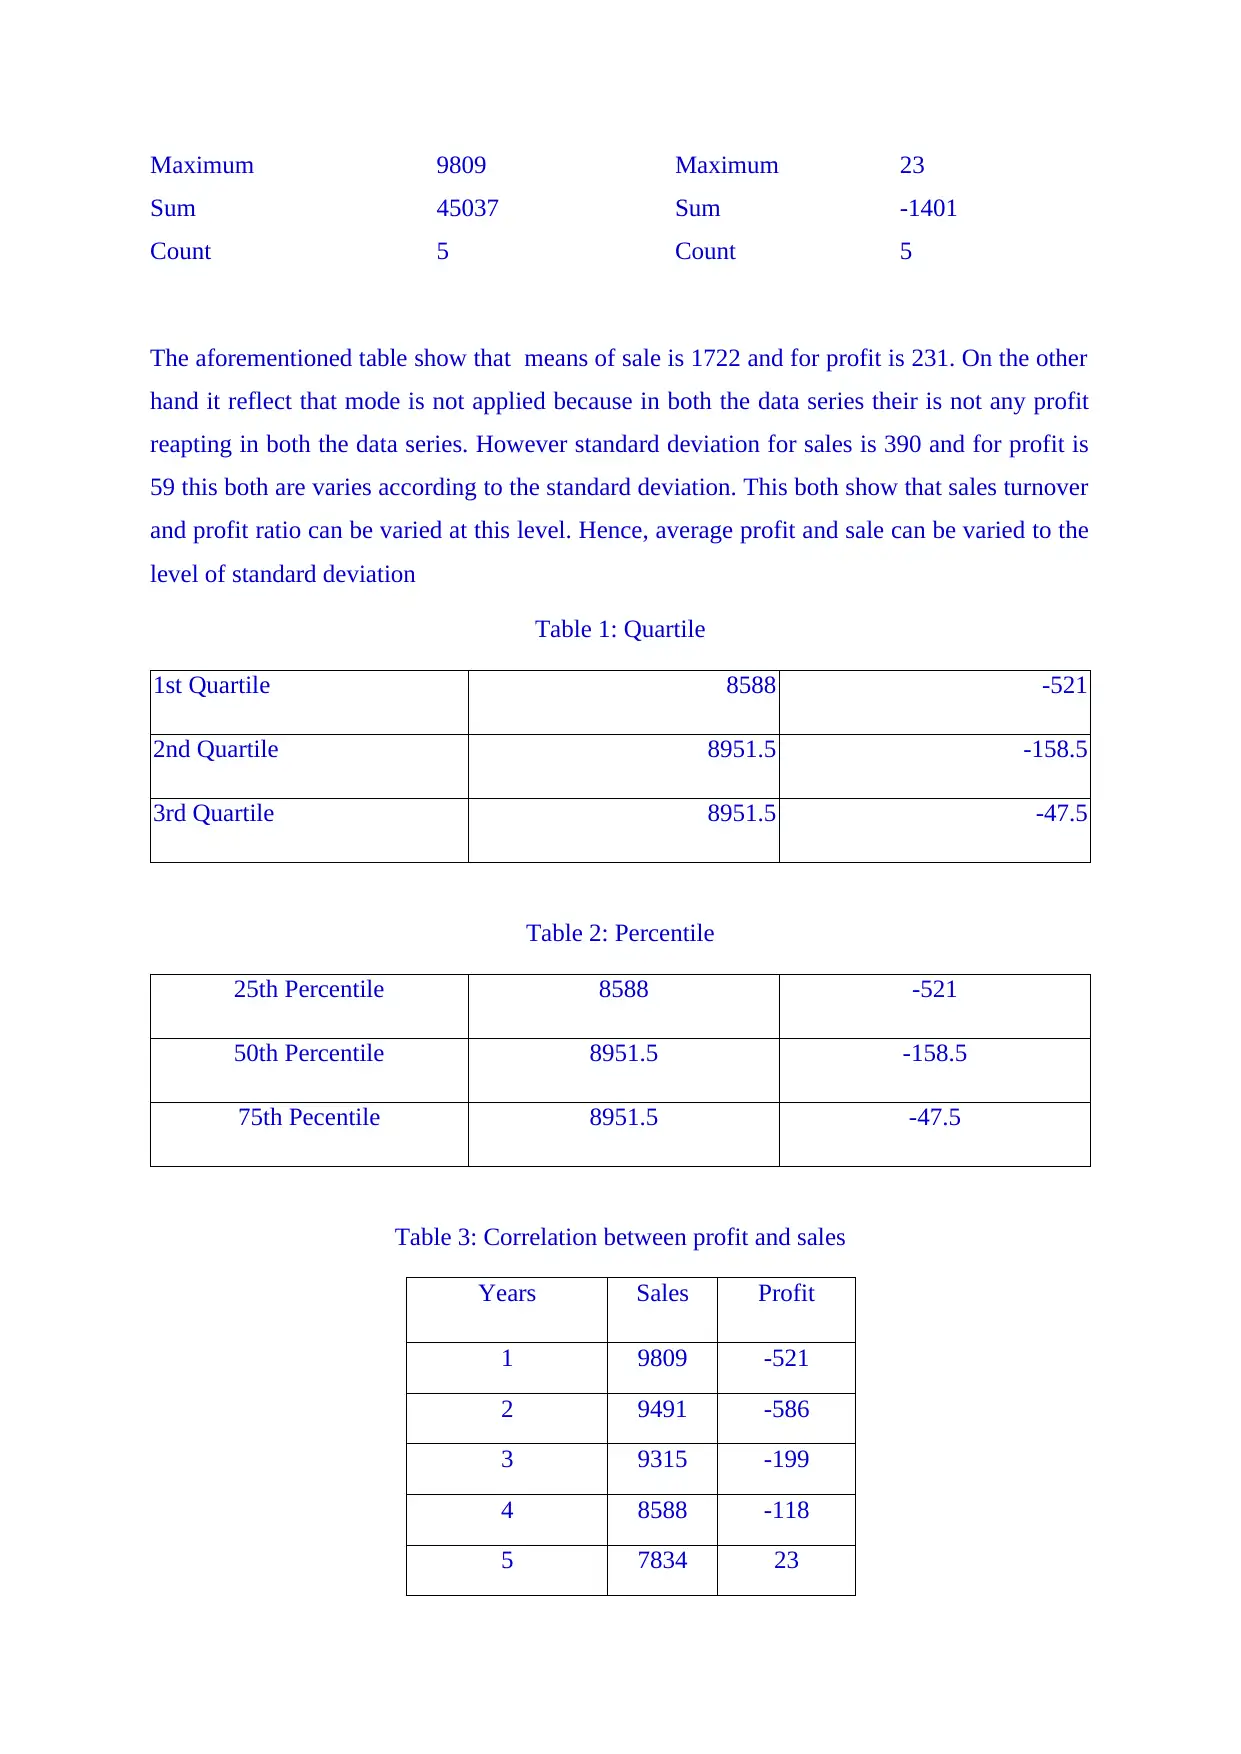
Maximum 9809 Maximum 23
Sum 45037 Sum -1401
Count 5 Count 5
The aforementioned table show that means of sale is 1722 and for profit is 231. On the other
hand it reflect that mode is not applied because in both the data series their is not any profit
reapting in both the data series. However standard deviation for sales is 390 and for profit is
59 this both are varies according to the standard deviation. This both show that sales turnover
and profit ratio can be varied at this level. Hence, average profit and sale can be varied to the
level of standard deviation
Table 1: Quartile
1st Quartile 8588 -521
2nd Quartile 8951.5 -158.5
3rd Quartile 8951.5 -47.5
Table 2: Percentile
25th Percentile 8588 -521
50th Percentile 8951.5 -158.5
75th Pecentile 8951.5 -47.5
Table 3: Correlation between profit and sales
Years Sales Profit
1 9809 -521
2 9491 -586
3 9315 -199
4 8588 -118
5 7834 23
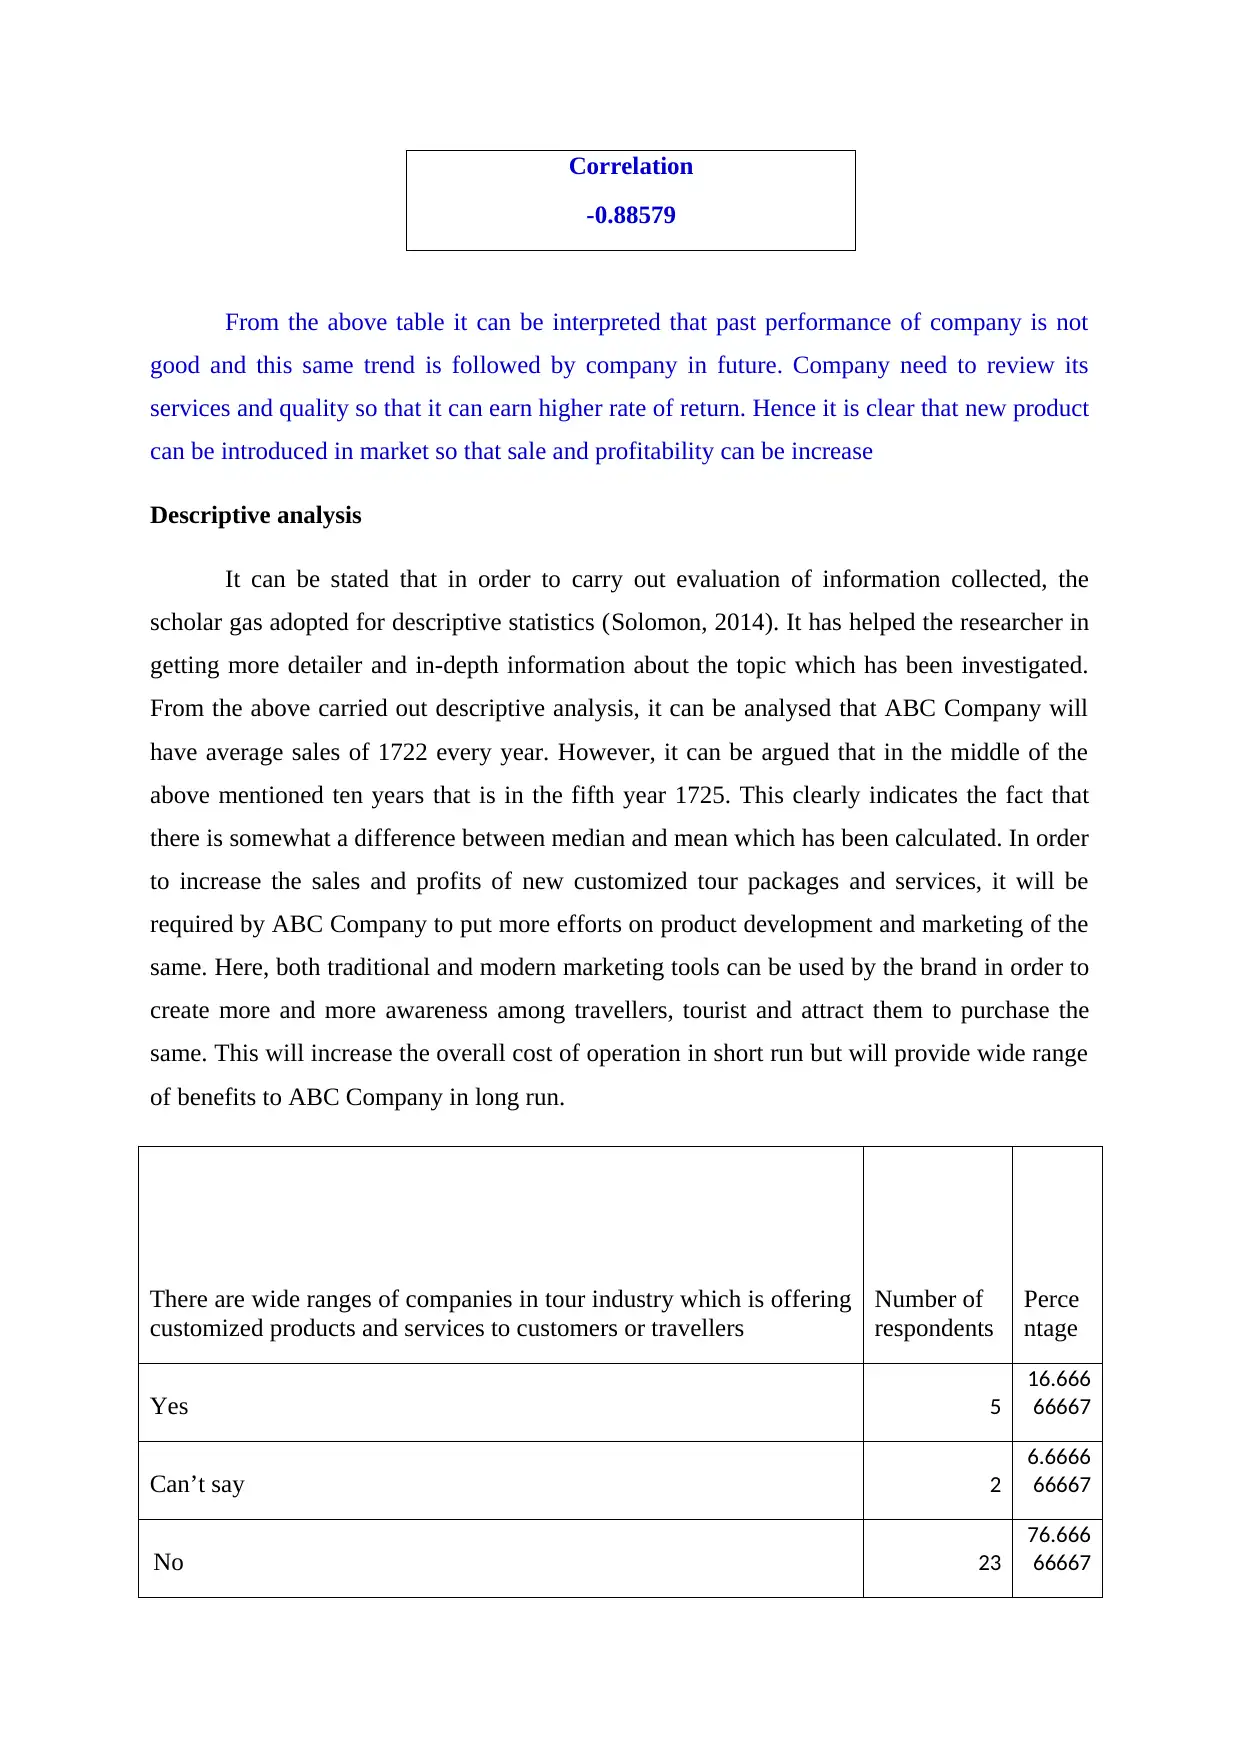
Correlation
-0.88579
From the above table it can be interpreted that past performance of company is not
good and this same trend is followed by company in future. Company need to review its
services and quality so that it can earn higher rate of return. Hence it is clear that new product
can be introduced in market so that sale and profitability can be increase
Descriptive analysis
It can be stated that in order to carry out evaluation of information collected, the
scholar gas adopted for descriptive statistics (Solomon, 2014). It has helped the researcher in
getting more detailer and in-depth information about the topic which has been investigated.
From the above carried out descriptive analysis, it can be analysed that ABC Company will
have average sales of 1722 every year. However, it can be argued that in the middle of the
above mentioned ten years that is in the fifth year 1725. This clearly indicates the fact that
there is somewhat a difference between median and mean which has been calculated. In order
to increase the sales and profits of new customized tour packages and services, it will be
required by ABC Company to put more efforts on product development and marketing of the
same. Here, both traditional and modern marketing tools can be used by the brand in order to
create more and more awareness among travellers, tourist and attract them to purchase the
same. This will increase the overall cost of operation in short run but will provide wide range
of benefits to ABC Company in long run.
There are wide ranges of companies in tour industry which is offering
customized products and services to customers or travellers
Number of
respondents
Perce
ntage
Yes 5
16.666
66667
Can’t say 2
6.6666
66667
No 23
76.666
66667
⊘ This is a preview!⊘
Do you want full access?
Subscribe today to unlock all pages.
Trusted by 1+ million students worldwide
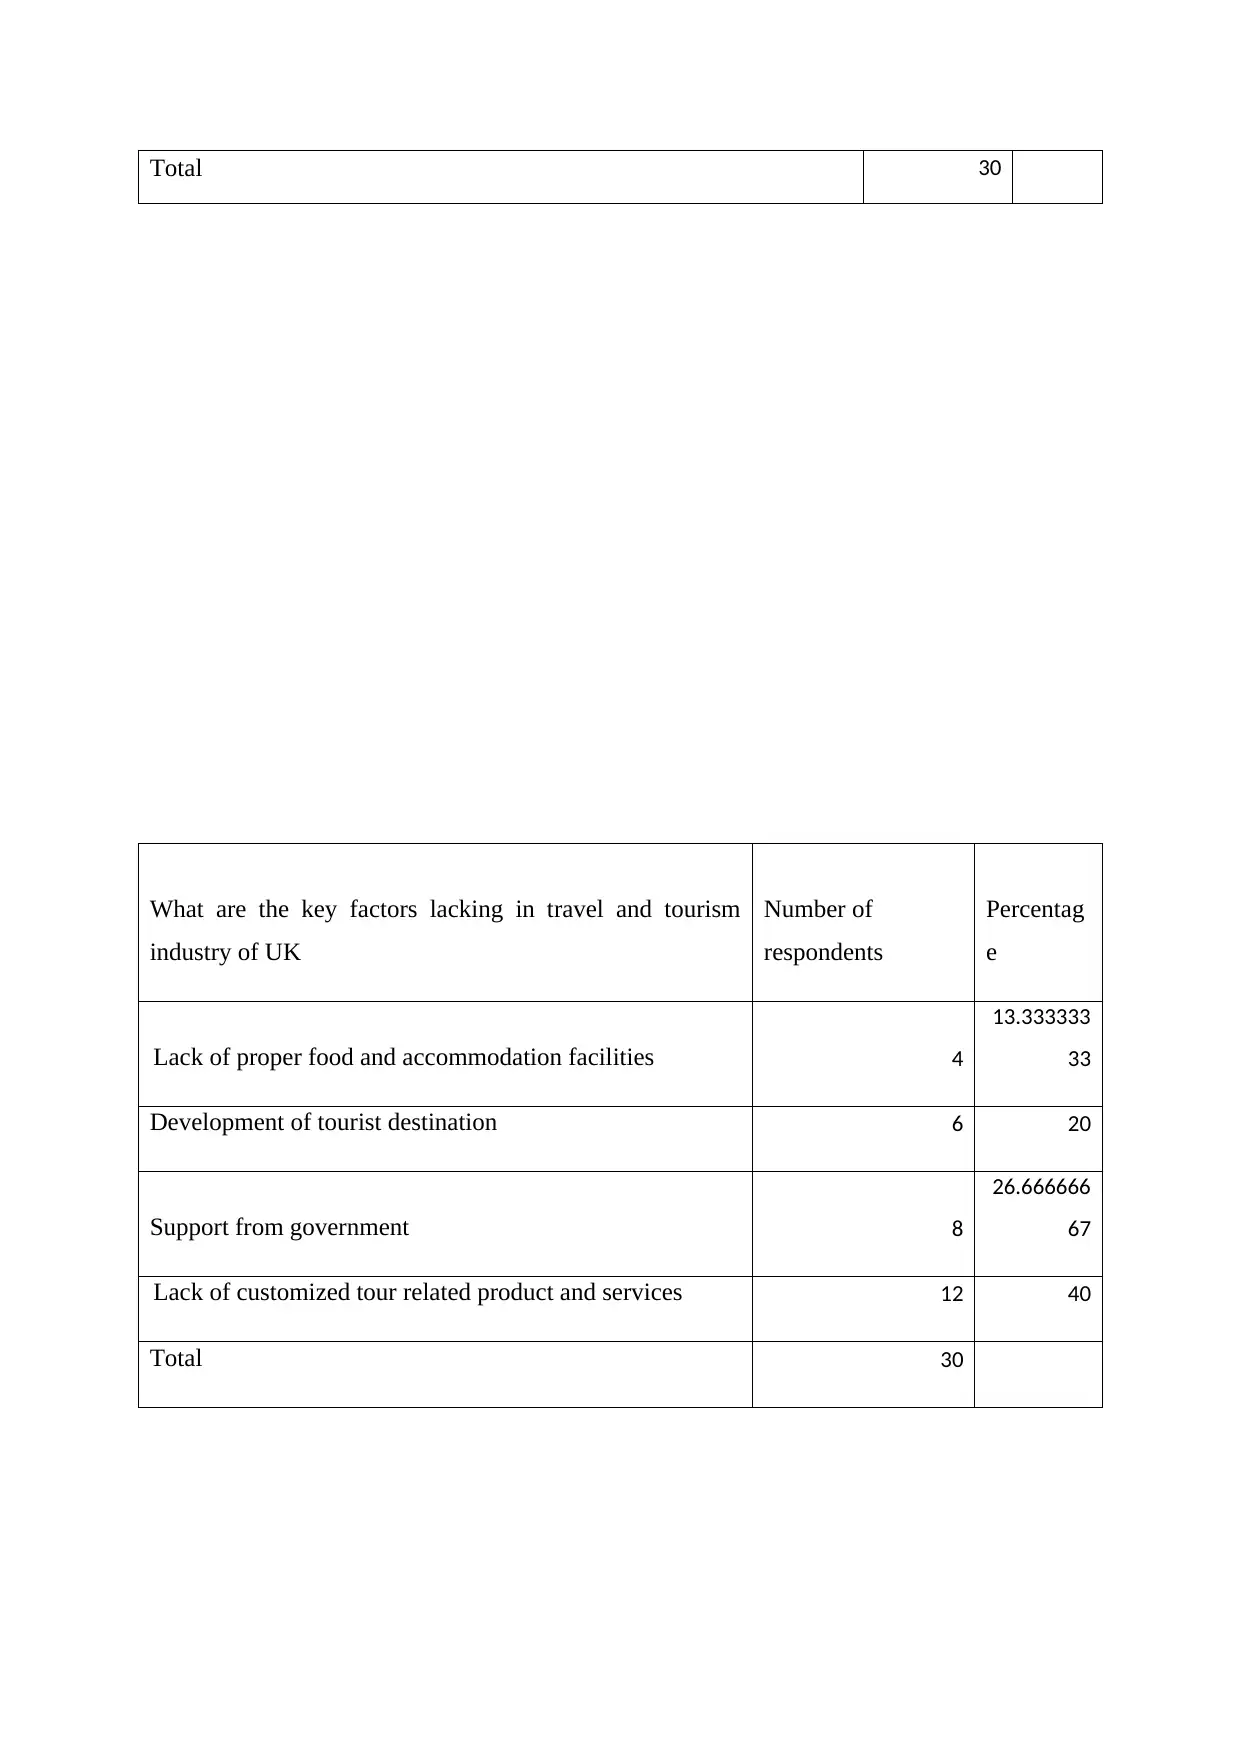
Total 30
What are the key factors lacking in travel and tourism
industry of UK
Number of
respondents
Percentag
e
Lack of proper food and accommodation facilities 4
13.333333
33
Development of tourist destination 6 20
Support from government 8
26.666666
67
Lack of customized tour related product and services 12 40
Total 30
Paraphrase This Document
Need a fresh take? Get an instant paraphrase of this document with our AI Paraphraser
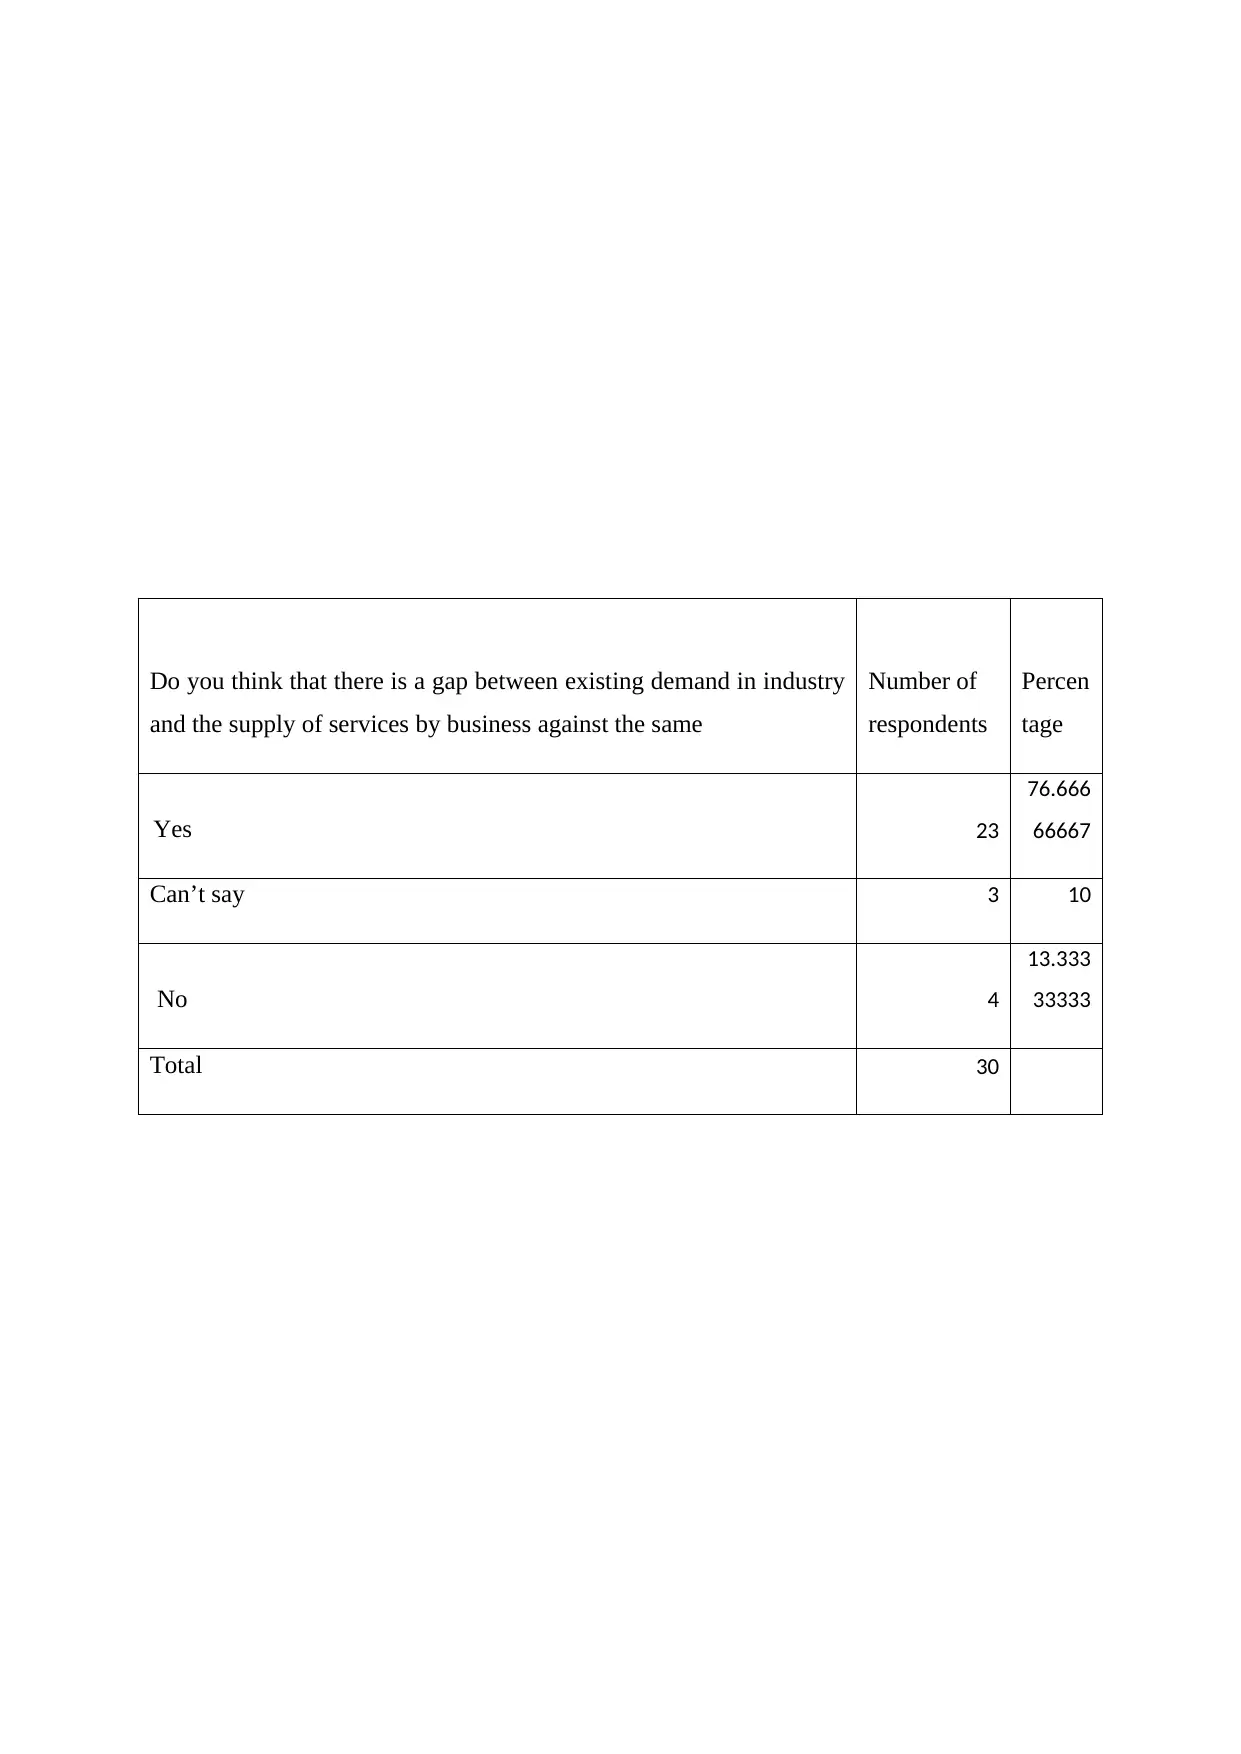
Do you think that there is a gap between existing demand in industry
and the supply of services by business against the same
Number of
respondents
Percen
tage
Yes 23
76.666
66667
Can’t say 3 10
No 4
13.333
33333
Total 30
and the supply of services by business against the same
Number of
respondents
Percen
tage
Yes 23
76.666
66667
Can’t say 3 10
No 4
13.333
33333
Total 30
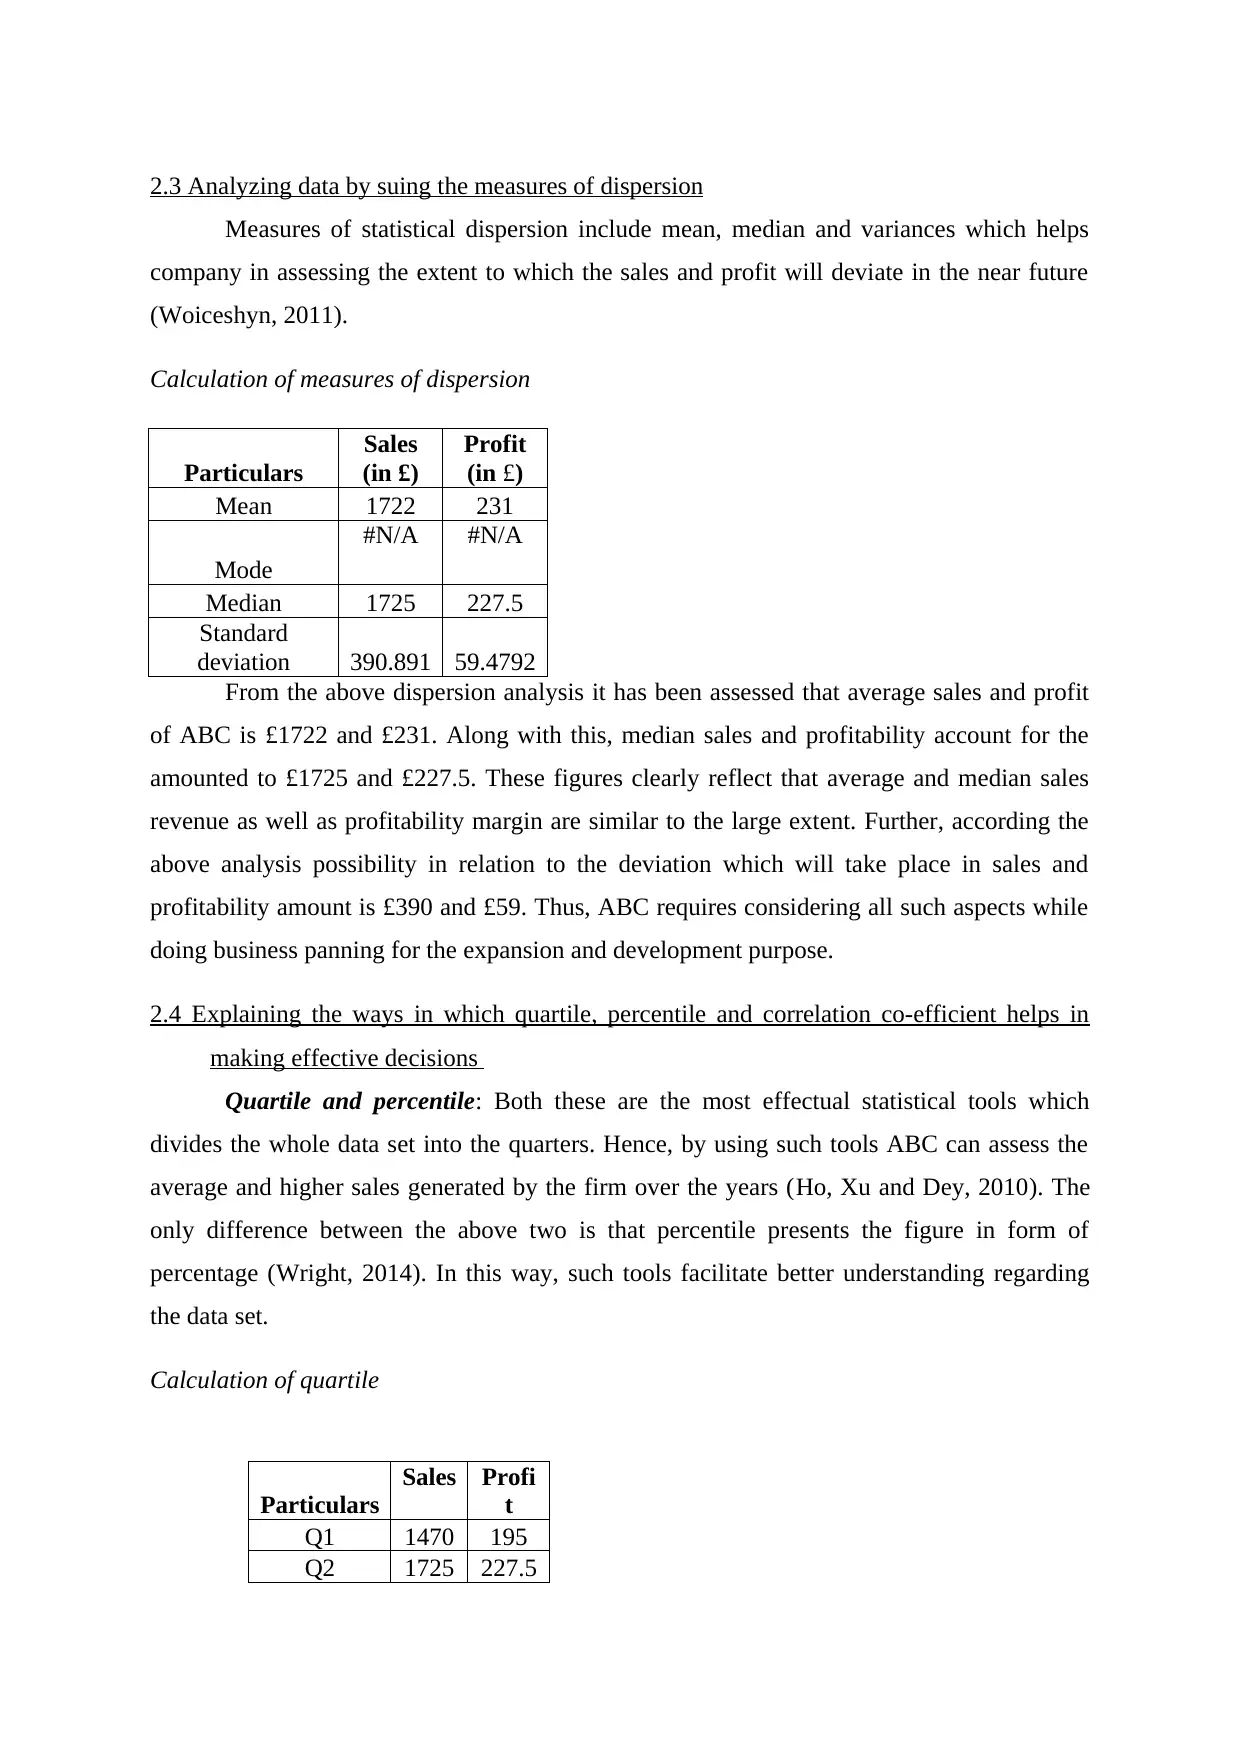
2.3 Analyzing data by suing the measures of dispersion
Measures of statistical dispersion include mean, median and variances which helps
company in assessing the extent to which the sales and profit will deviate in the near future
(Woiceshyn, 2011).
Calculation of measures of dispersion
Particulars
Sales
(in £)
Profit
(in £)
Mean 1722 231
Mode
#N/A #N/A
Median 1725 227.5
Standard
deviation 390.891 59.4792
From the above dispersion analysis it has been assessed that average sales and profit
of ABC is £1722 and £231. Along with this, median sales and profitability account for the
amounted to £1725 and £227.5. These figures clearly reflect that average and median sales
revenue as well as profitability margin are similar to the large extent. Further, according the
above analysis possibility in relation to the deviation which will take place in sales and
profitability amount is £390 and £59. Thus, ABC requires considering all such aspects while
doing business panning for the expansion and development purpose.
2.4 Explaining the ways in which quartile, percentile and correlation co-efficient helps in
making effective decisions
Quartile and percentile: Both these are the most effectual statistical tools which
divides the whole data set into the quarters. Hence, by using such tools ABC can assess the
average and higher sales generated by the firm over the years (Ho, Xu and Dey, 2010). The
only difference between the above two is that percentile presents the figure in form of
percentage (Wright, 2014). In this way, such tools facilitate better understanding regarding
the data set.
Calculation of quartile
Particulars
Sales Profi
t
Q1 1470 195
Q2 1725 227.5
⊘ This is a preview!⊘
Do you want full access?
Subscribe today to unlock all pages.
Trusted by 1+ million students worldwide
1 out of 19
Related Documents


Your All-in-One AI-Powered Toolkit for Academic Success.
+13062052269
info@desklib.com
Available 24*7 on WhatsApp / Email
![[object Object]](/_next/static/media/star-bottom.7253800d.svg)
Unlock your academic potential
Copyright © 2020–2025 A2Z Services. All Rights Reserved. Developed and managed by ZUCOL.