Business Decision Making Report: Fresh Juice Market in the UK Analysis
VerifiedAdded on 2019/12/03
|21
|4946
|386
Report
AI Summary
This report delves into the realm of business decision-making within the context of the fresh juice market, employing both primary and secondary research to understand consumer profiles, preferences, and buying behaviors. It presents a detailed survey methodology, including a sampling frame and a questionnaire designed to gather relevant data. The collected data is summarized using frequency tables, averages, and measures of dispersion, offering valuable management information. Furthermore, the report explains the use of quartiles, percentiles, and correlation in decision-making within the fresh juice market. Data visualization is achieved through the creation of charts and trend lines using spreadsheets, supporting the analysis and conclusions drawn. The report also includes a PowerPoint presentation summarizing the analysis and a formal business report, culminating in a project plan for the launch of a new fresh juice drink, complete with an analysis of projected revenues and costs to assess financial viability. The report utilizes various statistical tools to support the analysis and provide recommendations for the business.

Business Decision Making
Paraphrase This Document
Need a fresh take? Get an instant paraphrase of this document with our AI Paraphraser
TABLE OF CONTENTS
INTRODUCTION...........................................................................................................................3
TASK- 1...........................................................................................................................................3
A. Planning and carrying out secondary and primary research to determine the consumer
profile,..........................................................................................................................................3
preference, attitude and buying behaviour related to fresh juice drinks (1.1).............................3
B. Presenting a survey methodology and sampling frame (1.2)..................................................4
C. Designing a questionnaire.......................................................................................................4
TASK 2............................................................................................................................................6
A. Summarizing the data collected from the primary and secondary research using frequency
tables, representative values (averages) and measures of dispersion and interpret the results as
relevant management information for the fresh juice drinks market. (2.1, 2.2, 2.3)...................6
B. Explaining how quartiles, percentiles and correlation can be used to aid decision making in
the fresh juice drinks market. (P2.4)..........................................................................................11
TASK 3..........................................................................................................................................12
A. Creating charts using a spreadsheet to support your analysis of the fresh juice drinks market
and drawing valid conclusions on the information produced. (3.1)..........................................12
B. Creating a trend line on an XY-plot using a spreadsheet and use it to forecast information
useful to the analysis of the fresh juice drinks market. (3.2).....................................................15
C. Power point presentation based on the analysis of the fresh juice drinks market in the UK.
(3.3) Presented in PPT...............................................................................................................16
D. Producing a formal business report for the fresh juice drinks market (3.4).........................16
TASK 4..........................................................................................................................................17
Preparing a project plan for the launch of a new fresh juice drink based and including an
analysis based on the projected revenues and costs regarding the financial viability of the
project. (4.1, 4.2, 4.3).................................................................................................................17
CONCLUSION..............................................................................................................................19
REFERENCE.................................................................................................................................20
Table 1:Responses of Consumers....................................................................................................7
Table 2:Sales and profit figures.....................................................................................................10
INDEX OF TABLES
Table 3: Descriptive statistics........................................................................................................11
Table 4: Calculation of Quartile and Percentile............................................................................12
Table 5: Correlation between sales and profit...............................................................................12
Table 6: Sales frequency distribution............................................................................................13
Table 7: Profit Frequency Distribution..........................................................................................14
Table 8: Project Plan......................................................................................................................18
Table 9: Calculation of NPV.........................................................................................................20
TABLE OF FIGURES
Figure 1: Sales Histogram.............................................................................................................14
Figure 2: Profit Histogram.............................................................................................................15
Figure 3: Trend lines......................................................................................................................16
Figure 4: Gantt Chart.....................................................................................................................19
Figure 5: Critical Path Diagram.....................................................................................................19
⊘ This is a preview!⊘
Do you want full access?
Subscribe today to unlock all pages.
Trusted by 1+ million students worldwide
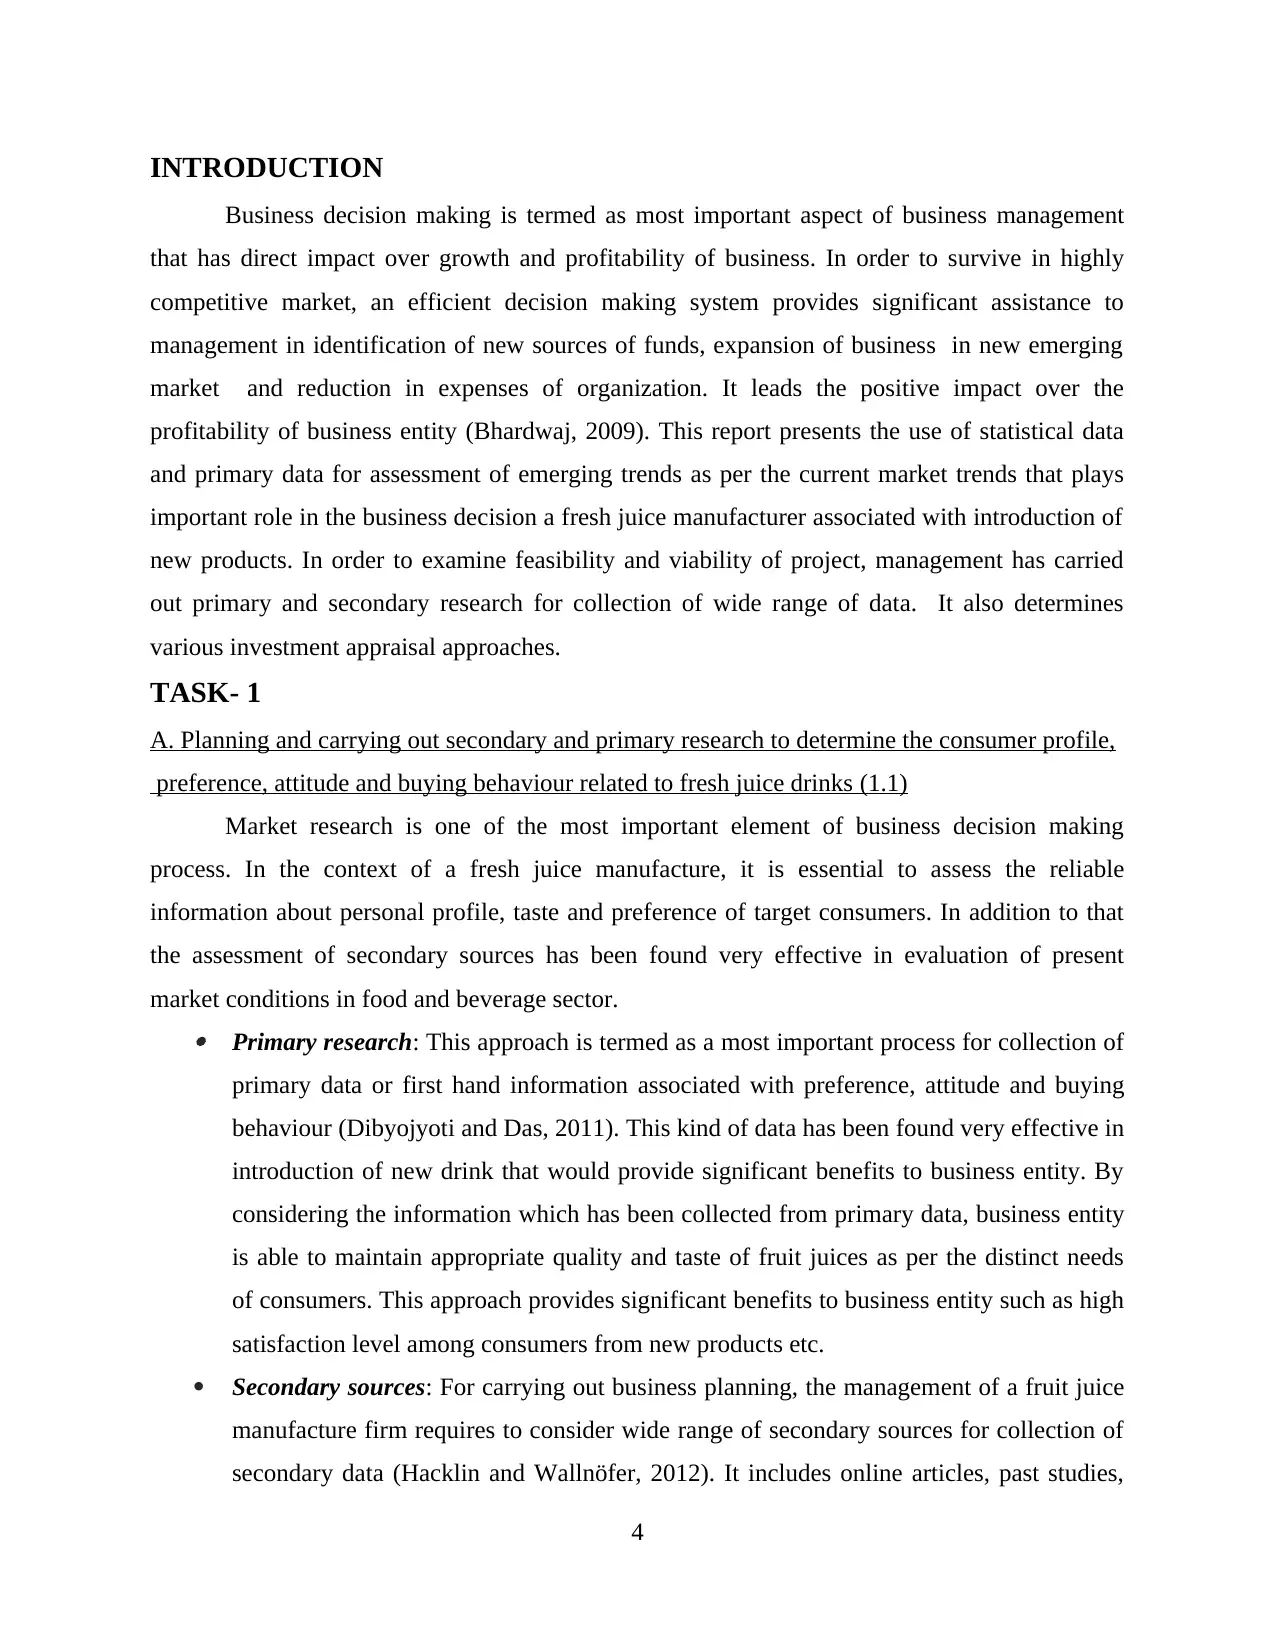
INTRODUCTION
Business decision making is termed as most important aspect of business management
that has direct impact over growth and profitability of business. In order to survive in highly
competitive market, an efficient decision making system provides significant assistance to
management in identification of new sources of funds, expansion of business in new emerging
market and reduction in expenses of organization. It leads the positive impact over the
profitability of business entity (Bhardwaj, 2009). This report presents the use of statistical data
and primary data for assessment of emerging trends as per the current market trends that plays
important role in the business decision a fresh juice manufacturer associated with introduction of
new products. In order to examine feasibility and viability of project, management has carried
out primary and secondary research for collection of wide range of data. It also determines
various investment appraisal approaches.
TASK- 1
A. Planning and carrying out secondary and primary research to determine the consumer profile,
preference, attitude and buying behaviour related to fresh juice drinks (1.1)
Market research is one of the most important element of business decision making
process. In the context of a fresh juice manufacture, it is essential to assess the reliable
information about personal profile, taste and preference of target consumers. In addition to that
the assessment of secondary sources has been found very effective in evaluation of present
market conditions in food and beverage sector. Primary research: This approach is termed as a most important process for collection of
primary data or first hand information associated with preference, attitude and buying
behaviour (Dibyojyoti and Das, 2011). This kind of data has been found very effective in
introduction of new drink that would provide significant benefits to business entity. By
considering the information which has been collected from primary data, business entity
is able to maintain appropriate quality and taste of fruit juices as per the distinct needs
of consumers. This approach provides significant benefits to business entity such as high
satisfaction level among consumers from new products etc.
Secondary sources: For carrying out business planning, the management of a fruit juice
manufacture firm requires to consider wide range of secondary sources for collection of
secondary data (Hacklin and Wallnöfer, 2012). It includes online articles, past studies,
4
Paraphrase This Document
Need a fresh take? Get an instant paraphrase of this document with our AI Paraphraser
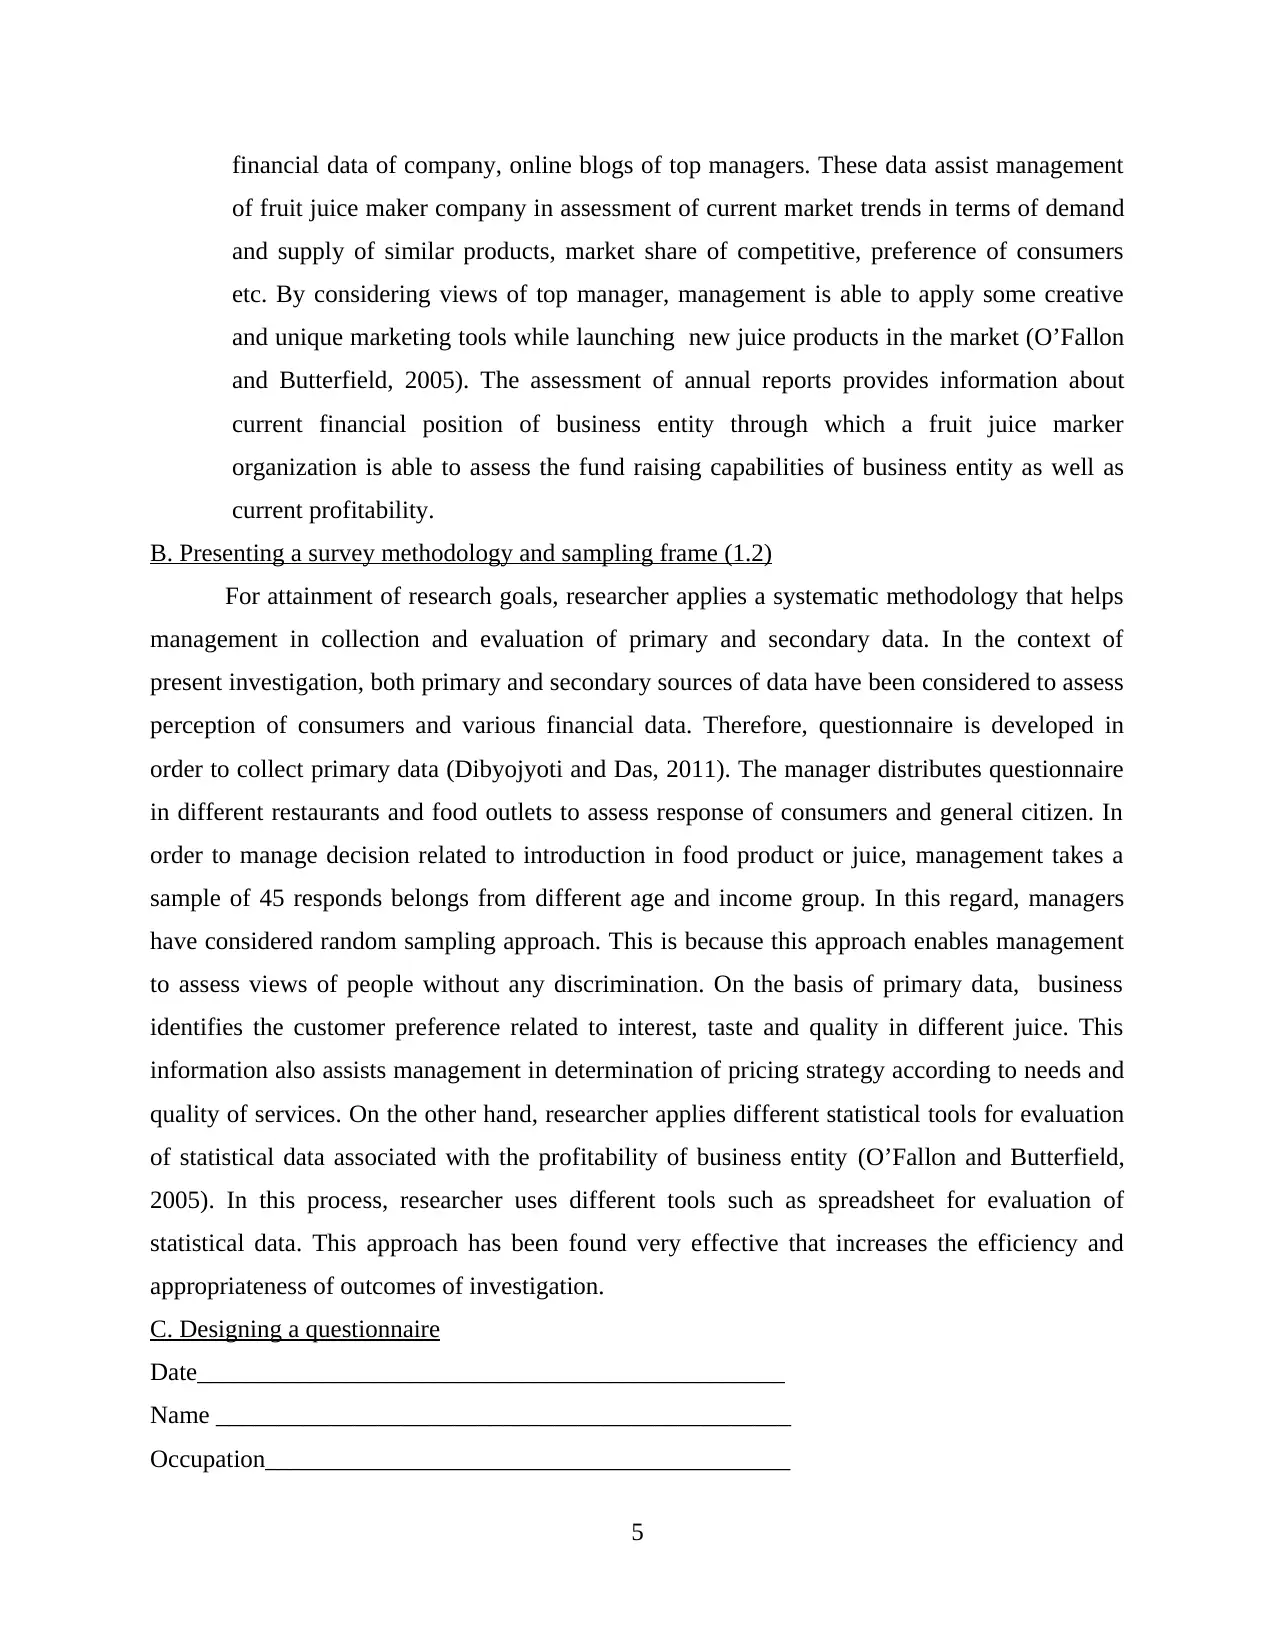
financial data of company, online blogs of top managers. These data assist management
of fruit juice maker company in assessment of current market trends in terms of demand
and supply of similar products, market share of competitive, preference of consumers
etc. By considering views of top manager, management is able to apply some creative
and unique marketing tools while launching new juice products in the market (O’Fallon
and Butterfield, 2005). The assessment of annual reports provides information about
current financial position of business entity through which a fruit juice marker
organization is able to assess the fund raising capabilities of business entity as well as
current profitability.
B. Presenting a survey methodology and sampling frame (1.2)
For attainment of research goals, researcher applies a systematic methodology that helps
management in collection and evaluation of primary and secondary data. In the context of
present investigation, both primary and secondary sources of data have been considered to assess
perception of consumers and various financial data. Therefore, questionnaire is developed in
order to collect primary data (Dibyojyoti and Das, 2011). The manager distributes questionnaire
in different restaurants and food outlets to assess response of consumers and general citizen. In
order to manage decision related to introduction in food product or juice, management takes a
sample of 45 responds belongs from different age and income group. In this regard, managers
have considered random sampling approach. This is because this approach enables management
to assess views of people without any discrimination. On the basis of primary data, business
identifies the customer preference related to interest, taste and quality in different juice. This
information also assists management in determination of pricing strategy according to needs and
quality of services. On the other hand, researcher applies different statistical tools for evaluation
of statistical data associated with the profitability of business entity (O’Fallon and Butterfield,
2005). In this process, researcher uses different tools such as spreadsheet for evaluation of
statistical data. This approach has been found very effective that increases the efficiency and
appropriateness of outcomes of investigation.
C. Designing a questionnaire
Date_______________________________________________
Name ______________________________________________
Occupation__________________________________________
5
1. What is your age group?
16 - 20 years
21 - 25 years
26 - 30 years
31- 35 years
Above 35 years
2. Are you regularly consume different kinds of juice products?
Yes
No
3. Are you satisfied with the pricing of different juices offered by company?
Highly satisfied
Satisfied
Neutral
Unsatisfied
Highly unsatisfied
4. What is the flavor of juice you always preferred?
Lemon
Orange
Strawberry
Pineapple
5. What is the most important factor that influences your decision regarding the selection of juice
manufacturing company?
Goodwill of firm
Pricing
Taste and quality
Variety of Juices
6. Do you think that quality and taste of juices of Fresh Juice Manufacturing Company meets
your expectations?
Highly satisfied
Satisfied
Neutral
6
⊘ This is a preview!⊘
Do you want full access?
Subscribe today to unlock all pages.
Trusted by 1+ million students worldwide
Unsatisfied
Highly unsatisfied
7. How does a juice manufacturing organization influence new consumers?
With great taste
With attractive pricing
With a long product range
With creative marketing tools
8. Do you think that innovative marketing techniques influence your decision regarding the
selection of juice manufacturing company?
Yes
No
TASK 2
A. Summarizing the data collected from the primary and secondary research using frequency
tables, representative values (averages) and measures of dispersion and interpret the results as
relevant management information for the fresh juice drinks market. (2.1, 2.2, 2.3)
Summarizing the data collected from different primary and secondary sources
Data collected from primary sources
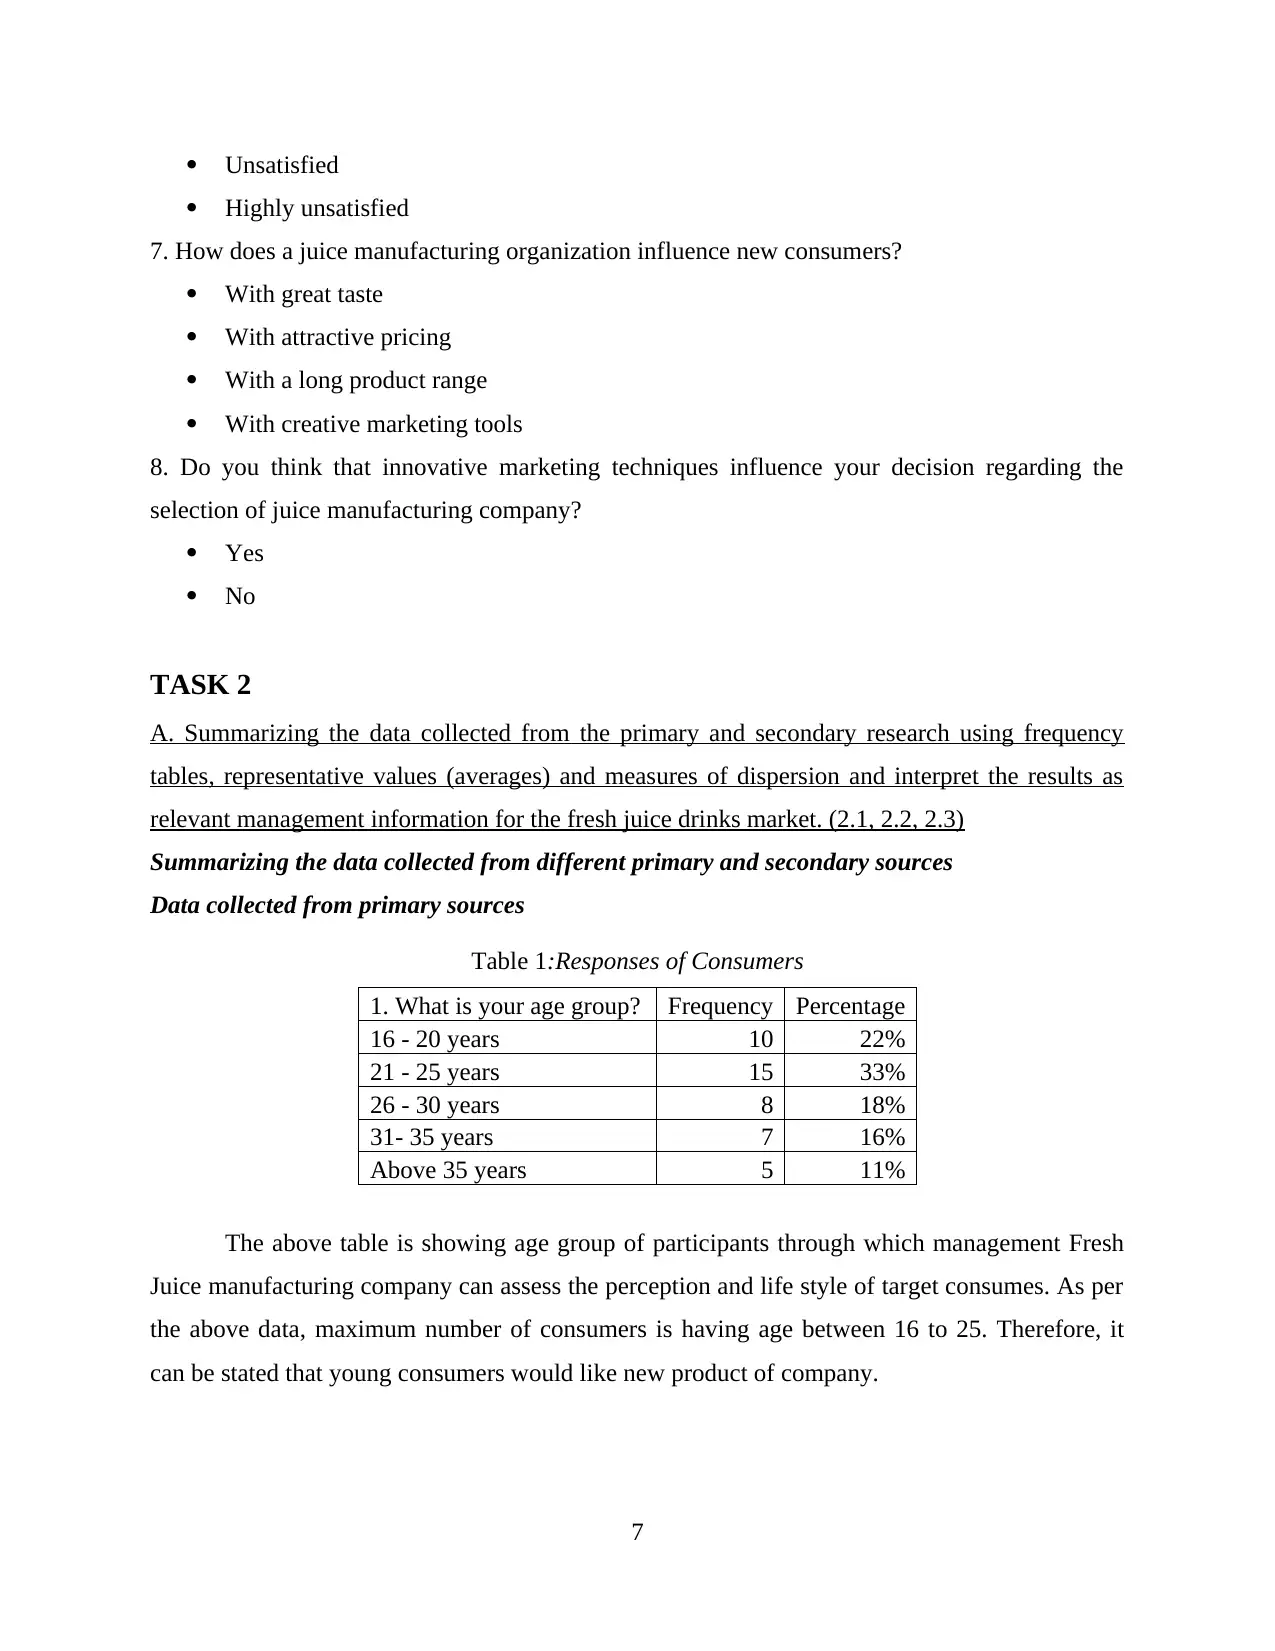
Table 1:Responses of Consumers
1. What is your age group? Frequency Percentage
16 - 20 years 10 22%
21 - 25 years 15 33%
26 - 30 years 8 18%
31- 35 years 7 16%
Above 35 years 5 11%
The above table is showing age group of participants through which management Fresh
Juice manufacturing company can assess the perception and life style of target consumes. As per
the above data, maximum number of consumers is having age between 16 to 25. Therefore, it
can be stated that young consumers would like new product of company.
7
Highly unsatisfied
7. How does a juice manufacturing organization influence new consumers?
With great taste
With attractive pricing
With a long product range
With creative marketing tools
8. Do you think that innovative marketing techniques influence your decision regarding the
selection of juice manufacturing company?
Yes
No
TASK 2
A. Summarizing the data collected from the primary and secondary research using frequency
tables, representative values (averages) and measures of dispersion and interpret the results as
relevant management information for the fresh juice drinks market. (2.1, 2.2, 2.3)
Summarizing the data collected from different primary and secondary sources
Data collected from primary sources
Table 1:Responses of Consumers
1. What is your age group? Frequency Percentage
16 - 20 years 10 22%
21 - 25 years 15 33%
26 - 30 years 8 18%
31- 35 years 7 16%
Above 35 years 5 11%
The above table is showing age group of participants through which management Fresh
Juice manufacturing company can assess the perception and life style of target consumes. As per
the above data, maximum number of consumers is having age between 16 to 25. Therefore, it
can be stated that young consumers would like new product of company.
7
Paraphrase This Document
Need a fresh take? Get an instant paraphrase of this document with our AI Paraphraser
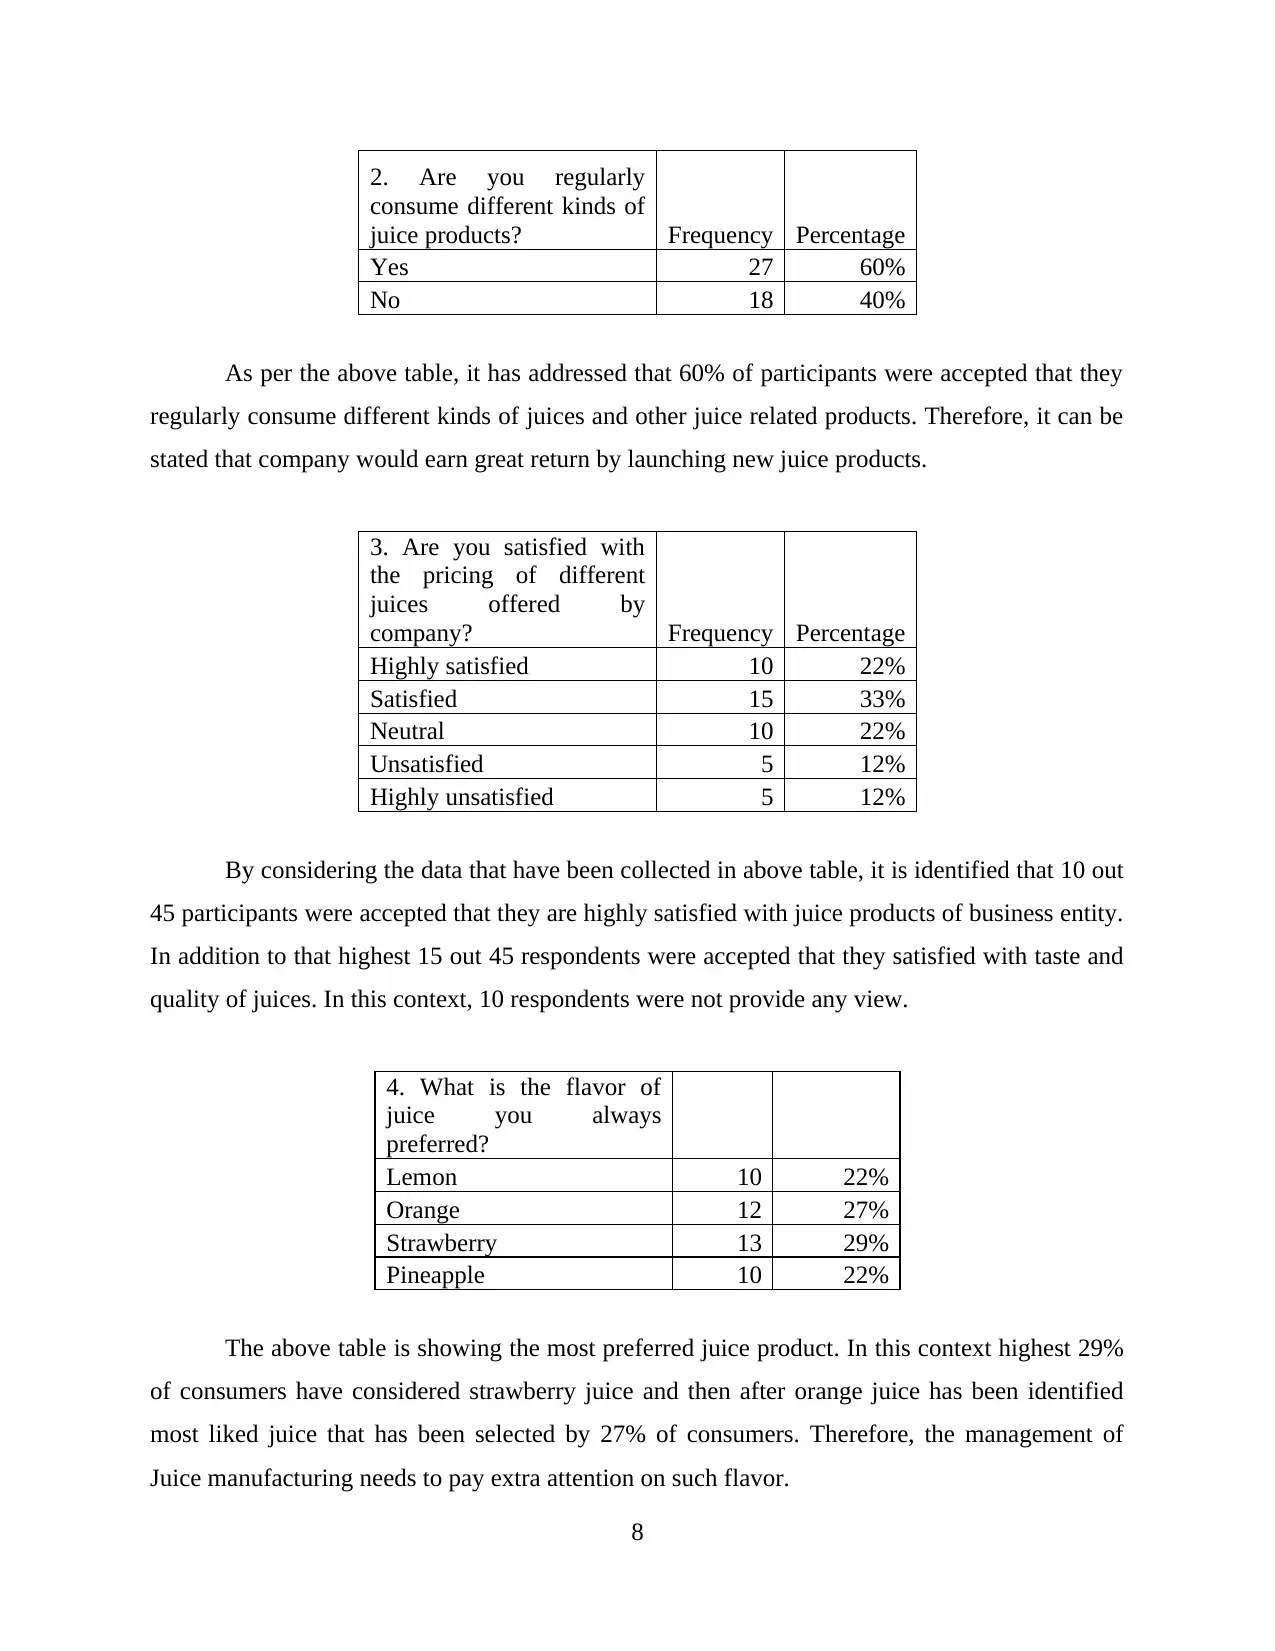
2. Are you regularly
consume different kinds of
juice products? Frequency Percentage
Yes 27 60%
No 18 40%
As per the above table, it has addressed that 60% of participants were accepted that they
regularly consume different kinds of juices and other juice related products. Therefore, it can be
stated that company would earn great return by launching new juice products.
3. Are you satisfied with
the pricing of different
juices offered by
company? Frequency Percentage
Highly satisfied 10 22%
Satisfied 15 33%
Neutral 10 22%
Unsatisfied 5 12%
Highly unsatisfied 5 12%
By considering the data that have been collected in above table, it is identified that 10 out
45 participants were accepted that they are highly satisfied with juice products of business entity.
In addition to that highest 15 out 45 respondents were accepted that they satisfied with taste and
quality of juices. In this context, 10 respondents were not provide any view.
4. What is the flavor of
juice you always
preferred?
Lemon 10 22%
Orange 12 27%
Strawberry 13 29%
Pineapple 10 22%
The above table is showing the most preferred juice product. In this context highest 29%
of consumers have considered strawberry juice and then after orange juice has been identified
most liked juice that has been selected by 27% of consumers. Therefore, the management of
Juice manufacturing needs to pay extra attention on such flavor.
8
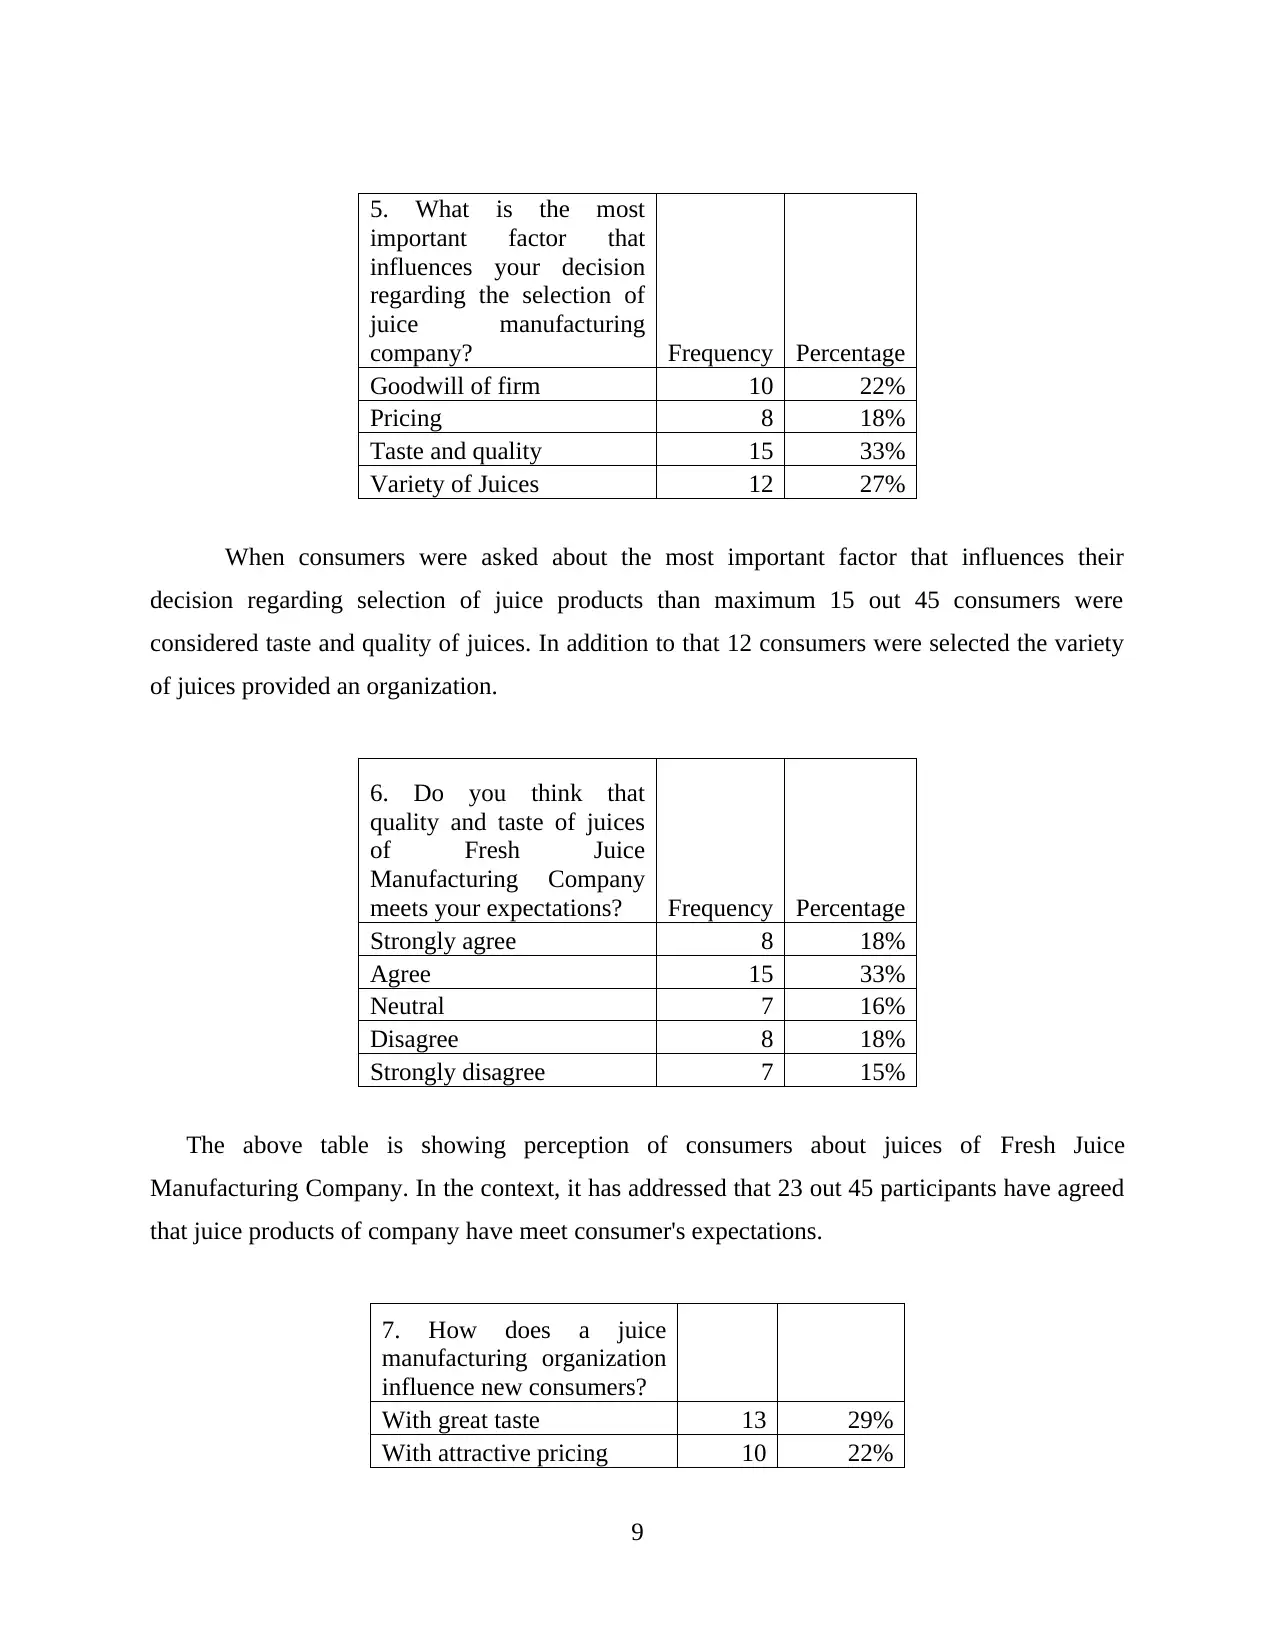
5. What is the most
important factor that
influences your decision
regarding the selection of
juice manufacturing
company? Frequency Percentage
Goodwill of firm 10 22%
Pricing 8 18%
Taste and quality 15 33%
Variety of Juices 12 27%
When consumers were asked about the most important factor that influences their
decision regarding selection of juice products than maximum 15 out 45 consumers were
considered taste and quality of juices. In addition to that 12 consumers were selected the variety
of juices provided an organization.
6. Do you think that
quality and taste of juices
of Fresh Juice
Manufacturing Company
meets your expectations? Frequency Percentage
Strongly agree 8 18%
Agree 15 33%
Neutral 7 16%
Disagree 8 18%
Strongly disagree 7 15%
The above table is showing perception of consumers about juices of Fresh Juice
Manufacturing Company. In the context, it has addressed that 23 out 45 participants have agreed
that juice products of company have meet consumer's expectations.
7. How does a juice
manufacturing organization
influence new consumers?
With great taste 13 29%
With attractive pricing 10 22%
9
⊘ This is a preview!⊘
Do you want full access?
Subscribe today to unlock all pages.
Trusted by 1+ million students worldwide
With a long product range 10 22%
With creative marketing
tools 12 27%
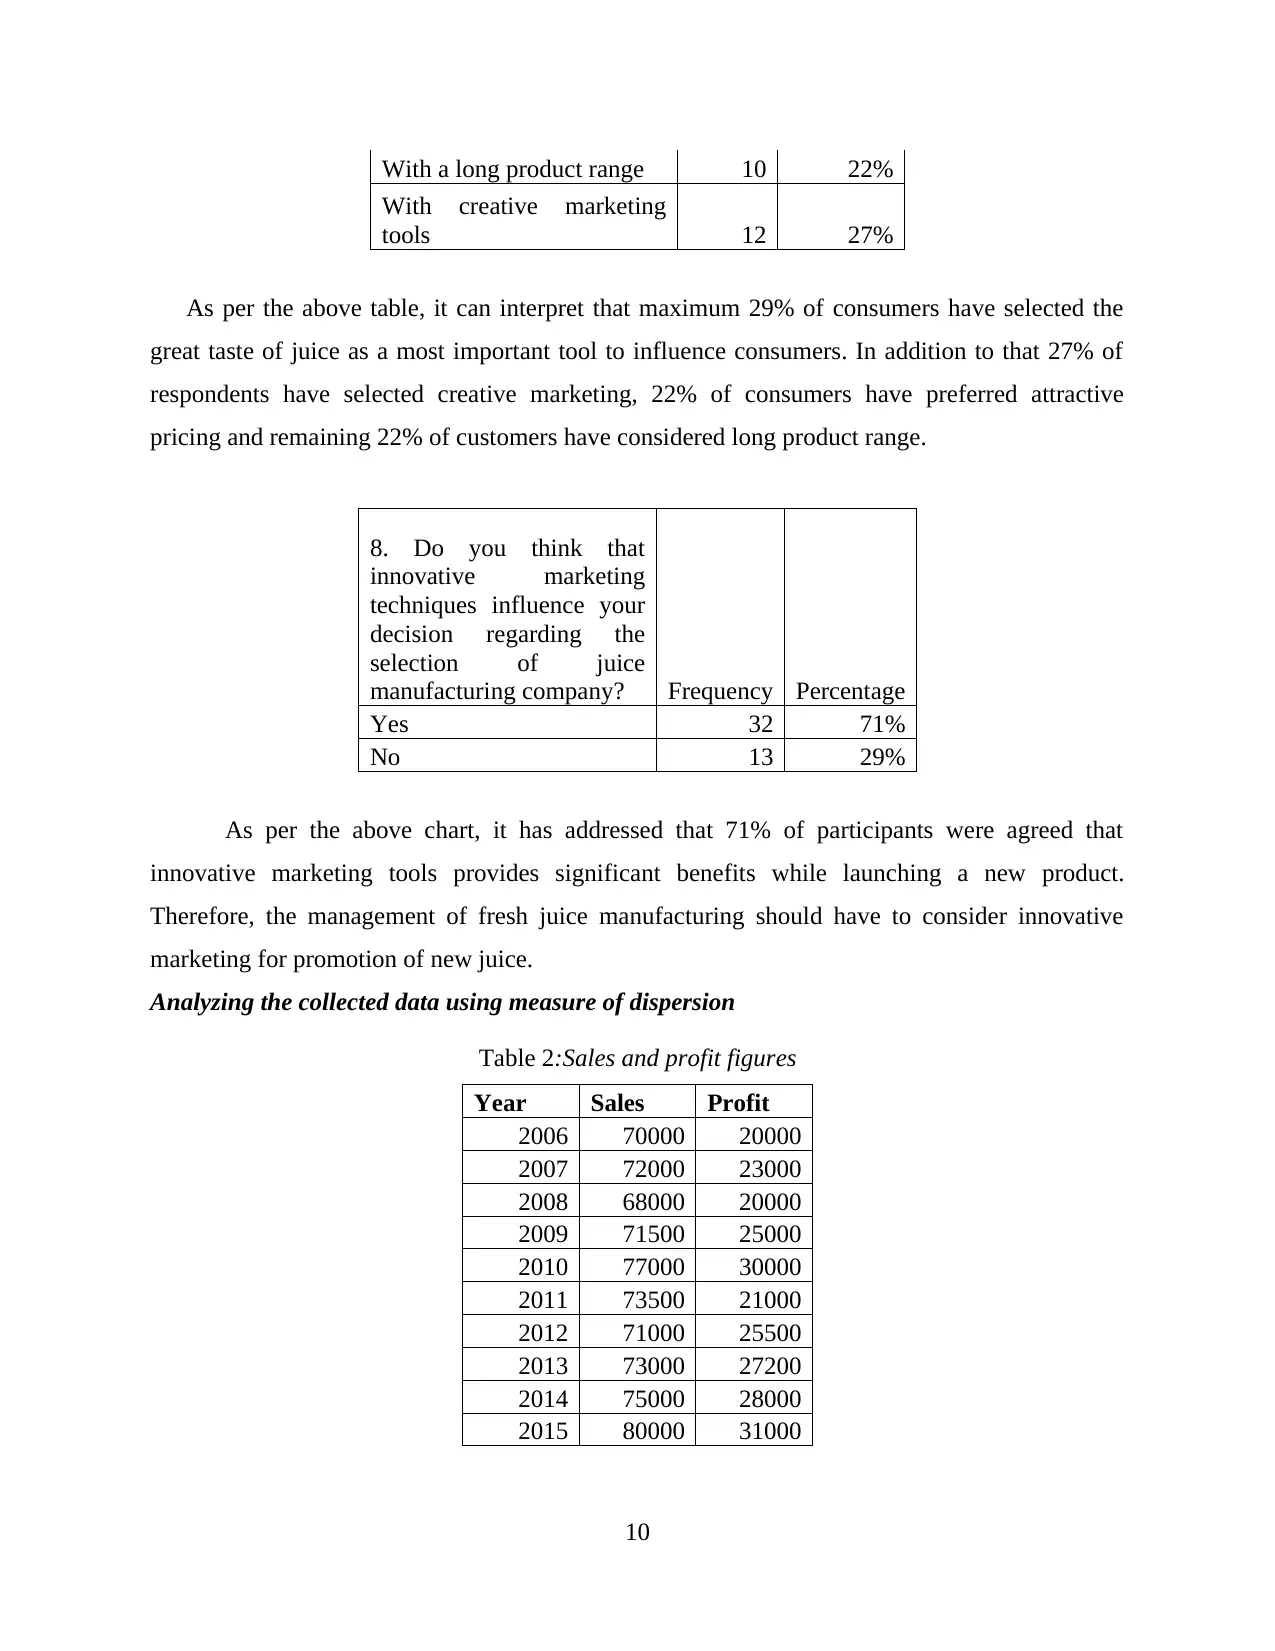
As per the above table, it can interpret that maximum 29% of consumers have selected the
great taste of juice as a most important tool to influence consumers. In addition to that 27% of
respondents have selected creative marketing, 22% of consumers have preferred attractive
pricing and remaining 22% of customers have considered long product range.
8. Do you think that
innovative marketing
techniques influence your
decision regarding the
selection of juice
manufacturing company? Frequency Percentage
Yes 32 71%
No 13 29%
As per the above chart, it has addressed that 71% of participants were agreed that
innovative marketing tools provides significant benefits while launching a new product.
Therefore, the management of fresh juice manufacturing should have to consider innovative
marketing for promotion of new juice.
Analyzing the collected data using measure of dispersion
Table 2:Sales and profit figures
Year Sales Profit
2006 70000 20000
2007 72000 23000
2008 68000 20000
2009 71500 25000
2010 77000 30000
2011 73500 21000
2012 71000 25500
2013 73000 27200
2014 75000 28000
2015 80000 31000
10
With creative marketing
tools 12 27%
As per the above table, it can interpret that maximum 29% of consumers have selected the
great taste of juice as a most important tool to influence consumers. In addition to that 27% of
respondents have selected creative marketing, 22% of consumers have preferred attractive
pricing and remaining 22% of customers have considered long product range.
8. Do you think that
innovative marketing
techniques influence your
decision regarding the
selection of juice
manufacturing company? Frequency Percentage
Yes 32 71%
No 13 29%
As per the above chart, it has addressed that 71% of participants were agreed that
innovative marketing tools provides significant benefits while launching a new product.
Therefore, the management of fresh juice manufacturing should have to consider innovative
marketing for promotion of new juice.
Analyzing the collected data using measure of dispersion
Table 2:Sales and profit figures
Year Sales Profit
2006 70000 20000
2007 72000 23000
2008 68000 20000
2009 71500 25000
2010 77000 30000
2011 73500 21000
2012 71000 25500
2013 73000 27200
2014 75000 28000
2015 80000 31000
10
Paraphrase This Document
Need a fresh take? Get an instant paraphrase of this document with our AI Paraphraser
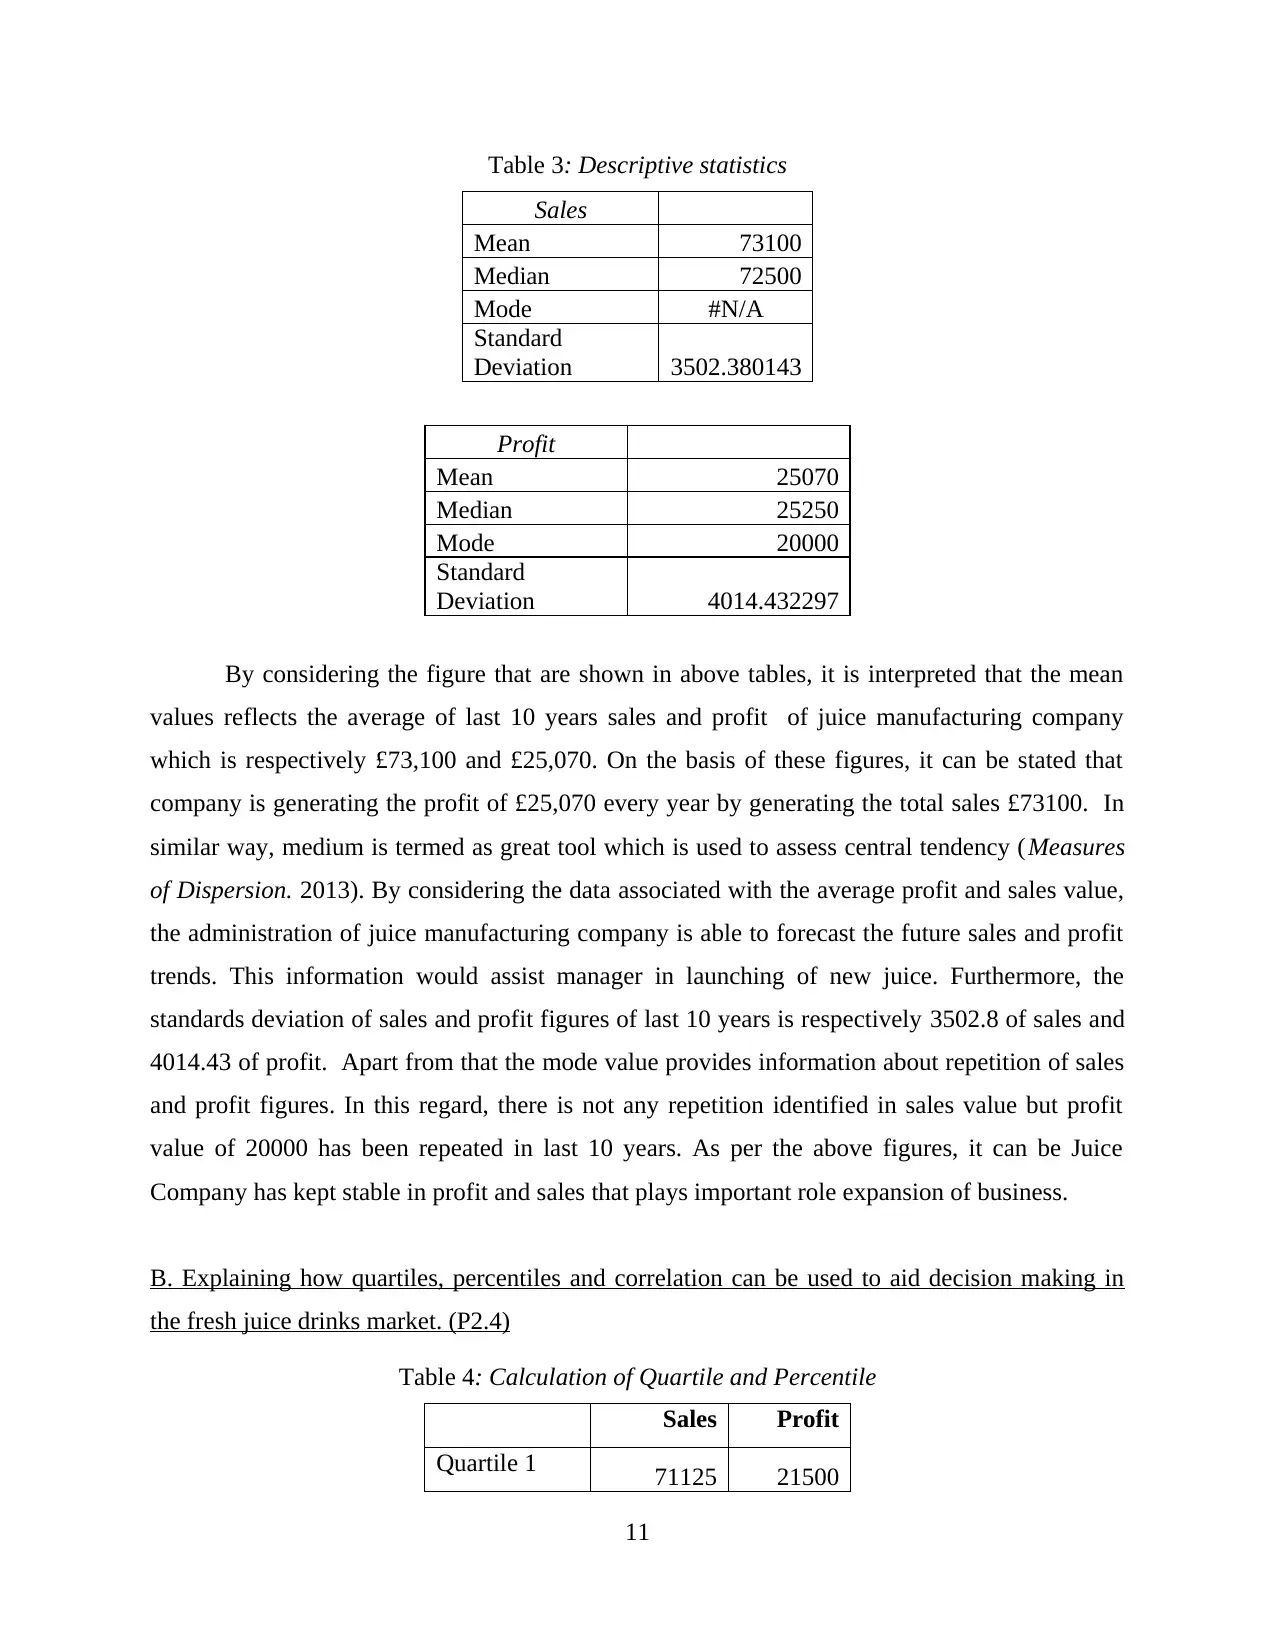
Table 3: Descriptive statistics
Sales
Mean 73100
Median 72500
Mode #N/A
Standard
Deviation 3502.380143
Profit
Mean 25070
Median 25250
Mode 20000
Standard
Deviation 4014.432297
By considering the figure that are shown in above tables, it is interpreted that the mean
values reflects the average of last 10 years sales and profit of juice manufacturing company
which is respectively £73,100 and £25,070. On the basis of these figures, it can be stated that
company is generating the profit of £25,070 every year by generating the total sales £73100. In
similar way, medium is termed as great tool which is used to assess central tendency (Measures
of Dispersion. 2013). By considering the data associated with the average profit and sales value,
the administration of juice manufacturing company is able to forecast the future sales and profit
trends. This information would assist manager in launching of new juice. Furthermore, the
standards deviation of sales and profit figures of last 10 years is respectively 3502.8 of sales and
4014.43 of profit. Apart from that the mode value provides information about repetition of sales
and profit figures. In this regard, there is not any repetition identified in sales value but profit
value of 20000 has been repeated in last 10 years. As per the above figures, it can be Juice
Company has kept stable in profit and sales that plays important role expansion of business.
B. Explaining how quartiles, percentiles and correlation can be used to aid decision making in
the fresh juice drinks market. (P2.4)
Table 4: Calculation of Quartile and Percentile
Sales Profit
Quartile 1 71125 21500
11
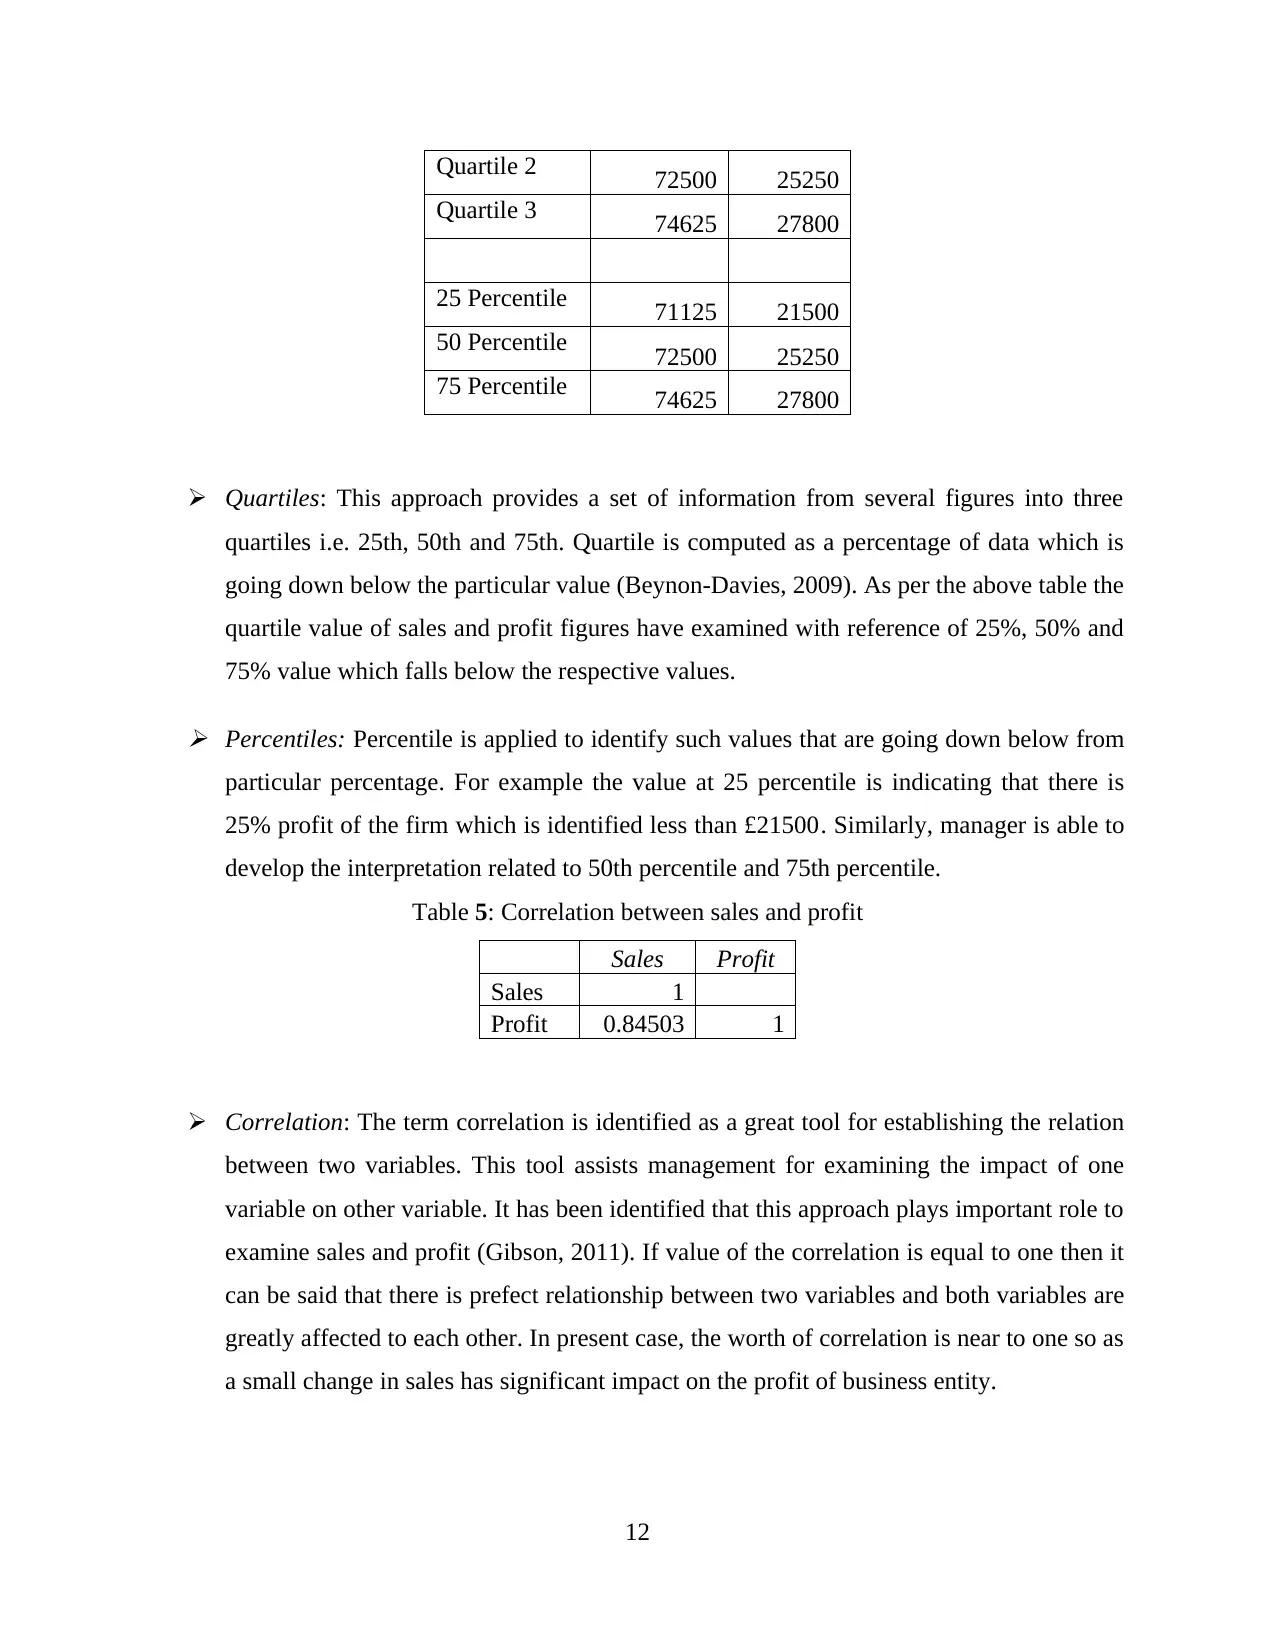
Quartile 2 72500 25250
Quartile 3 74625 27800
25 Percentile 71125 21500
50 Percentile 72500 25250
75 Percentile 74625 27800
Quartiles: This approach provides a set of information from several figures into three
quartiles i.e. 25th, 50th and 75th. Quartile is computed as a percentage of data which is
going down below the particular value (Beynon-Davies, 2009). As per the above table the
quartile value of sales and profit figures have examined with reference of 25%, 50% and
75% value which falls below the respective values.
Percentiles: Percentile is applied to identify such values that are going down below from
particular percentage. For example the value at 25 percentile is indicating that there is
25% profit of the firm which is identified less than £21500. Similarly, manager is able to
develop the interpretation related to 50th percentile and 75th percentile.
Table 5: Correlation between sales and profit
Sales Profit
Sales 1
Profit 0.84503 1
Correlation: The term correlation is identified as a great tool for establishing the relation
between two variables. This tool assists management for examining the impact of one
variable on other variable. It has been identified that this approach plays important role to
examine sales and profit (Gibson, 2011). If value of the correlation is equal to one then it
can be said that there is prefect relationship between two variables and both variables are
greatly affected to each other. In present case, the worth of correlation is near to one so as
a small change in sales has significant impact on the profit of business entity.
12
⊘ This is a preview!⊘
Do you want full access?
Subscribe today to unlock all pages.
Trusted by 1+ million students worldwide
1 out of 21
Related Documents


Your All-in-One AI-Powered Toolkit for Academic Success.
+13062052269
info@desklib.com
Available 24*7 on WhatsApp / Email
![[object Object]](/_next/static/media/star-bottom.7253800d.svg)
Unlock your academic potential
Copyright © 2020–2026 A2Z Services. All Rights Reserved. Developed and managed by ZUCOL.