Business Decision Making Report for Syngenta - BTEC Level 5
VerifiedAdded on 2020/02/05
|22
|4554
|243
Report
AI Summary
This report examines business decision-making processes within the context of Syngenta, a global company. It begins by discussing data collection methods, including primary and secondary sources, and the use of market surveys and questionnaires to gather insights. The report then delves into statistical analysis, covering mean, mode, median, range, standard deviation, quartiles, percentiles, and correlation coefficients. Data visualization techniques, such as column, bar, and line graphs, are employed to present sales, cost, and profit trends. Furthermore, the report explores time series analysis for forecasting and project management tools like Gantt charts and network diagrams. Finally, the report assesses the use of financial tools in decision-making, culminating in a conclusion that synthesizes the key findings and their implications for strategic, operational, and tactical decision-making within the firm. The report aims to provide practical insights into how data-driven analysis supports effective business choices.
BTEC Level 5 HND Diploma Business
UNIT 6:
Business
Decision Making
Assignment title Business Decision Making
UNIT 6:
Business
Decision Making
Assignment title Business Decision Making
Paraphrase This Document
Need a fresh take? Get an instant paraphrase of this document with our AI Paraphraser

BDM
TABLE OF CONTENTS
INTRODUCTION...........................................................................................................................4
TASK 1............................................................................................................................................4
Q1 Collecting primary and secondary data..................................................................................4
Q2 Market survey questionnaire..................................................................................................5
M1 Ways of calculating coefficient of skewness........................................................................6
TASK 2............................................................................................................................................6
Q1 Mean, Mode and Median.......................................................................................................6
Q2 Range and standard deviation................................................................................................8
Q3 Quartile, percentiles and correlation coefficient....................................................................8
TASK 3............................................................................................................................................9
Q1 Producing column and bar graph for sales, cost and profit....................................................9
Q2 Line graph demonstrating trend lines...................................................................................11
Q3 PowerPoint presentation......................................................................................................12
D1 Evaluating of use of time series analysis as tool for forecasting.........................................12
TASK 4..........................................................................................................................................13
Q1 Gantt chart............................................................................................................................13
Q2 Network diagram..................................................................................................................14
Q3 Using financial tool for decision making.............................................................................14
D3...............................................................................................................................................17
CONCLUSION .............................................................................................................................18
REFERENCES..............................................................................................................................19
⊘ This is a preview!⊘
Do you want full access?
Subscribe today to unlock all pages.
Trusted by 1+ million students worldwide
INTRODUCTION
Business decision making is crucial part of every organization. It is conducted in order to
select appropriate course of action that leads to achievement of success by the organization. It is
considered as cognitive process that results in making selection of suitable action from among
the options available (Ferrell and Fraedrich, 2014). In order to enhance survival of business for
long run the role of decision making is very critical. In the present study business decision
making has been discussed in context of Syngenta. The organization is one of the leading
company across the world that has more than 28000 employees in around 90 countries. The
present report entails to utilize software generated information for developing decisions at
operational, strategic and tactical level in the firm.
TASK 1
Q1 Collecting primary and secondary data
Amistar would be launched in India. It is being utilized for reducing the threat of diseases
that can emerges from several pests like cockroaches, beds, bugs, mice, moths and rats etc.
Amistar can be beneficial in making the country clean and free from pests. The data collection
tools have been used in order to take appropriate decisions. This would be effective in knowing
the preferences and opinions of the respondents with effectiveness. In the present study data
collection has been done through primary and secondary sources that would assist in making
decision regarding whether it will profitable for Syngenta to launch Amistar in India. Primary data: With this the information is collection by direct interaction with
respondents. Survey tool is being used to gather data from existing customers in
appropriate manner (Gakhar, 2012). For this questionnaire has been devised that would
assist the researcher in gaining knowledge with respect to preferences of respondents.
Secondary data: Under this collection of data is done by the means of past information.
This involves sales records, profitability data and annual reports. It is appropriate in
giving better knowledge regarding ability of Syngenta towards launching its product in
India.
The data would used for the purpose of analyzing the preferences of customers towards
use of Amistar in India.
Paraphrase This Document
Need a fresh take? Get an instant paraphrase of this document with our AI Paraphraser
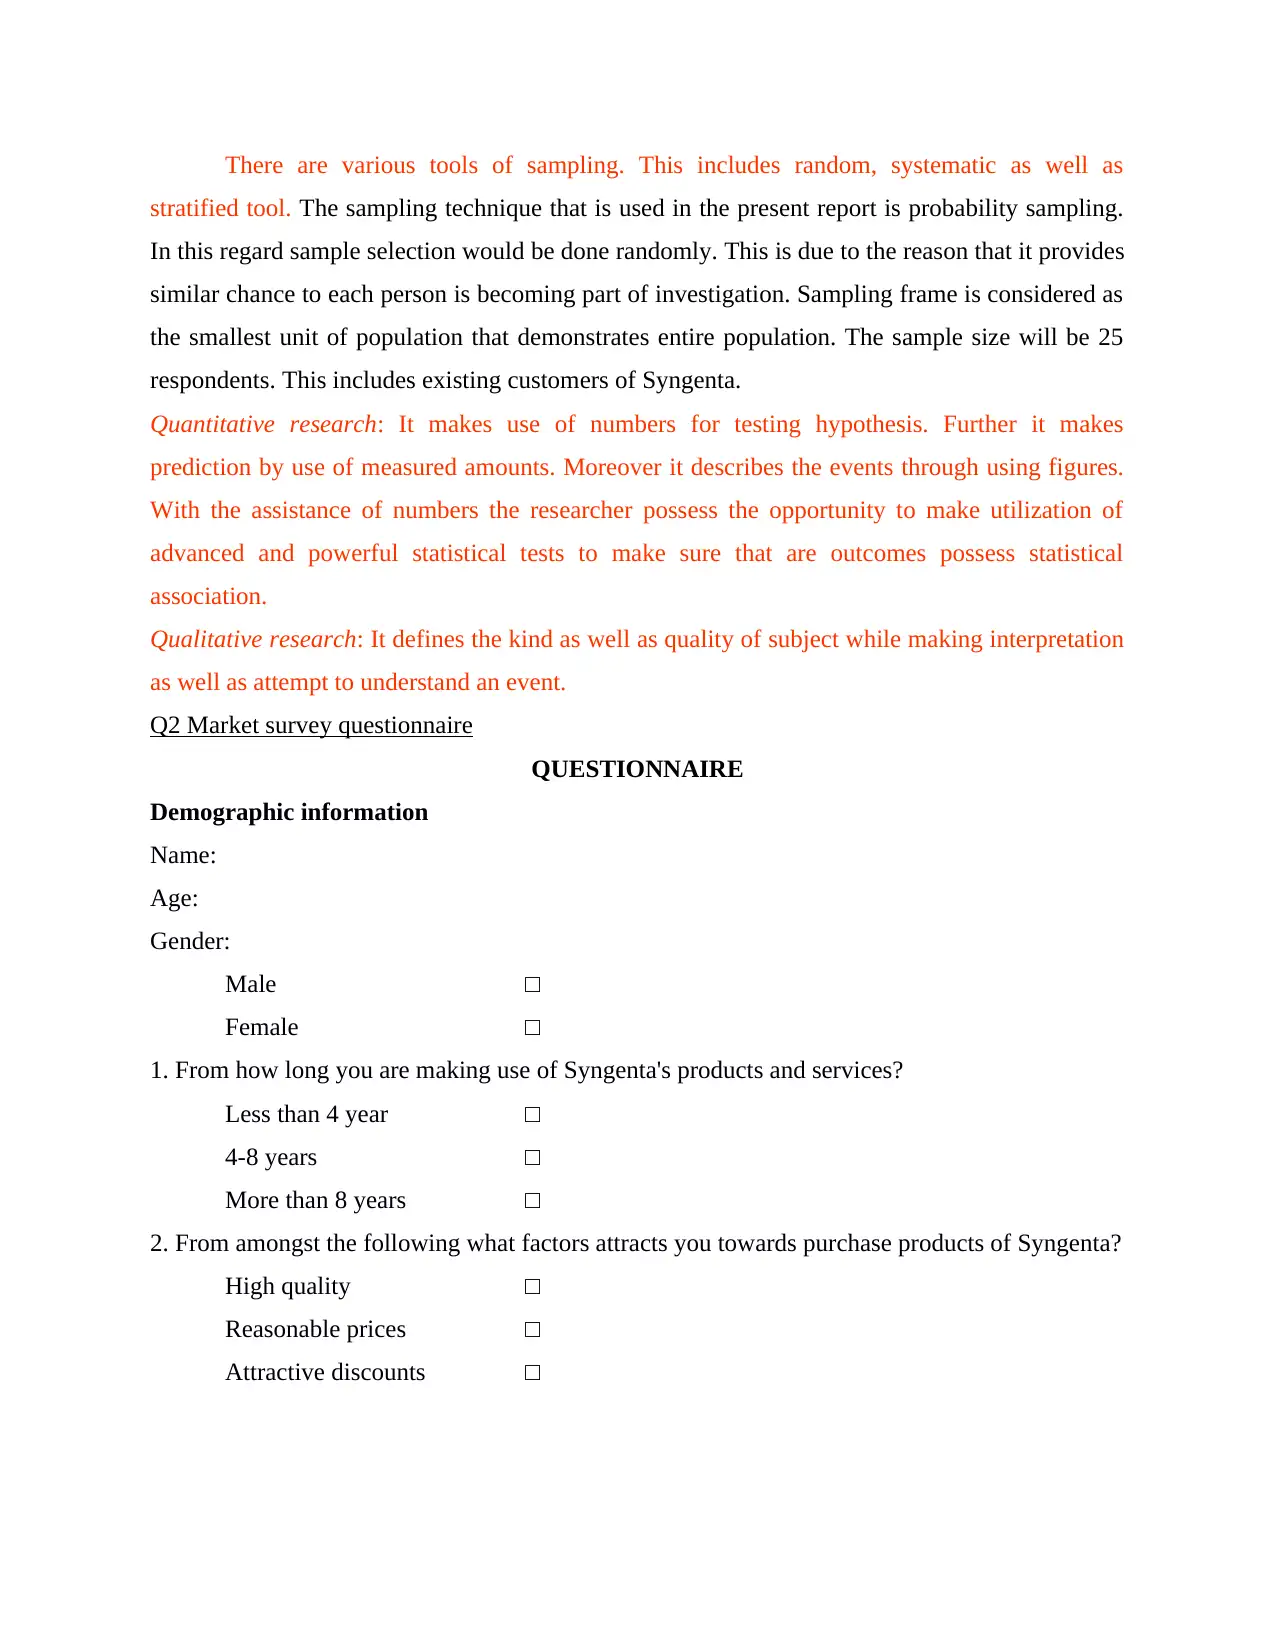
There are various tools of sampling. This includes random, systematic as well as
stratified tool. The sampling technique that is used in the present report is probability sampling.
In this regard sample selection would be done randomly. This is due to the reason that it provides
similar chance to each person is becoming part of investigation. Sampling frame is considered as
the smallest unit of population that demonstrates entire population. The sample size will be 25
respondents. This includes existing customers of Syngenta.
Quantitative research: It makes use of numbers for testing hypothesis. Further it makes
prediction by use of measured amounts. Moreover it describes the events through using figures.
With the assistance of numbers the researcher possess the opportunity to make utilization of
advanced and powerful statistical tests to make sure that are outcomes possess statistical
association.
Qualitative research: It defines the kind as well as quality of subject while making interpretation
as well as attempt to understand an event.
Q2 Market survey questionnaire
QUESTIONNAIRE
Demographic information
Name:
Age:
Gender:
Male □
Female □
1. From how long you are making use of Syngenta's products and services?
Less than 4 year □
4-8 years □
More than 8 years □
2. From amongst the following what factors attracts you towards purchase products of Syngenta?
High quality □
Reasonable prices □
Attractive discounts □
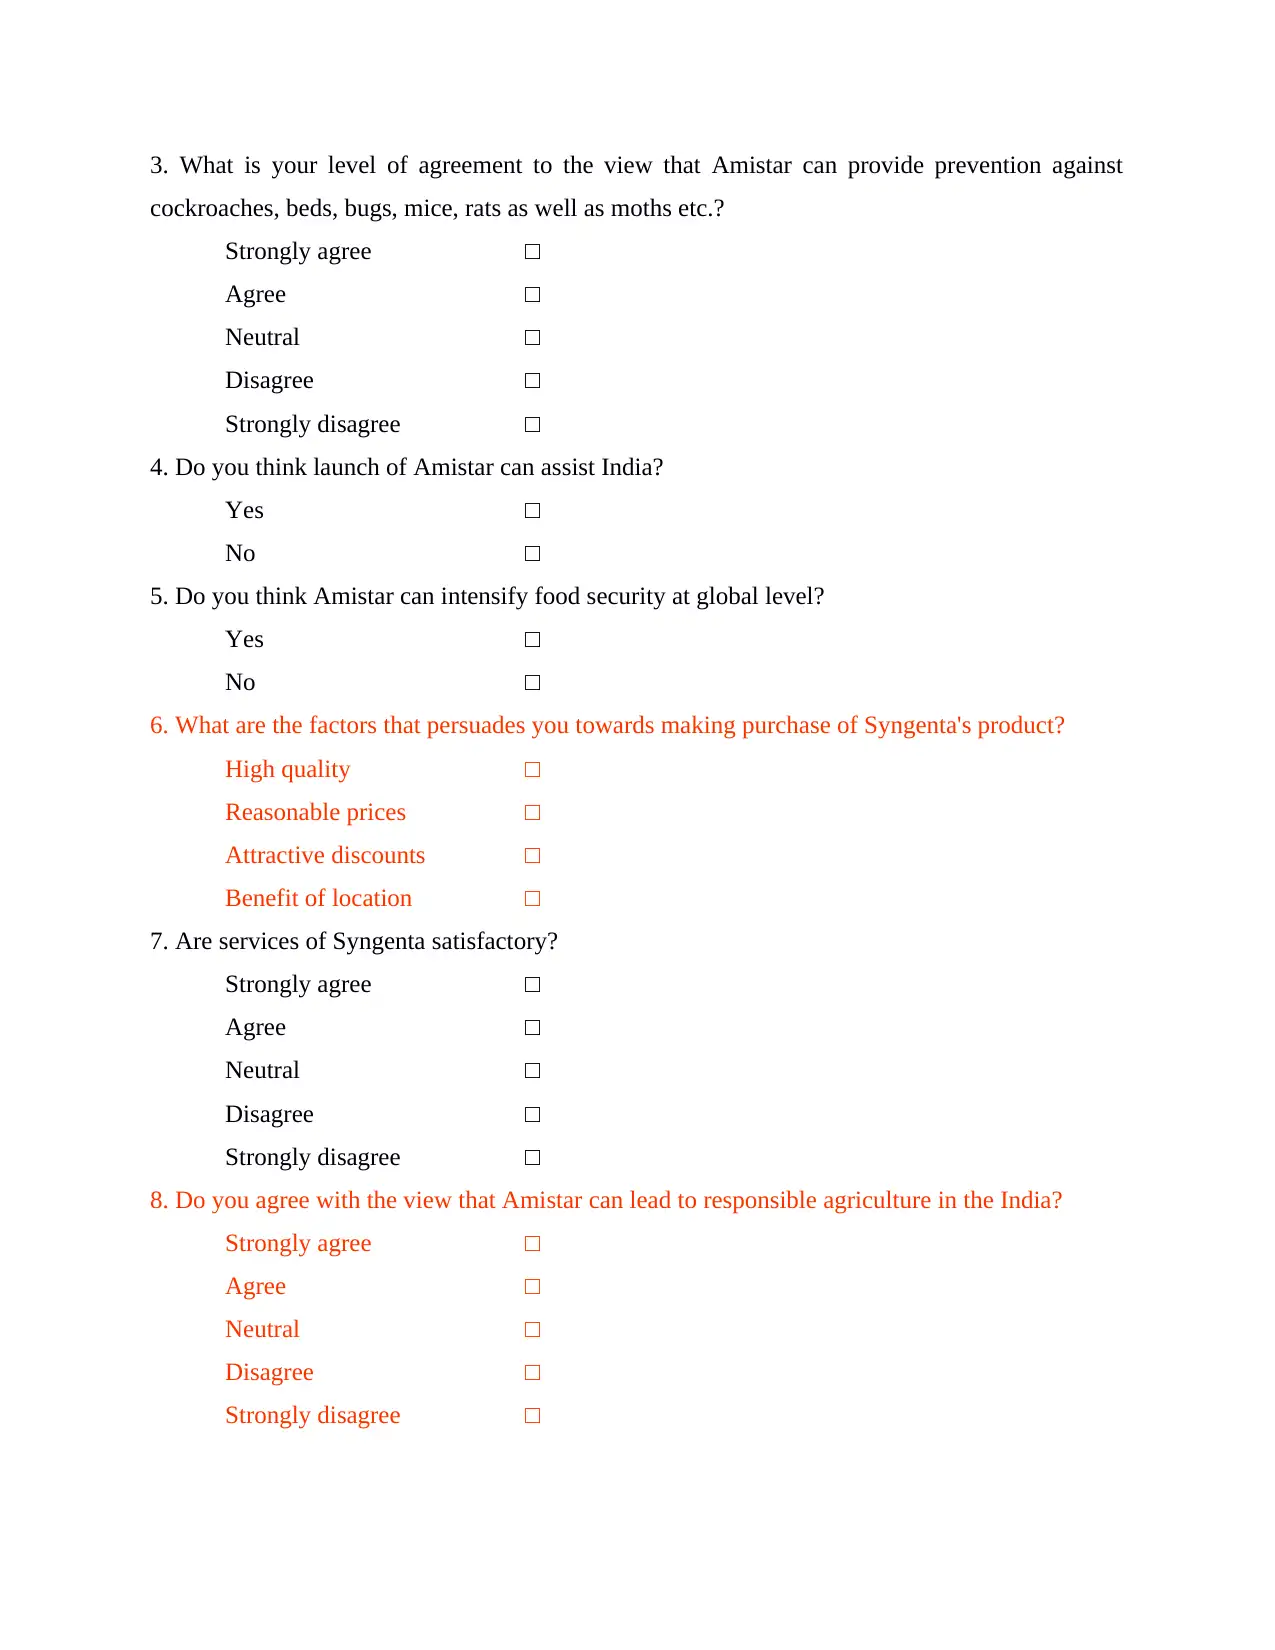
3. What is your level of agreement to the view that Amistar can provide prevention against
cockroaches, beds, bugs, mice, rats as well as moths etc.?
Strongly agree □
Agree □
Neutral □
Disagree □
Strongly disagree □
4. Do you think launch of Amistar can assist India?
Yes □
No □
5. Do you think Amistar can intensify food security at global level?
Yes □
No □
6. What are the factors that persuades you towards making purchase of Syngenta's product?
High quality □
Reasonable prices □
Attractive discounts □
Benefit of location □
7. Are services of Syngenta satisfactory?
Strongly agree □
Agree □
Neutral □
Disagree □
Strongly disagree □
8. Do you agree with the view that Amistar can lead to responsible agriculture in the India?
Strongly agree □
Agree □
Neutral □
Disagree □
Strongly disagree □
⊘ This is a preview!⊘
Do you want full access?
Subscribe today to unlock all pages.
Trusted by 1+ million students worldwide
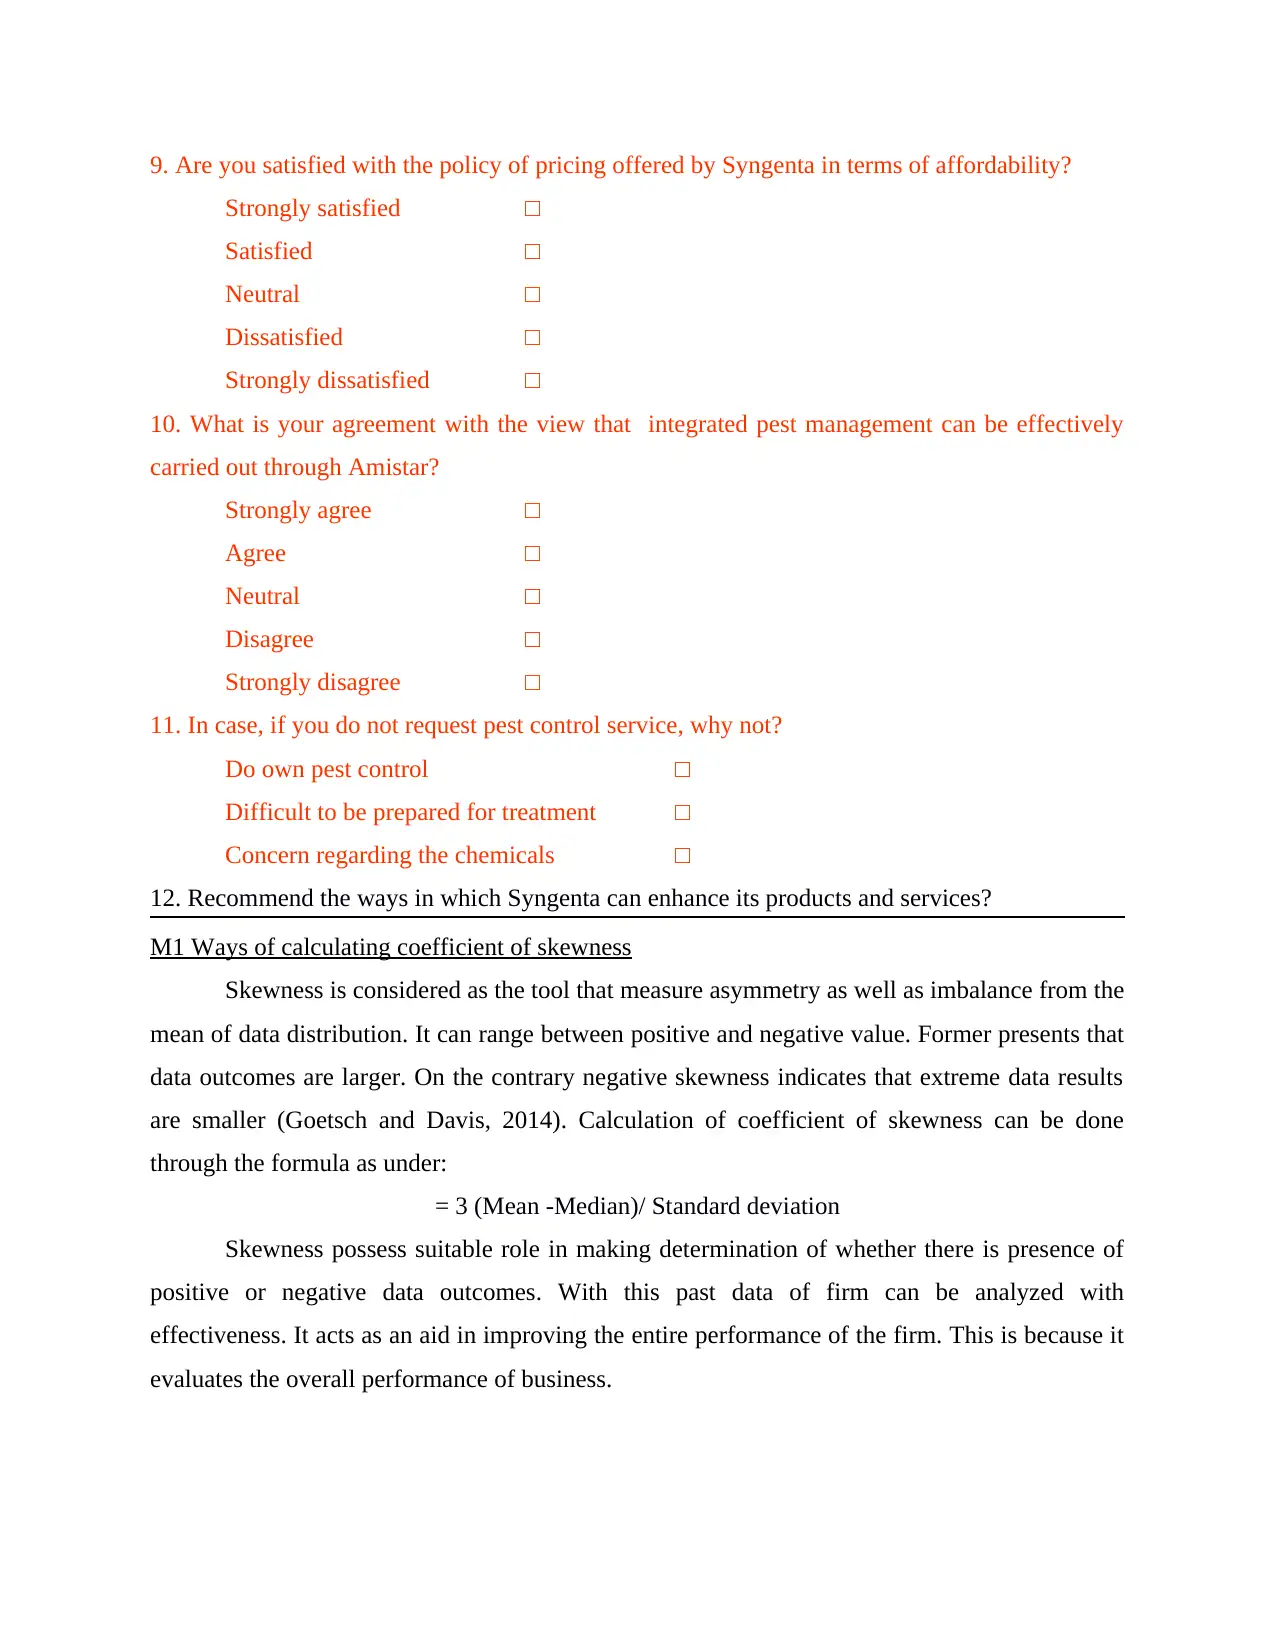
9. Are you satisfied with the policy of pricing offered by Syngenta in terms of affordability?
Strongly satisfied □
Satisfied □
Neutral □
Dissatisfied □
Strongly dissatisfied □
10. What is your agreement with the view that integrated pest management can be effectively
carried out through Amistar?
Strongly agree □
Agree □
Neutral □
Disagree □
Strongly disagree □
11. In case, if you do not request pest control service, why not?
Do own pest control □
Difficult to be prepared for treatment □
Concern regarding the chemicals □
12. Recommend the ways in which Syngenta can enhance its products and services?
M1 Ways of calculating coefficient of skewness
Skewness is considered as the tool that measure asymmetry as well as imbalance from the
mean of data distribution. It can range between positive and negative value. Former presents that
data outcomes are larger. On the contrary negative skewness indicates that extreme data results
are smaller (Goetsch and Davis, 2014). Calculation of coefficient of skewness can be done
through the formula as under:
= 3 (Mean -Median)/ Standard deviation
Skewness possess suitable role in making determination of whether there is presence of
positive or negative data outcomes. With this past data of firm can be analyzed with
effectiveness. It acts as an aid in improving the entire performance of the firm. This is because it
evaluates the overall performance of business.
Paraphrase This Document
Need a fresh take? Get an instant paraphrase of this document with our AI Paraphraser
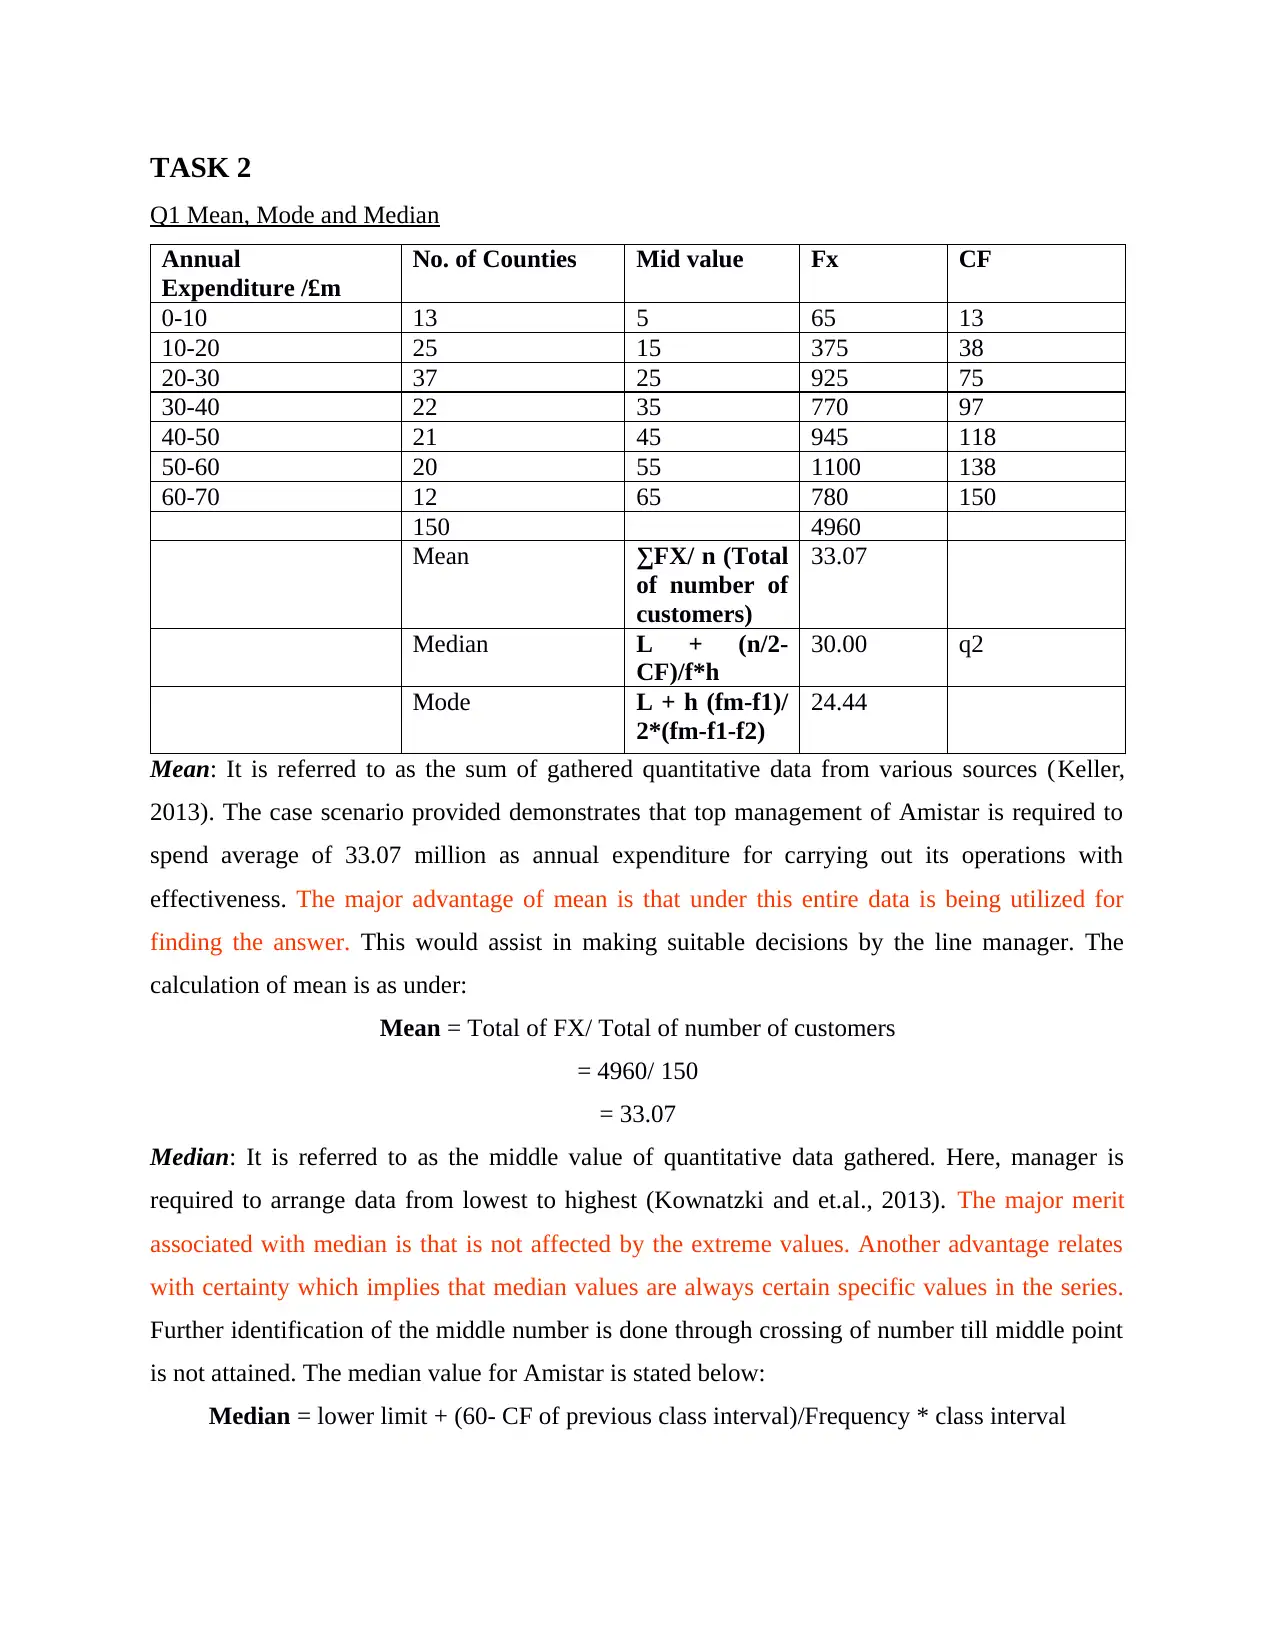
TASK 2
Q1 Mean, Mode and Median
Annual
Expenditure /£m
No. of Counties Mid value Fx CF
0-10 13 5 65 13
10-20 25 15 375 38
20-30 37 25 925 75
30-40 22 35 770 97
40-50 21 45 945 118
50-60 20 55 1100 138
60-70 12 65 780 150
150 4960
Mean ∑FX/ n (Total
of number of
customers)
33.07
Median L + (n/2-
CF)/f*h
30.00 q2
Mode L + h (fm-f1)/
2*(fm-f1-f2)
24.44
Mean: It is referred to as the sum of gathered quantitative data from various sources (Keller,
2013). The case scenario provided demonstrates that top management of Amistar is required to
spend average of 33.07 million as annual expenditure for carrying out its operations with
effectiveness. The major advantage of mean is that under this entire data is being utilized for
finding the answer. This would assist in making suitable decisions by the line manager. The
calculation of mean is as under:
Mean = Total of FX/ Total of number of customers
= 4960/ 150
= 33.07
Median: It is referred to as the middle value of quantitative data gathered. Here, manager is
required to arrange data from lowest to highest (Kownatzki and et.al., 2013). The major merit
associated with median is that is not affected by the extreme values. Another advantage relates
with certainty which implies that median values are always certain specific values in the series.
Further identification of the middle number is done through crossing of number till middle point
is not attained. The median value for Amistar is stated below:
Median = lower limit + (60- CF of previous class interval)/Frequency * class interval
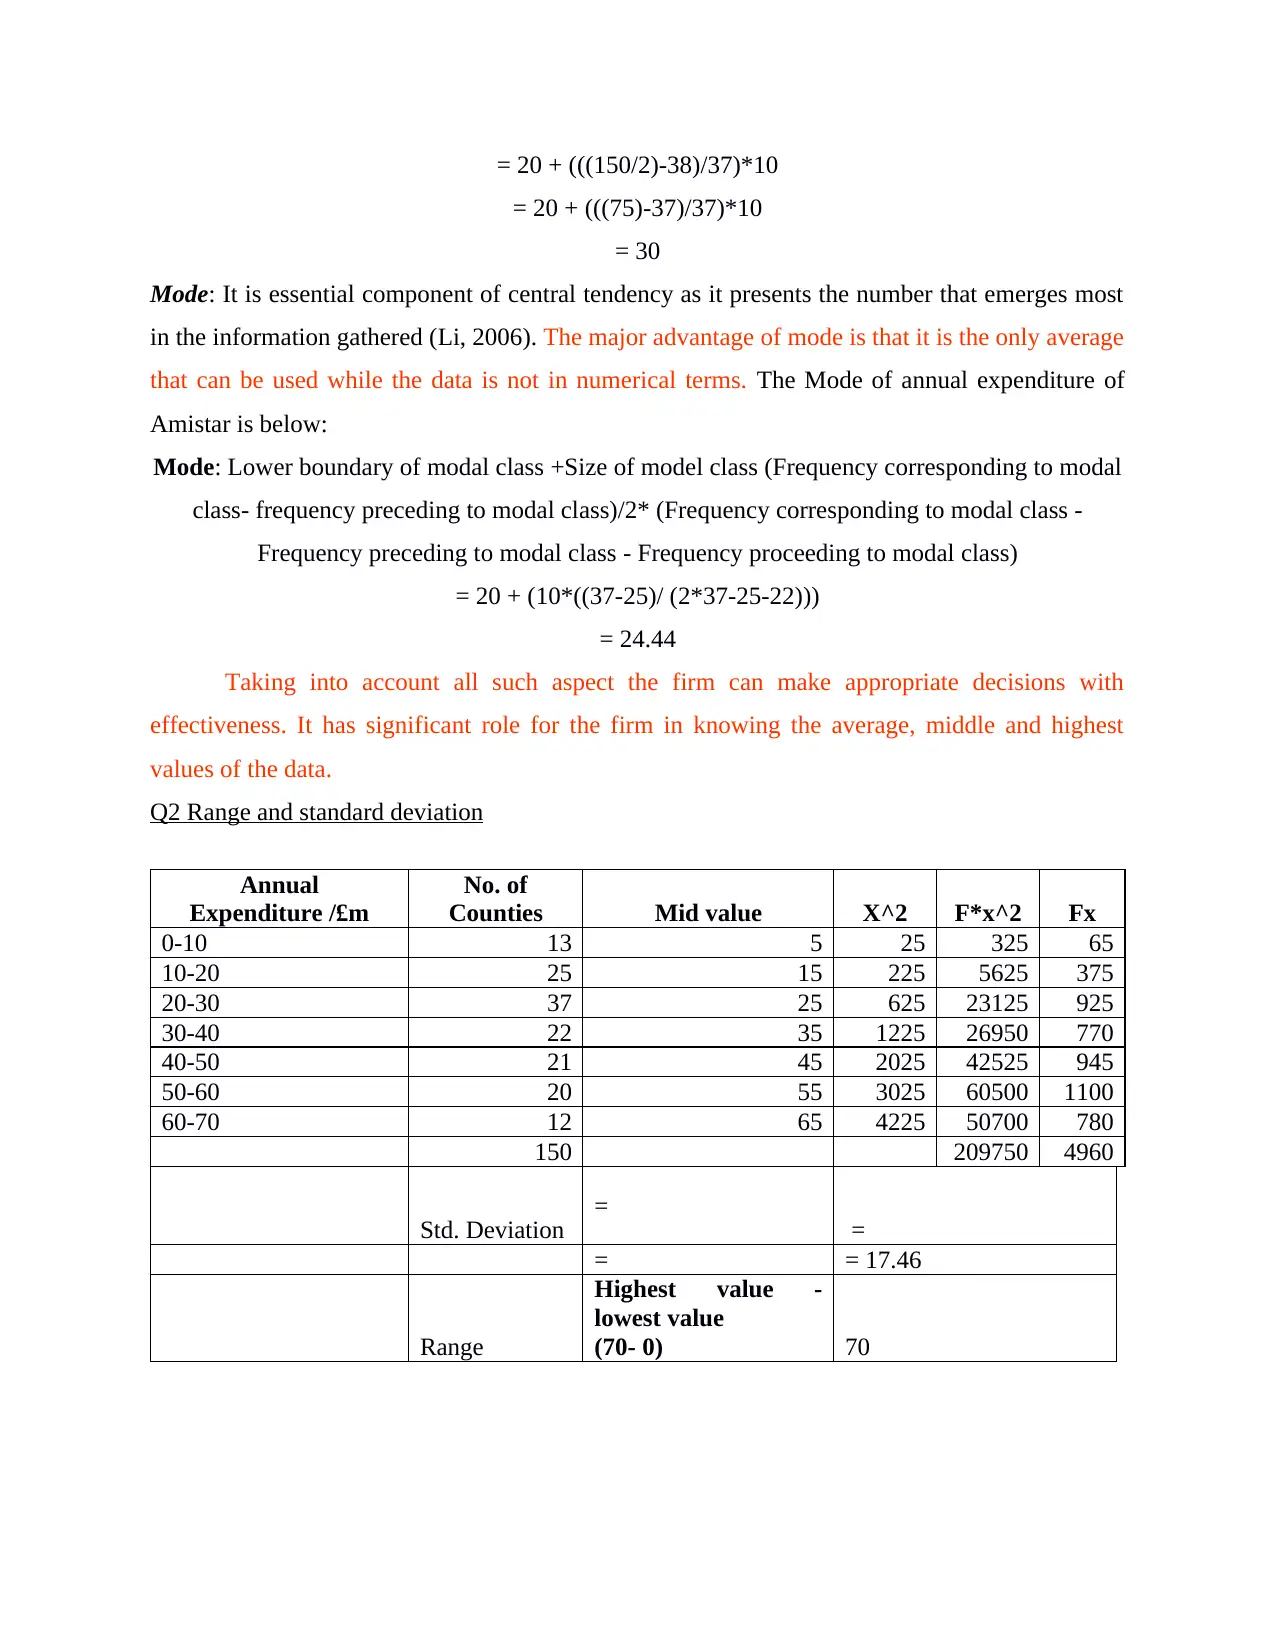
= 20 + (((150/2)-38)/37)*10
= 20 + (((75)-37)/37)*10
= 30
Mode: It is essential component of central tendency as it presents the number that emerges most
in the information gathered (Li, 2006). The major advantage of mode is that it is the only average
that can be used while the data is not in numerical terms. The Mode of annual expenditure of
Amistar is below:
Mode: Lower boundary of modal class +Size of model class (Frequency corresponding to modal
class- frequency preceding to modal class)/2* (Frequency corresponding to modal class -
Frequency preceding to modal class - Frequency proceeding to modal class)
= 20 + (10*((37-25)/ (2*37-25-22)))
= 24.44
Taking into account all such aspect the firm can make appropriate decisions with
effectiveness. It has significant role for the firm in knowing the average, middle and highest
values of the data.
Q2 Range and standard deviation
Annual
Expenditure /£m
No. of
Counties Mid value X^2 F*x^2 Fx
0-10 13 5 25 325 65
10-20 25 15 225 5625 375
20-30 37 25 625 23125 925
30-40 22 35 1225 26950 770
40-50 21 45 2025 42525 945
50-60 20 55 3025 60500 1100
60-70 12 65 4225 50700 780
150 209750 4960
Std. Deviation = =
= = 17.46
Range
Highest value -
lowest value
(70- 0) 70
⊘ This is a preview!⊘
Do you want full access?
Subscribe today to unlock all pages.
Trusted by 1+ million students worldwide
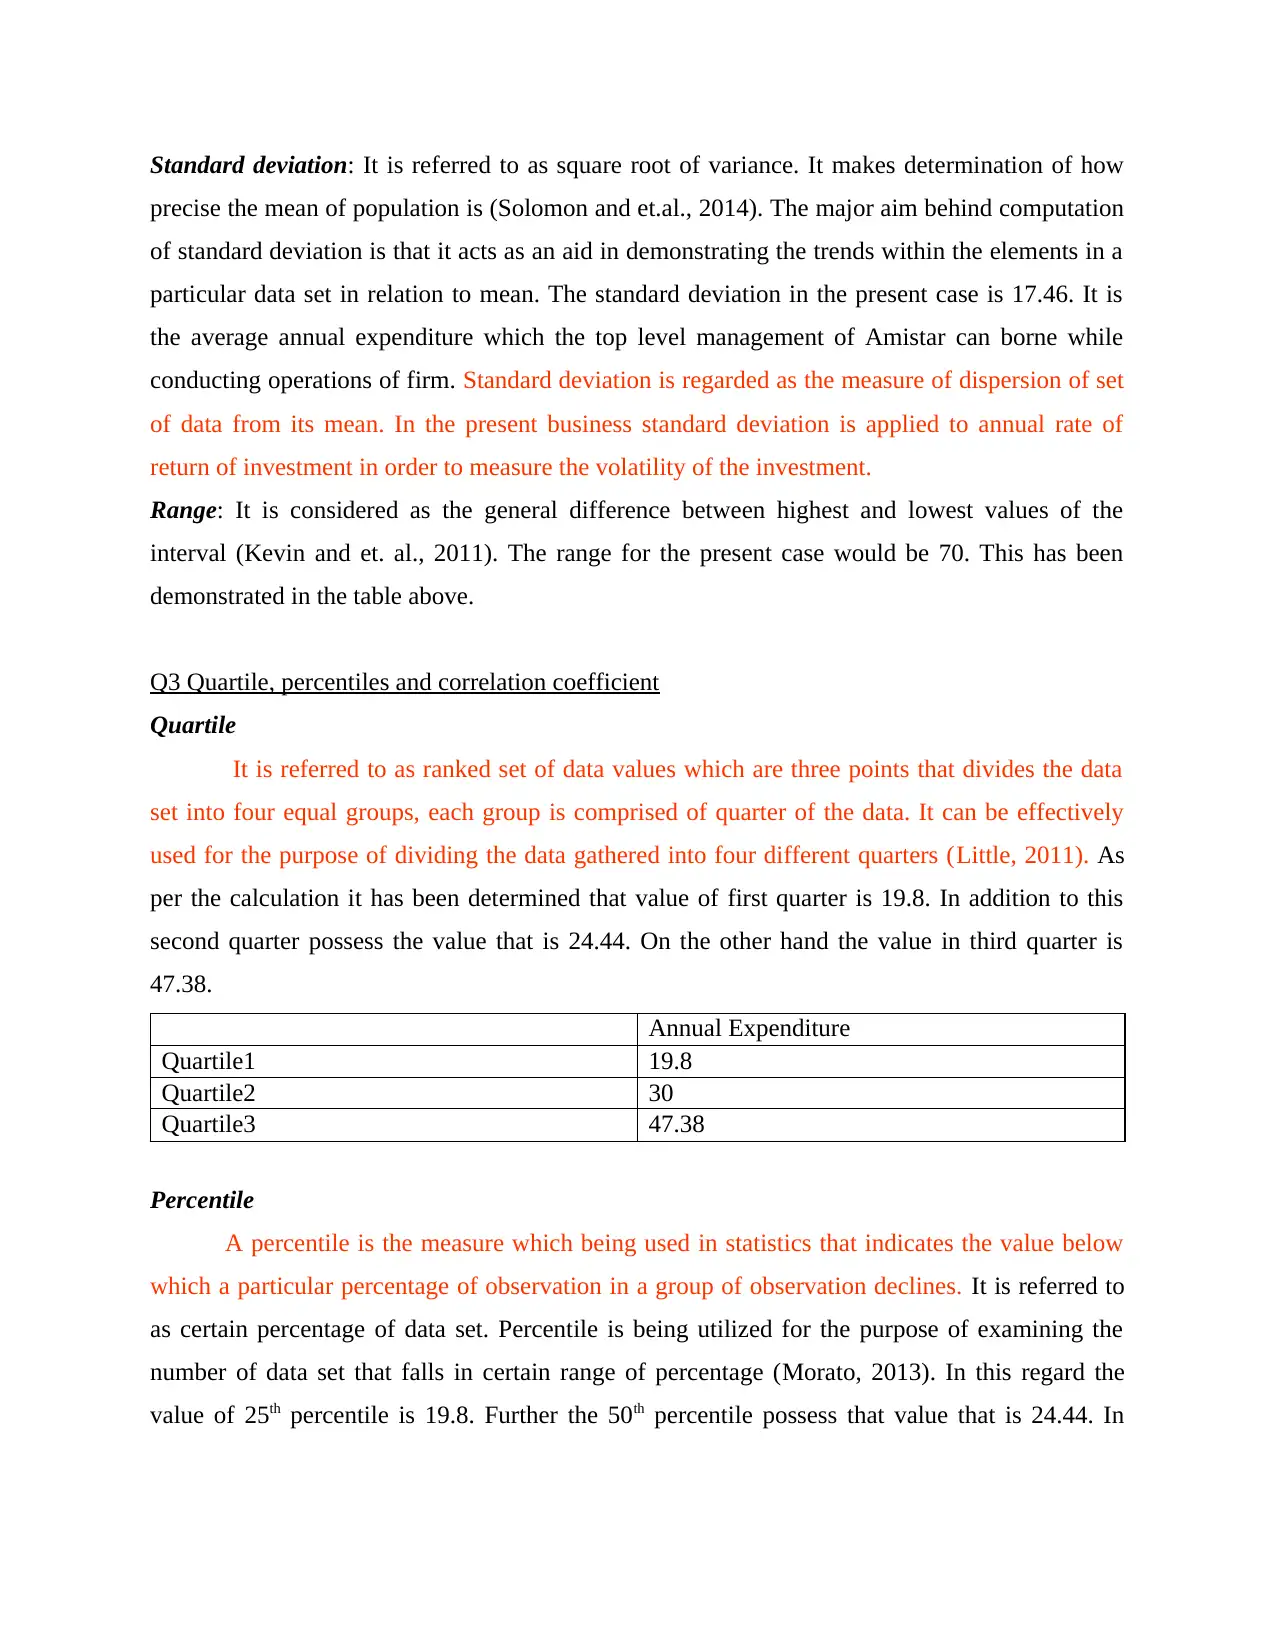
Standard deviation: It is referred to as square root of variance. It makes determination of how
precise the mean of population is (Solomon and et.al., 2014). The major aim behind computation
of standard deviation is that it acts as an aid in demonstrating the trends within the elements in a
particular data set in relation to mean. The standard deviation in the present case is 17.46. It is
the average annual expenditure which the top level management of Amistar can borne while
conducting operations of firm. Standard deviation is regarded as the measure of dispersion of set
of data from its mean. In the present business standard deviation is applied to annual rate of
return of investment in order to measure the volatility of the investment.
Range: It is considered as the general difference between highest and lowest values of the
interval (Kevin and et. al., 2011). The range for the present case would be 70. This has been
demonstrated in the table above.
Q3 Quartile, percentiles and correlation coefficient
Quartile
It is referred to as ranked set of data values which are three points that divides the data
set into four equal groups, each group is comprised of quarter of the data. It can be effectively
used for the purpose of dividing the data gathered into four different quarters (Little, 2011). As
per the calculation it has been determined that value of first quarter is 19.8. In addition to this
second quarter possess the value that is 24.44. On the other hand the value in third quarter is
47.38.
Annual Expenditure
Quartile1 19.8
Quartile2 30
Quartile3 47.38
Percentile
A percentile is the measure which being used in statistics that indicates the value below
which a particular percentage of observation in a group of observation declines. It is referred to
as certain percentage of data set. Percentile is being utilized for the purpose of examining the
number of data set that falls in certain range of percentage (Morato, 2013). In this regard the
value of 25th percentile is 19.8. Further the 50th percentile possess that value that is 24.44. In
Paraphrase This Document
Need a fresh take? Get an instant paraphrase of this document with our AI Paraphraser
contrast to this the value in 75th percentile is 47.38. Aim of the researcher is to make evaluation
of percentile to determine the percentage value of data gathered and in which group it lies.
Correlation
It is defined as the statistical tool that evaluates the relationship among two variables. It is
regarded as the suitable approach that assist in computing the extent to which one variable
impacts another (Triantaphyllou, 2013). Correlation can be positive and negative. Positive
correlation presents that variables are highly correlated which implies that impact of one affects
another. On the other hand negative correlation is referred to as the one in which variables are
related with one another at all. In the present study the correlation among sales and profitability
is 88.8% which implies that there is greater association among both variables. Thus change in
sales will influence business profitability and vice versa. It is essential for Syngenta to
implement effective strategies in order to generate desired resultants.
Particular Sales Units (£’m) Profits (£’m)
Sales (Units) (£’m) 1 0.888030143
Profits (£’m) 0.888030143 1
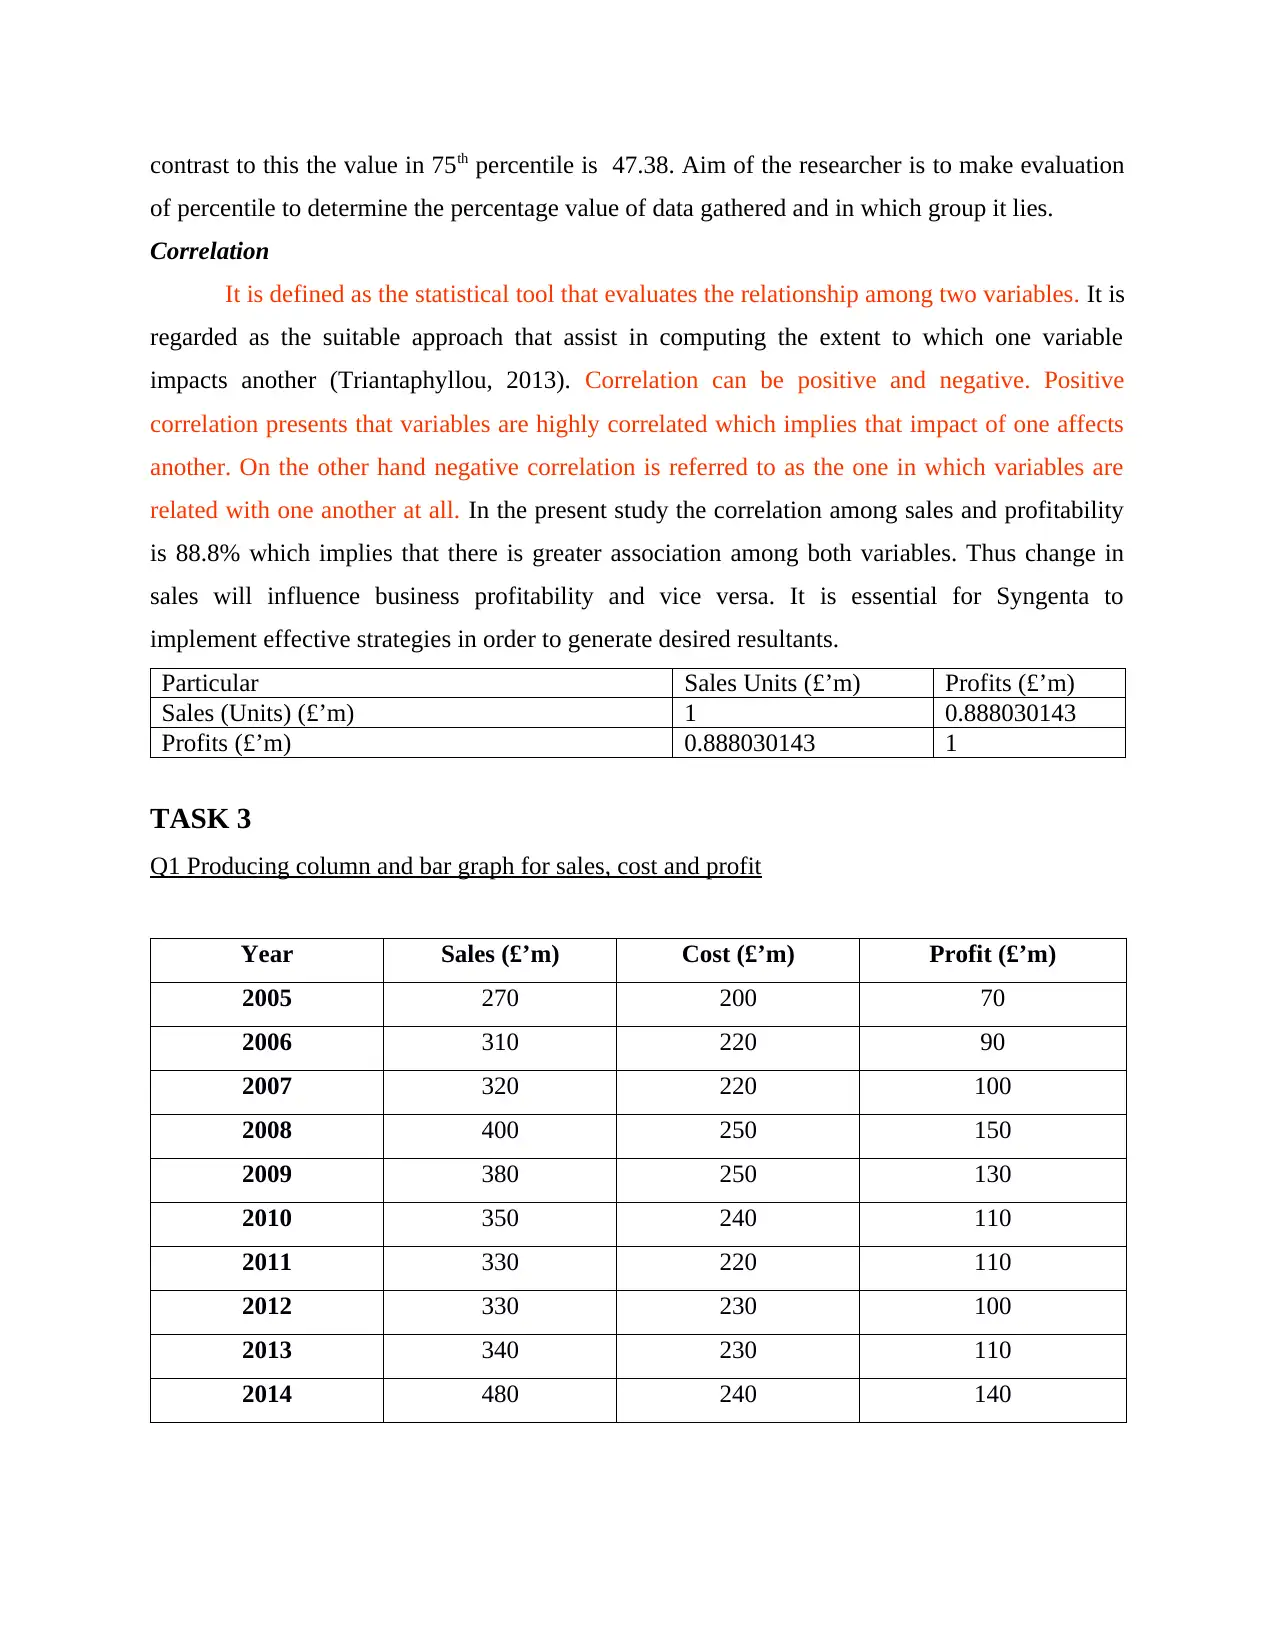
TASK 3
Q1 Producing column and bar graph for sales, cost and profit
Year Sales (£’m) Cost (£’m) Profit (£’m)
2005 270 200 70
2006 310 220 90
2007 320 220 100
2008 400 250 150
2009 380 250 130
2010 350 240 110
2011 330 220 110
2012 330 230 100
2013 340 230 110
2014 480 240 140
of percentile to determine the percentage value of data gathered and in which group it lies.
Correlation
It is defined as the statistical tool that evaluates the relationship among two variables. It is
regarded as the suitable approach that assist in computing the extent to which one variable
impacts another (Triantaphyllou, 2013). Correlation can be positive and negative. Positive
correlation presents that variables are highly correlated which implies that impact of one affects
another. On the other hand negative correlation is referred to as the one in which variables are
related with one another at all. In the present study the correlation among sales and profitability
is 88.8% which implies that there is greater association among both variables. Thus change in
sales will influence business profitability and vice versa. It is essential for Syngenta to
implement effective strategies in order to generate desired resultants.
Particular Sales Units (£’m) Profits (£’m)
Sales (Units) (£’m) 1 0.888030143
Profits (£’m) 0.888030143 1
TASK 3
Q1 Producing column and bar graph for sales, cost and profit
Year Sales (£’m) Cost (£’m) Profit (£’m)
2005 270 200 70
2006 310 220 90
2007 320 220 100
2008 400 250 150
2009 380 250 130
2010 350 240 110
2011 330 220 110
2012 330 230 100
2013 340 230 110
2014 480 240 140
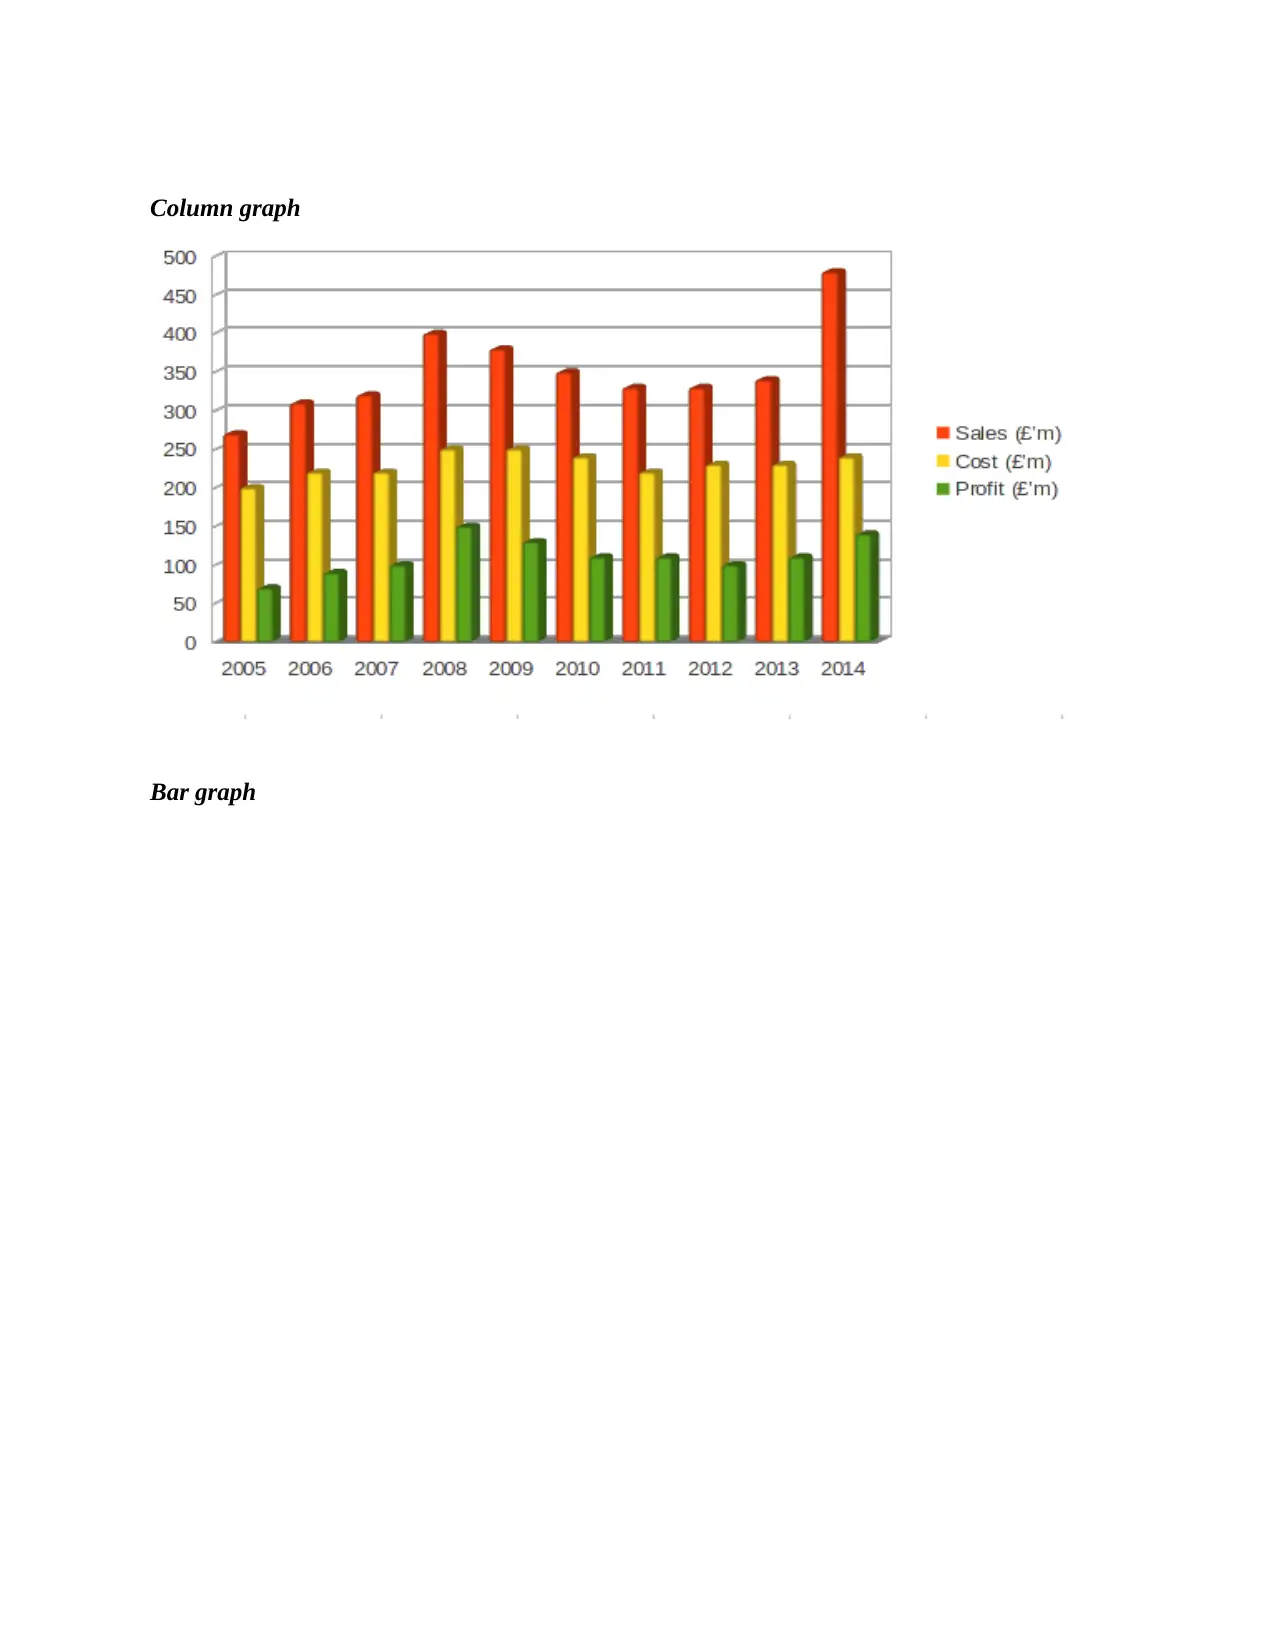
Column graph
Bar graph
Bar graph
⊘ This is a preview!⊘
Do you want full access?
Subscribe today to unlock all pages.
Trusted by 1+ million students worldwide
1 out of 22
Related Documents


Your All-in-One AI-Powered Toolkit for Academic Success.
+13062052269
info@desklib.com
Available 24*7 on WhatsApp / Email
![[object Object]](/_next/static/media/star-bottom.7253800d.svg)
Unlock your academic potential
Copyright © 2020–2026 A2Z Services. All Rights Reserved. Developed and managed by ZUCOL.