Business Decision Making Report: Analysis of Food for Friends' Data
VerifiedAdded on 2020/01/23
|19
|4075
|29
Report
AI Summary
This report analyzes business decision-making for Food for Friends, a restaurant planning to open a new location. It begins with a plan for collecting primary and secondary data through surveys and existing literature. The report then details the survey methodology, including questionnaire design and sampling techniques. Task 2 focuses on information for decision-making, interpreting mean, median, and mode, along with measures of dispersion, correlation, and quartiles. The report then analyzes primary data, including factors influencing customer visits and food preferences. A trend line is also included, alongside a formal business report. Task 4 covers the use of information processing tools, project plan preparation, and financial tools like payback period, ARR, NPV, and IRR. The analysis reveals customer preferences for taste, price, and regional/Chinese food, and the financial analysis provides insights into the project's viability, concluding with recommendations for improving services and maximizing profitability for Food for Friends.

BUSINESS DECISION MAKING
Paraphrase This Document
Need a fresh take? Get an instant paraphrase of this document with our AI Paraphraser
TABLE OF CONTENTS
INTRODUCTION...........................................................................................................................4
TASK 1............................................................................................................................................4
1.1 Creating plan for primary and secondary data .....................................................................4
1.2 Survey methodology ............................................................................................................4
1.3 Designing questionnaire .......................................................................................................5
TASK 2............................................................................................................................................7
2.1 Information for decision making...........................................................................................7
2.2 Interpretation of results of mean, median and mode.............................................................7
2.3 Measure of dispersion...........................................................................................................8
2.4 Calculation of correlation and quartile..................................................................................9
TASK 3............................................................................................................................................9
3.1 Analysis of primary data.......................................................................................................9
3.2 Trend line............................................................................................................................12
3.3 Covered in PPT...................................................................................................................13
3.4 Formal business report .......................................................................................................13
TASK 4..........................................................................................................................................13
4.1 Use of suitable information processing tools .....................................................................13
4.2 Preparation of the project plan ...........................................................................................14
4.3 Financial tools for decision making ...................................................................................16
Conclusion ....................................................................................................................................18
References .....................................................................................................................................19
INDEX OF TABLES
Table 1: Calculation of mean, median and mode............................................................................7
Table 2: Median value....................................................................................................................8
Table 3: Calculation of standard deviation......................................................................................8
Table 4: Calculation of correlation..................................................................................................9
Table 5: Calculation of percentile....................................................................................................9
Table 6: People response on factors which influence them to visit Food for Friends?.................10
Table 7: People preference on food...............................................................................................10
Table 8: Project plan data..............................................................................................................15
Table 9: Calculation of payback period method............................................................................17
Table 10: Calculation of ARR.......................................................................................................17
Table 11: Calculation of net present value....................................................................................18
Table 12: Calculation of IRR 18
ILLUSTRATION INDEX
Illustration 1: People response on factors which influence them to visit Food for Friends?.........10
Illustration 2: People preference on food.......................................................................................11
⊘ This is a preview!⊘
Do you want full access?
Subscribe today to unlock all pages.
Trusted by 1+ million students worldwide
INTRODUCTION
Business Decisions are very complex which are made for long-term and highly affect the
productivity of an organization. Decision making is the systematic process in which relevant
information is gathered, choices are made, and alternative occupations are assessed to make the
business operations more effective. These decisions are not easy to make, the owner of company
has to take into consideration many factors. Various analytic tools and concepts are used in the
research and interpretation of there results are made in the report. At end of the report, projects
are evaluated by using methods like pay back, ARR and IRR etc.
TASK 1
1.1 Creating plan for primary and secondary data
Food for Friends is planning to open its second new restaurant in the city of London.
Hence for the purpose of knowing the consumer taste and preferences, company is planning to
do a survey on the people. The plan for the primary and secondary data collection is as follows:
Primary plan – Primary data is the first hand information which is unprocessed and fresh
in nature. Food for Friends will collect the primary data from the potential customers of
London through questionnaire technique (Huber, 2011). Primary research is conducted
because it helps firm in collecting facts and figures about the situation that is currently
prevalent in the market.
Secondary plan – It is available through already published sources. This kind of
information is not new and needs to be collected from valid and authentic sources. In
present study secondary information will be collected from books, journals and
magazines. Information collected from these sources helps in develop proper
understanding about the research topic.
1.2 Survey methodology
Sampling makes the data collection work easier (Berenso and et.al., 2012). It is mainly
of two types’ probability and non-probability methods. For this research combination of random
and Purposive sampling techniques will be applied. The respondents will be selected who are
near to the location of different restaurants. It is appropriate because it helps in avoiding personal
bias. Purposive approach is appropriate because primary data is required to be collected from
Paraphrase This Document
Need a fresh take? Get an instant paraphrase of this document with our AI Paraphraser
people who prefer to eat in restaurants (Agresti and Kateri, 2011). Both qualitative and
quantitative approach has been kept for the research. There are number of sampling method and
some of them are as follows. Simple random sampling- This is method that is often used by the researchers when they
do not need specific type of respondents for data collection. In this method researcher
does not make use of any parameter for choosing sample units from population. Stratified sampling- In this method researcher determine the criteria that is considered
for selecting sample units from population. This method is used when one wants to
collect facts and figures from people that are different from each other on ground of
income level and education etc. This sampling method will be used in present study.
Cluster sampling- Under this method specific geographic area is divided in to multiple
parts and sample units are taken from them. This method is employed in government
survey.
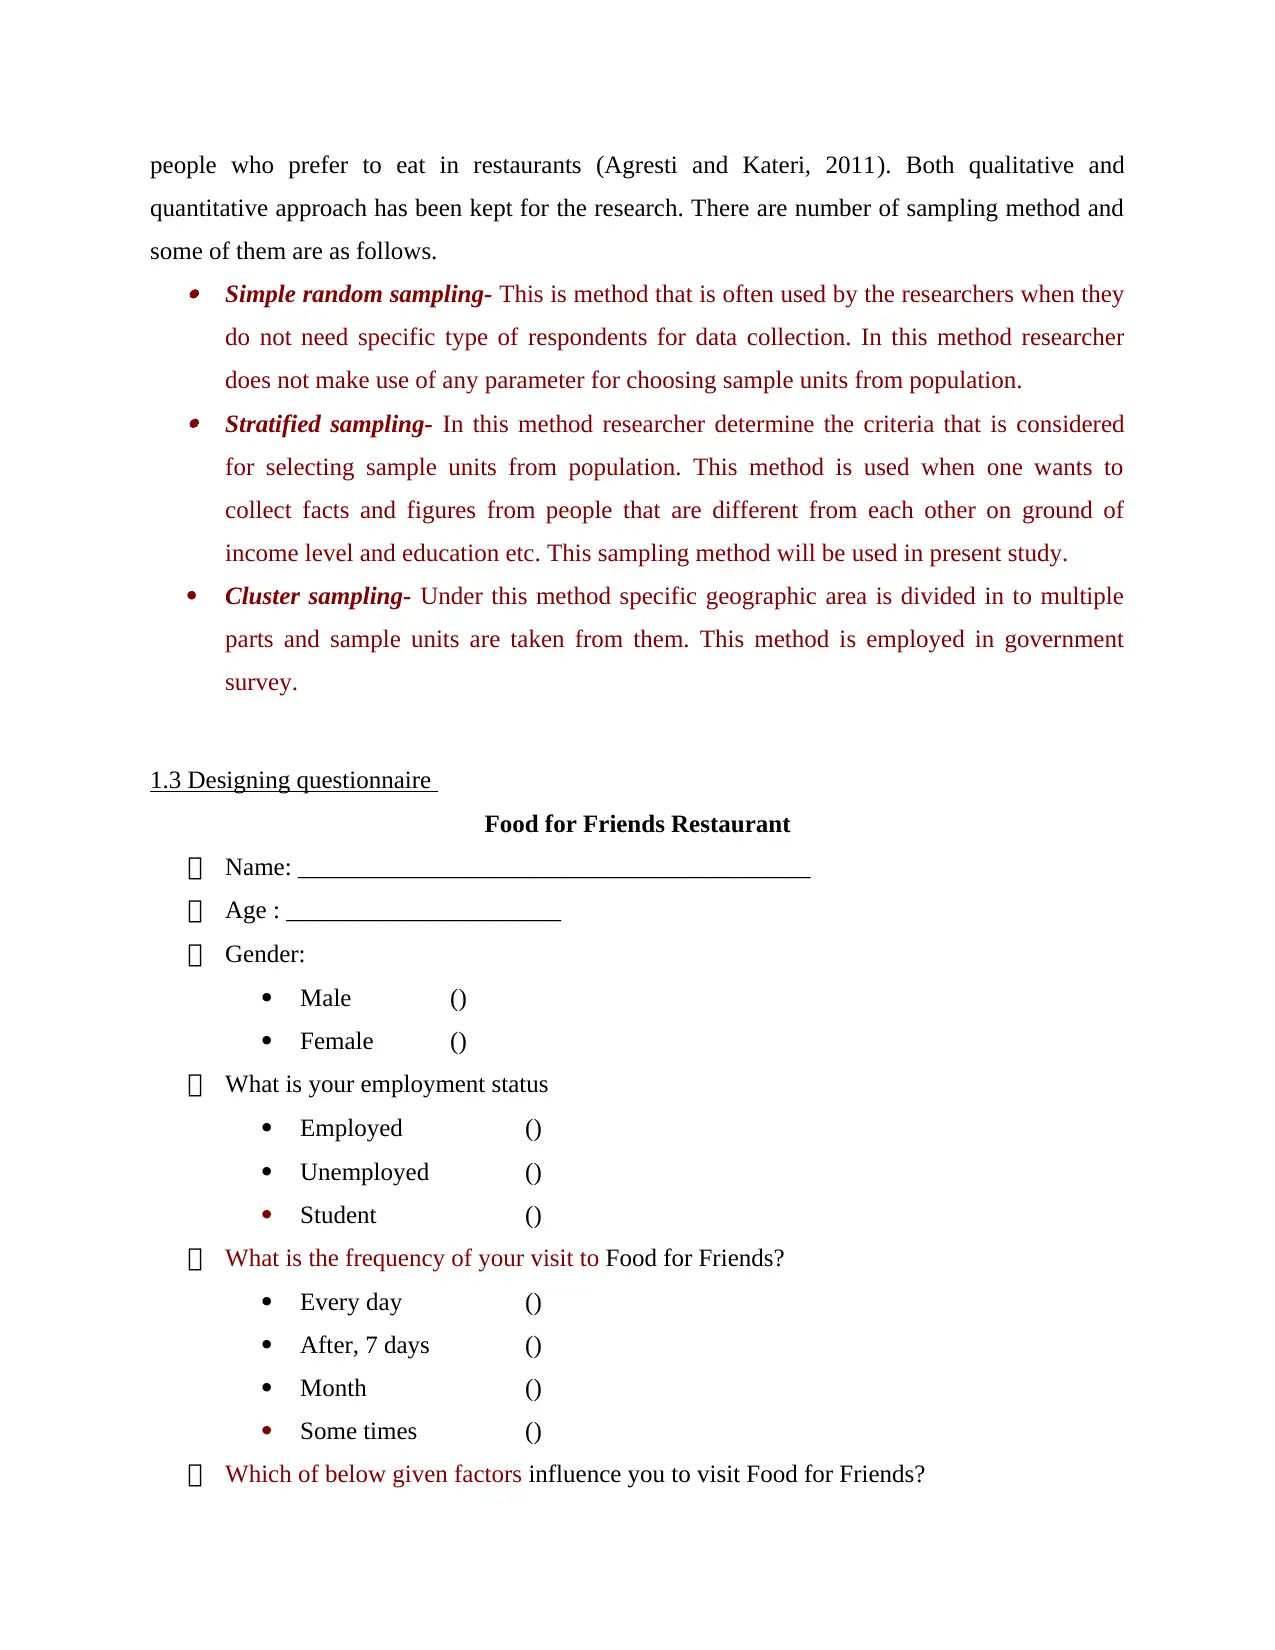
1.3 Designing questionnaire
Food for Friends Restaurant
Name: _________________________________________
Age : ______________________
Gender:
Male ()
Female ()
What is your employment status
Employed ()
Unemployed ()
Student ()
What is the frequency of your visit to Food for Friends?
Every day ()
After, 7 days ()
Month ()
Some times ()
Which of below given factors influence you to visit Food for Friends?
quantitative approach has been kept for the research. There are number of sampling method and
some of them are as follows. Simple random sampling- This is method that is often used by the researchers when they
do not need specific type of respondents for data collection. In this method researcher
does not make use of any parameter for choosing sample units from population. Stratified sampling- In this method researcher determine the criteria that is considered
for selecting sample units from population. This method is used when one wants to
collect facts and figures from people that are different from each other on ground of
income level and education etc. This sampling method will be used in present study.
Cluster sampling- Under this method specific geographic area is divided in to multiple
parts and sample units are taken from them. This method is employed in government
survey.
1.3 Designing questionnaire
Food for Friends Restaurant
Name: _________________________________________
Age : ______________________
Gender:
Male ()
Female ()
What is your employment status
Employed ()
Unemployed ()
Student ()
What is the frequency of your visit to Food for Friends?
Every day ()
After, 7 days ()
Month ()
Some times ()
Which of below given factors influence you to visit Food for Friends?
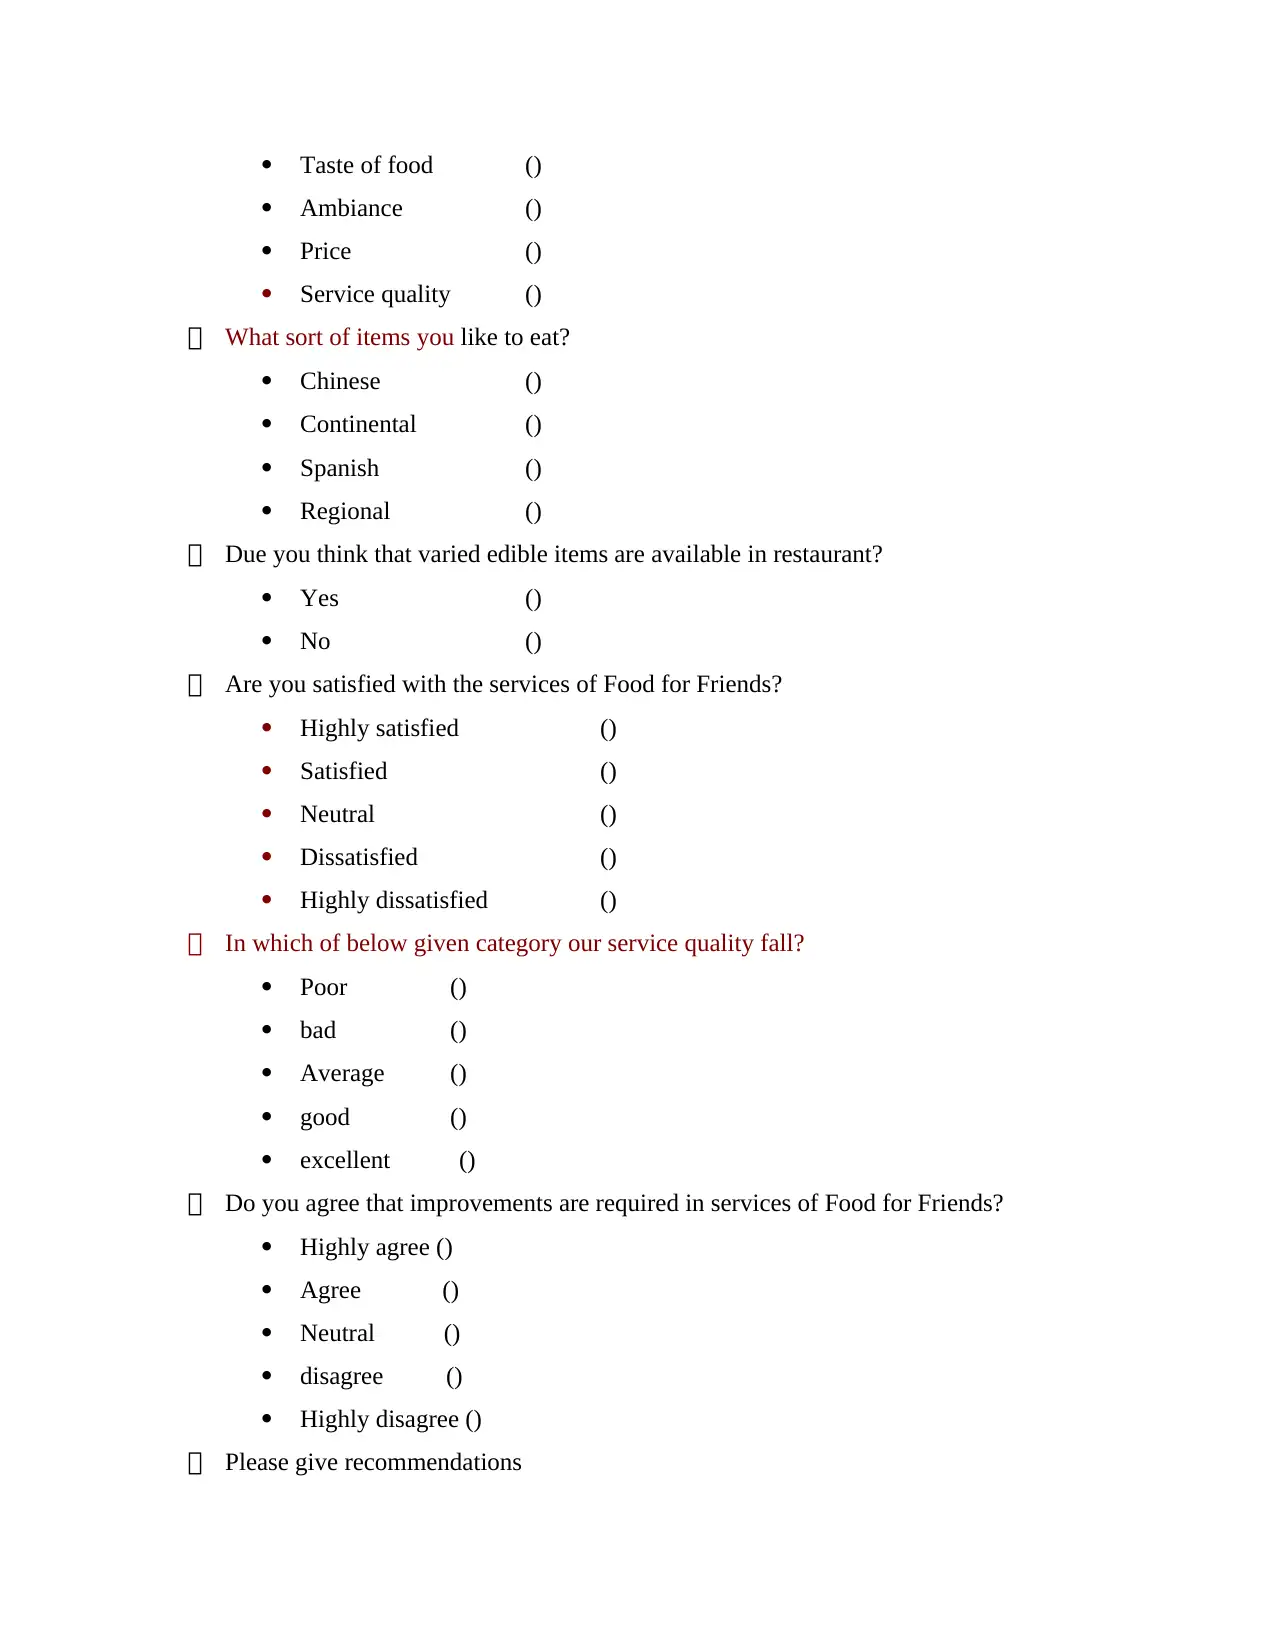
Taste of food ()
Ambiance ()
Price ()
Service quality ()
What sort of items you like to eat?
Chinese ()
Continental ()
Spanish ()
Regional ()
Due you think that varied edible items are available in restaurant?
Yes ()
No ()
Are you satisfied with the services of Food for Friends?
Highly satisfied ()
Satisfied ()
Neutral ()
Dissatisfied ()
Highly dissatisfied ()
In which of below given category our service quality fall?
Poor ()
bad ()
Average ()
good ()
excellent ()
Do you agree that improvements are required in services of Food for Friends?
Highly agree ()
Agree ()
Neutral ()
disagree ()
Highly disagree ()
Please give recommendations
⊘ This is a preview!⊘
Do you want full access?
Subscribe today to unlock all pages.
Trusted by 1+ million students worldwide
TASK 2
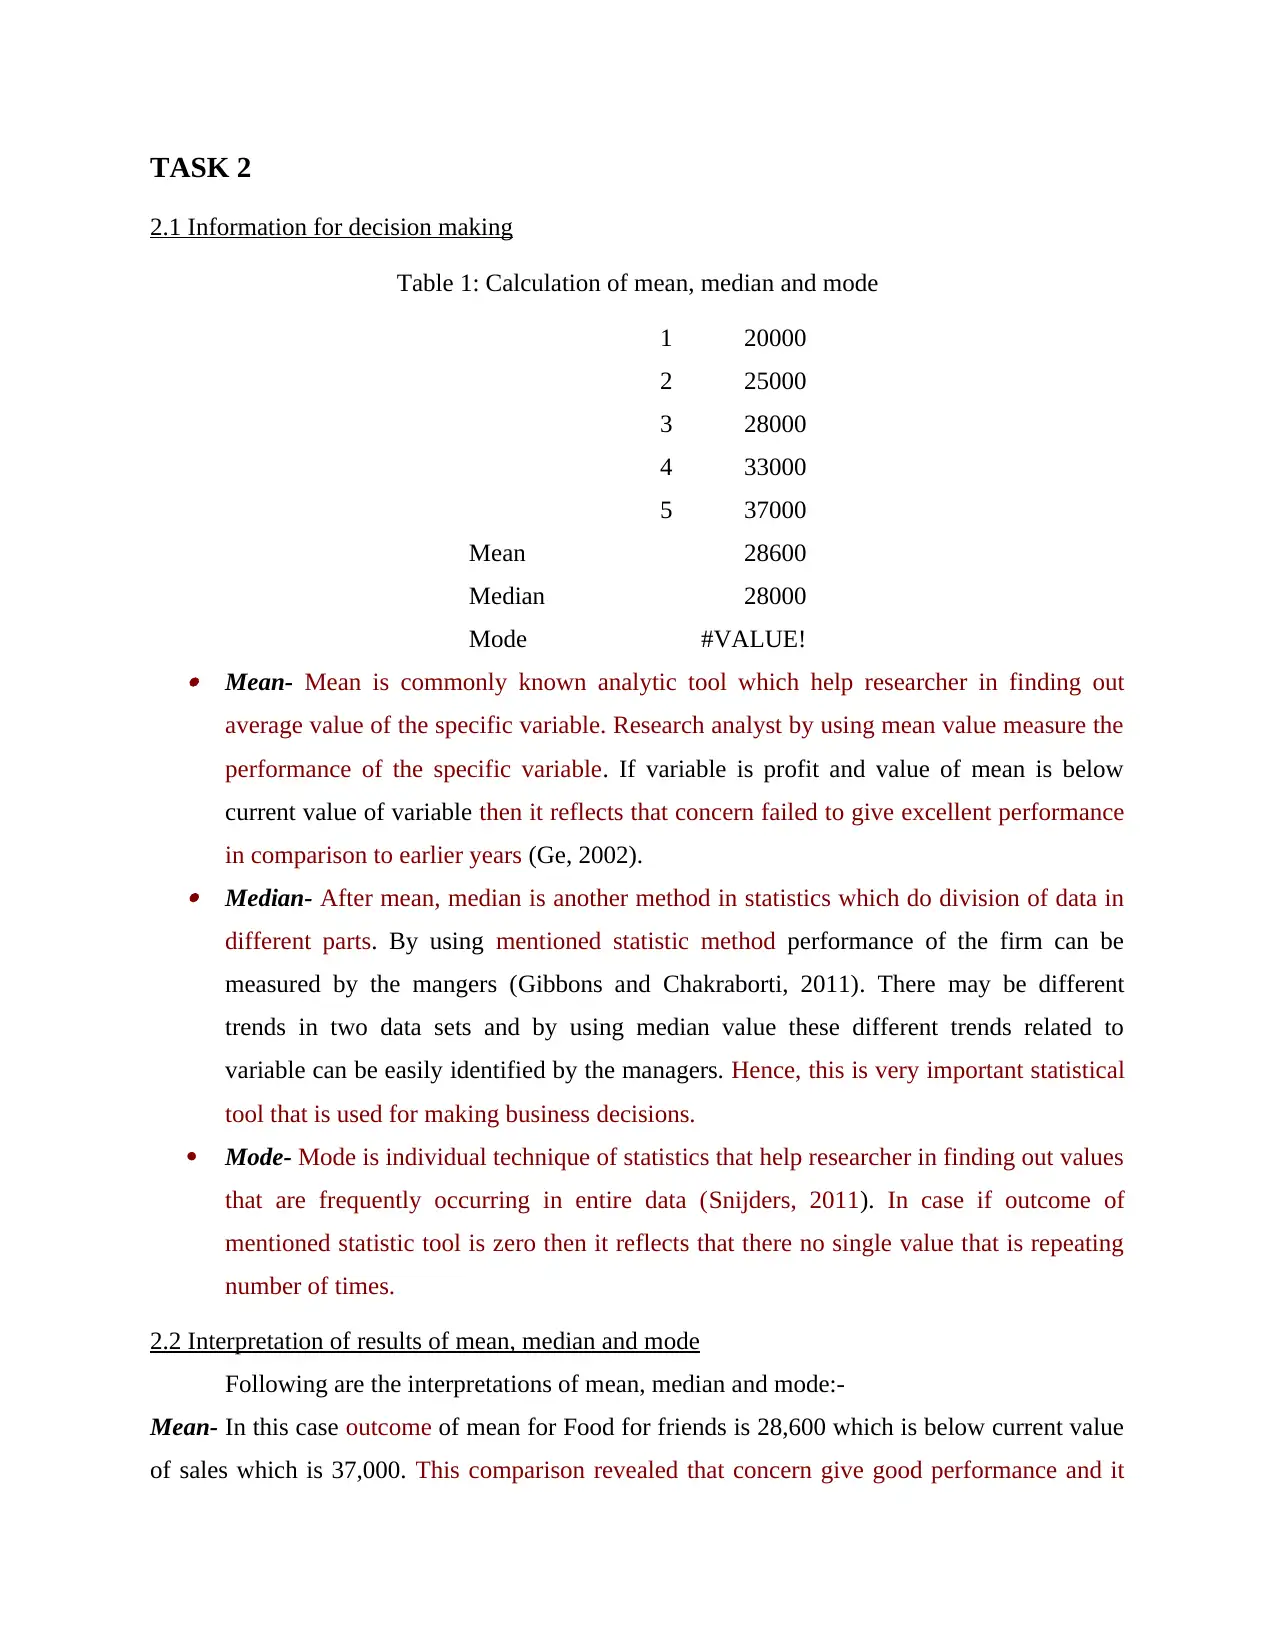
2.1 Information for decision making
Table 1: Calculation of mean, median and mode
1 20000
2 25000
3 28000
4 33000
5 37000
Mean 28600
Median 28000
Mode #VALUE! Mean- Mean is commonly known analytic tool which help researcher in finding out
average value of the specific variable. Research analyst by using mean value measure the
performance of the specific variable. If variable is profit and value of mean is below
current value of variable then it reflects that concern failed to give excellent performance
in comparison to earlier years (Ge, 2002). Median- After mean, median is another method in statistics which do division of data in
different parts. By using mentioned statistic method performance of the firm can be
measured by the mangers (Gibbons and Chakraborti, 2011). There may be different
trends in two data sets and by using median value these different trends related to
variable can be easily identified by the managers. Hence, this is very important statistical
tool that is used for making business decisions.
Mode- Mode is individual technique of statistics that help researcher in finding out values
that are frequently occurring in entire data (Snijders, 2011). In case if outcome of
mentioned statistic tool is zero then it reflects that there no single value that is repeating
number of times.
2.2 Interpretation of results of mean, median and mode
Following are the interpretations of mean, median and mode:-
Mean- In this case outcome of mean for Food for friends is 28,600 which is below current value
of sales which is 37,000. This comparison revealed that concern give good performance and it
Paraphrase This Document
Need a fresh take? Get an instant paraphrase of this document with our AI Paraphraser
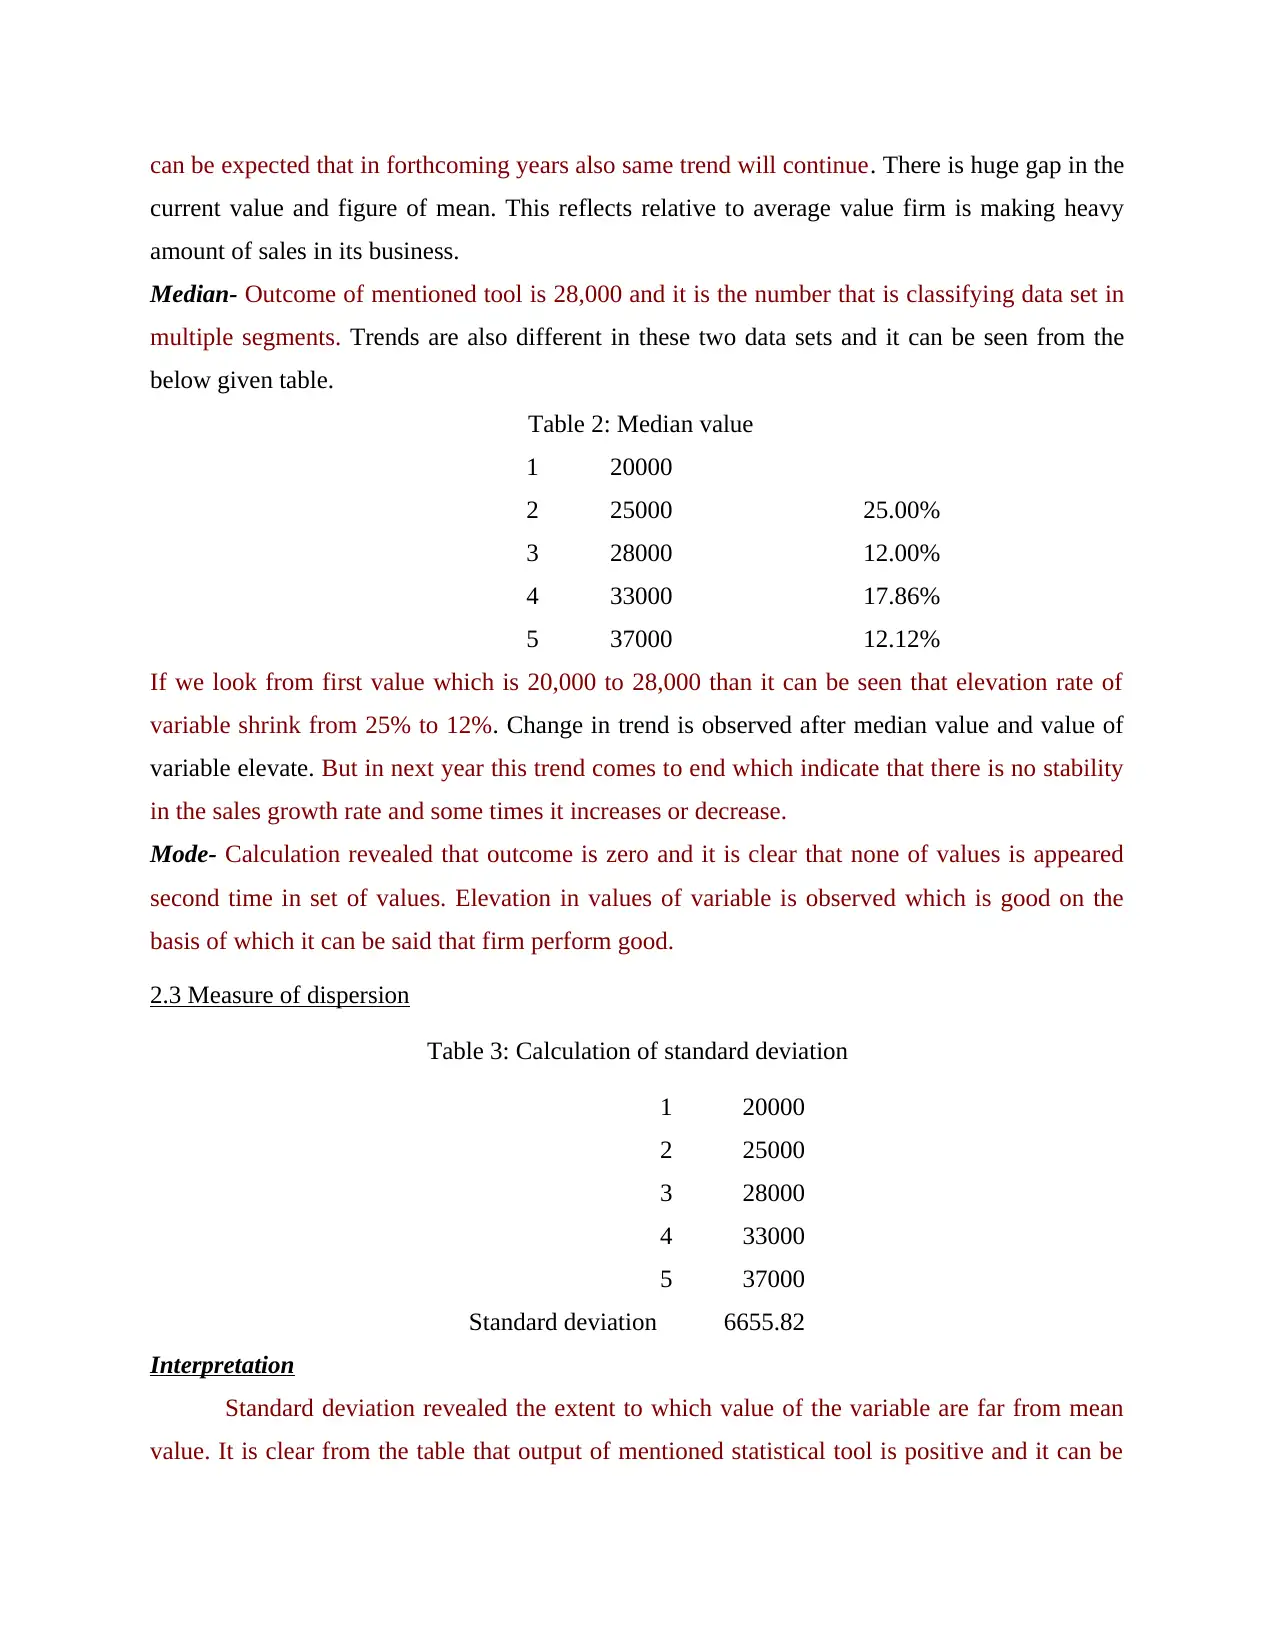
can be expected that in forthcoming years also same trend will continue. There is huge gap in the
current value and figure of mean. This reflects relative to average value firm is making heavy
amount of sales in its business.
Median- Outcome of mentioned tool is 28,000 and it is the number that is classifying data set in
multiple segments. Trends are also different in these two data sets and it can be seen from the
below given table.
Table 2: Median value
1 20000
2 25000 25.00%
3 28000 12.00%
4 33000 17.86%
5 37000 12.12%
If we look from first value which is 20,000 to 28,000 than it can be seen that elevation rate of
variable shrink from 25% to 12%. Change in trend is observed after median value and value of
variable elevate. But in next year this trend comes to end which indicate that there is no stability
in the sales growth rate and some times it increases or decrease.
Mode- Calculation revealed that outcome is zero and it is clear that none of values is appeared
second time in set of values. Elevation in values of variable is observed which is good on the
basis of which it can be said that firm perform good.
2.3 Measure of dispersion
Table 3: Calculation of standard deviation
1 20000
2 25000
3 28000
4 33000
5 37000
Standard deviation 6655.82
Interpretation
Standard deviation revealed the extent to which value of the variable are far from mean
value. It is clear from the table that output of mentioned statistical tool is positive and it can be
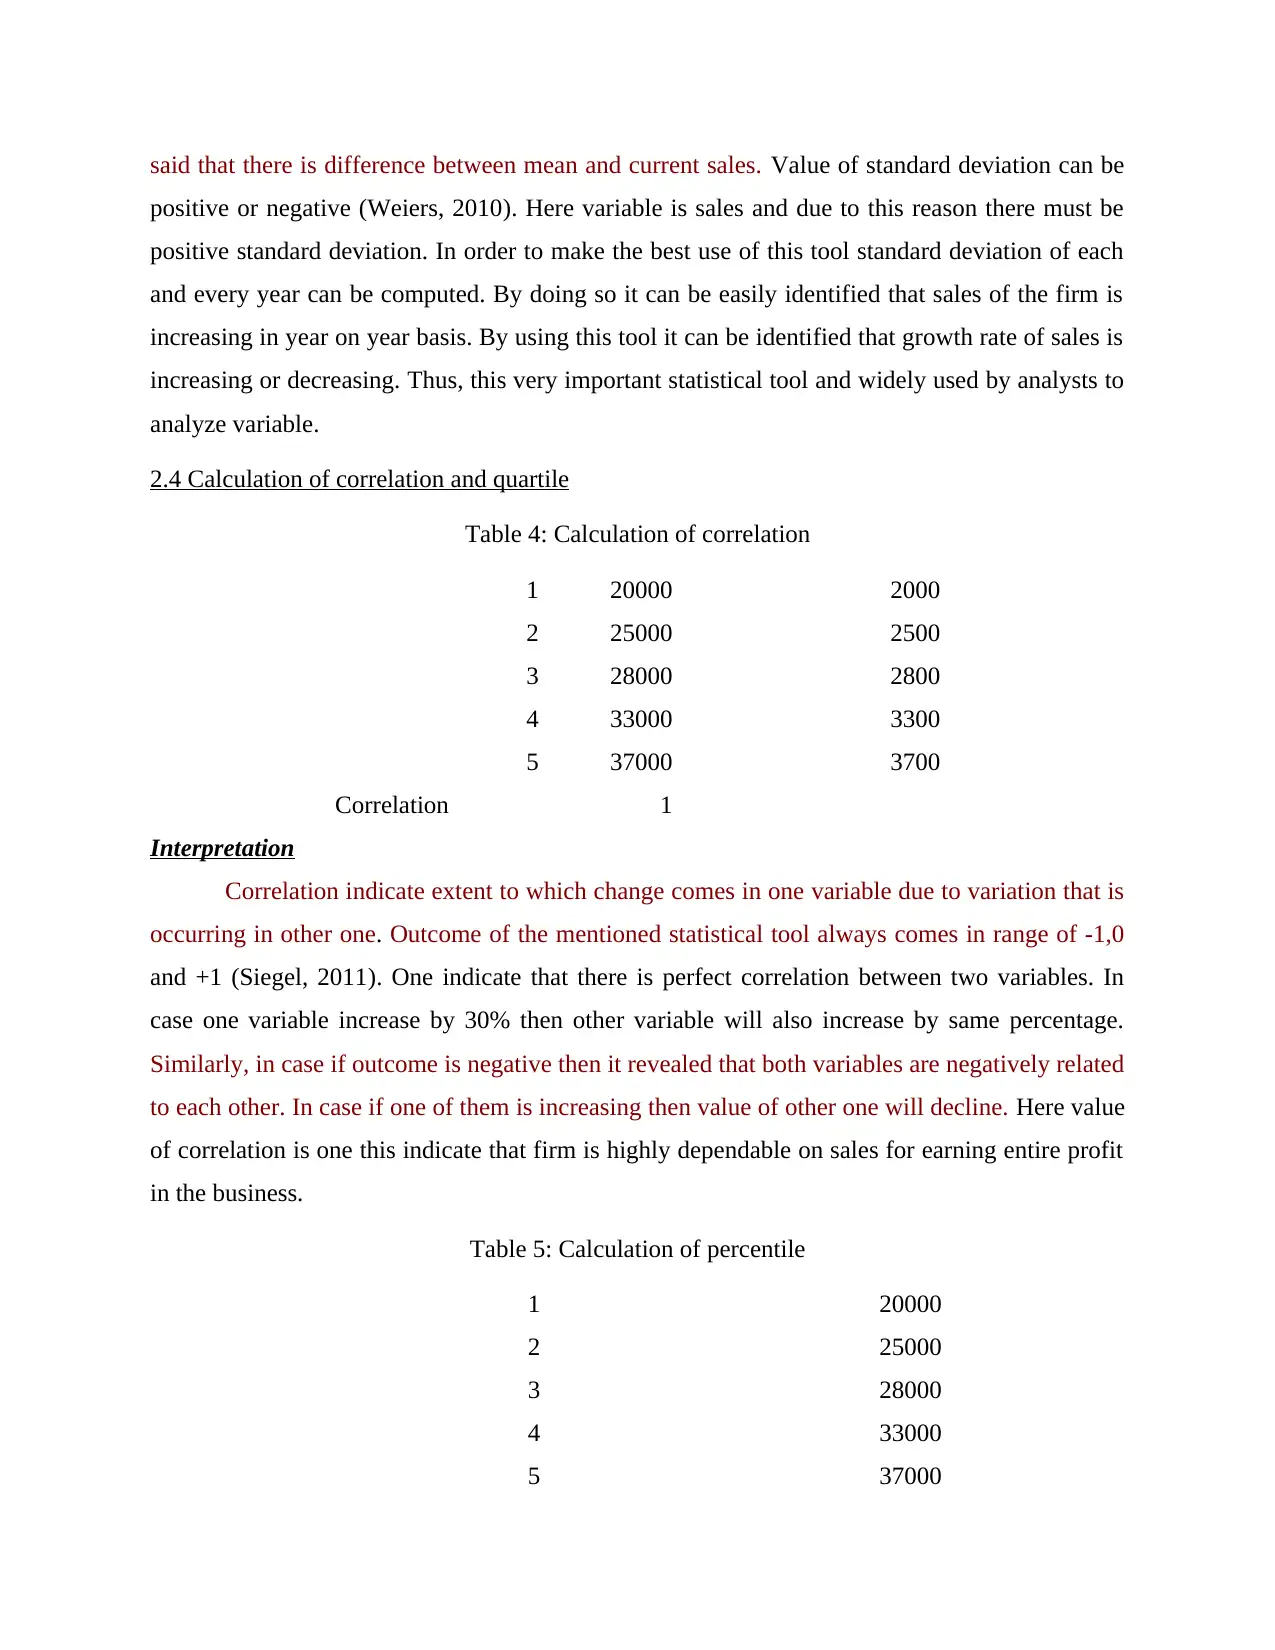
said that there is difference between mean and current sales. Value of standard deviation can be
positive or negative (Weiers, 2010). Here variable is sales and due to this reason there must be
positive standard deviation. In order to make the best use of this tool standard deviation of each
and every year can be computed. By doing so it can be easily identified that sales of the firm is
increasing in year on year basis. By using this tool it can be identified that growth rate of sales is
increasing or decreasing. Thus, this very important statistical tool and widely used by analysts to
analyze variable.
2.4 Calculation of correlation and quartile
Table 4: Calculation of correlation
1 20000 2000
2 25000 2500
3 28000 2800
4 33000 3300
5 37000 3700
Correlation 1
Interpretation
Correlation indicate extent to which change comes in one variable due to variation that is
occurring in other one. Outcome of the mentioned statistical tool always comes in range of -1,0
and +1 (Siegel, 2011). One indicate that there is perfect correlation between two variables. In
case one variable increase by 30% then other variable will also increase by same percentage.
Similarly, in case if outcome is negative then it revealed that both variables are negatively related
to each other. In case if one of them is increasing then value of other one will decline. Here value
of correlation is one this indicate that firm is highly dependable on sales for earning entire profit
in the business.
Table 5: Calculation of percentile
1 20000
2 25000
3 28000
4 33000
5 37000
⊘ This is a preview!⊘
Do you want full access?
Subscribe today to unlock all pages.
Trusted by 1+ million students worldwide
Q1 25000
Q2 28000
Q3 33000
Interpretation
It divides entire data in to several parts like median. In quartile data is divided in to three
parts (Gentle, Härdle and Mori, 2012). Value of all mentioned statistical tool is increasing which
reflect that value of variable is enhancing with passage of time period. Quartile and percentile are
same statistical tool only method of calculation is different and both methods produce same
results.
TASK 3
3.1 Analysis of primary data
What are the factors which influence you to visit Food for Friends?
Table 6: People response on factors which influence them to visit Food for Friends?
Taste for food 20
Ambiance 5
Price 20
Service quality 5
Paraphrase This Document
Need a fresh take? Get an instant paraphrase of this document with our AI Paraphraser
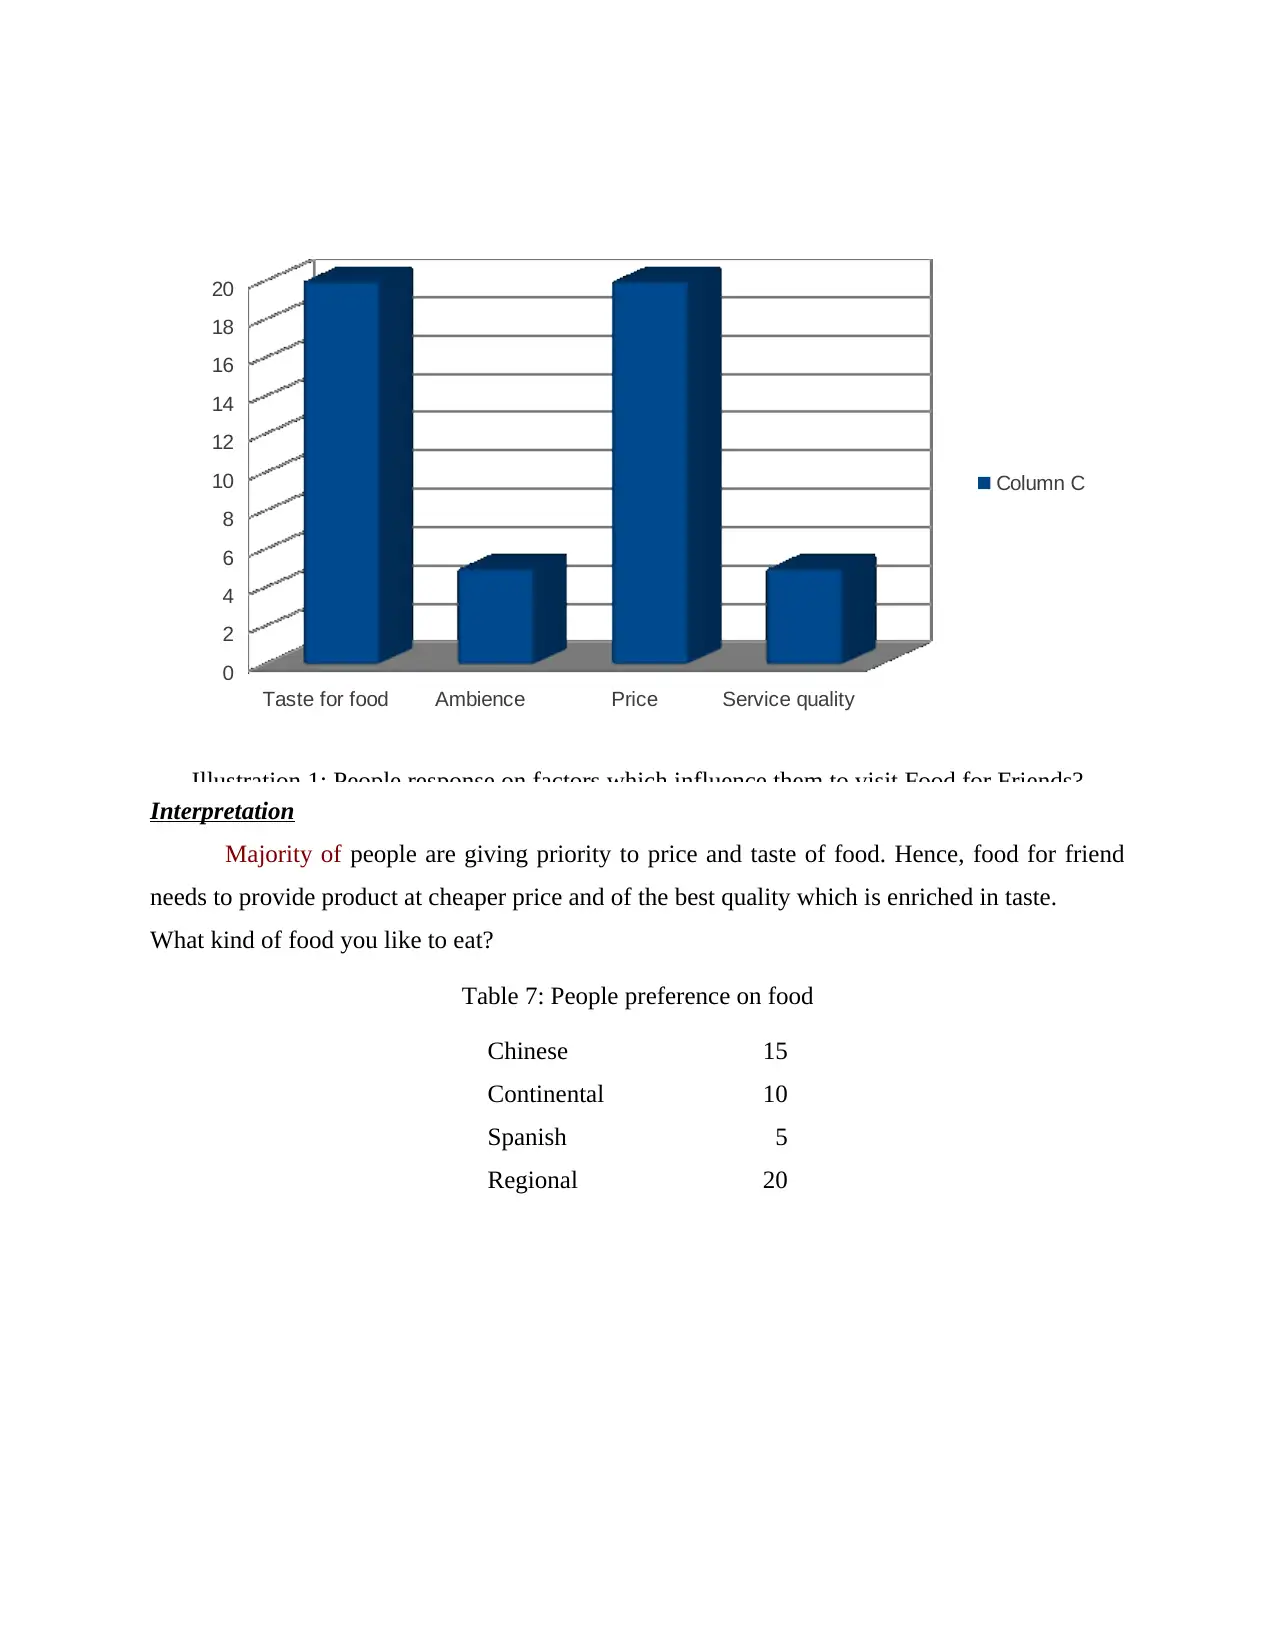
Interpretation
Majority of people are giving priority to price and taste of food. Hence, food for friend
needs to provide product at cheaper price and of the best quality which is enriched in taste.
What kind of food you like to eat?
Table 7: People preference on food
Chinese 15
Continental 10
Spanish 5
Regional 20
Taste for food Ambience Price Service quality
0
2
4
6
8
10
12
14
16
18
20
Column C
Illustration 1: People response on factors which influence them to visit Food for Friends?
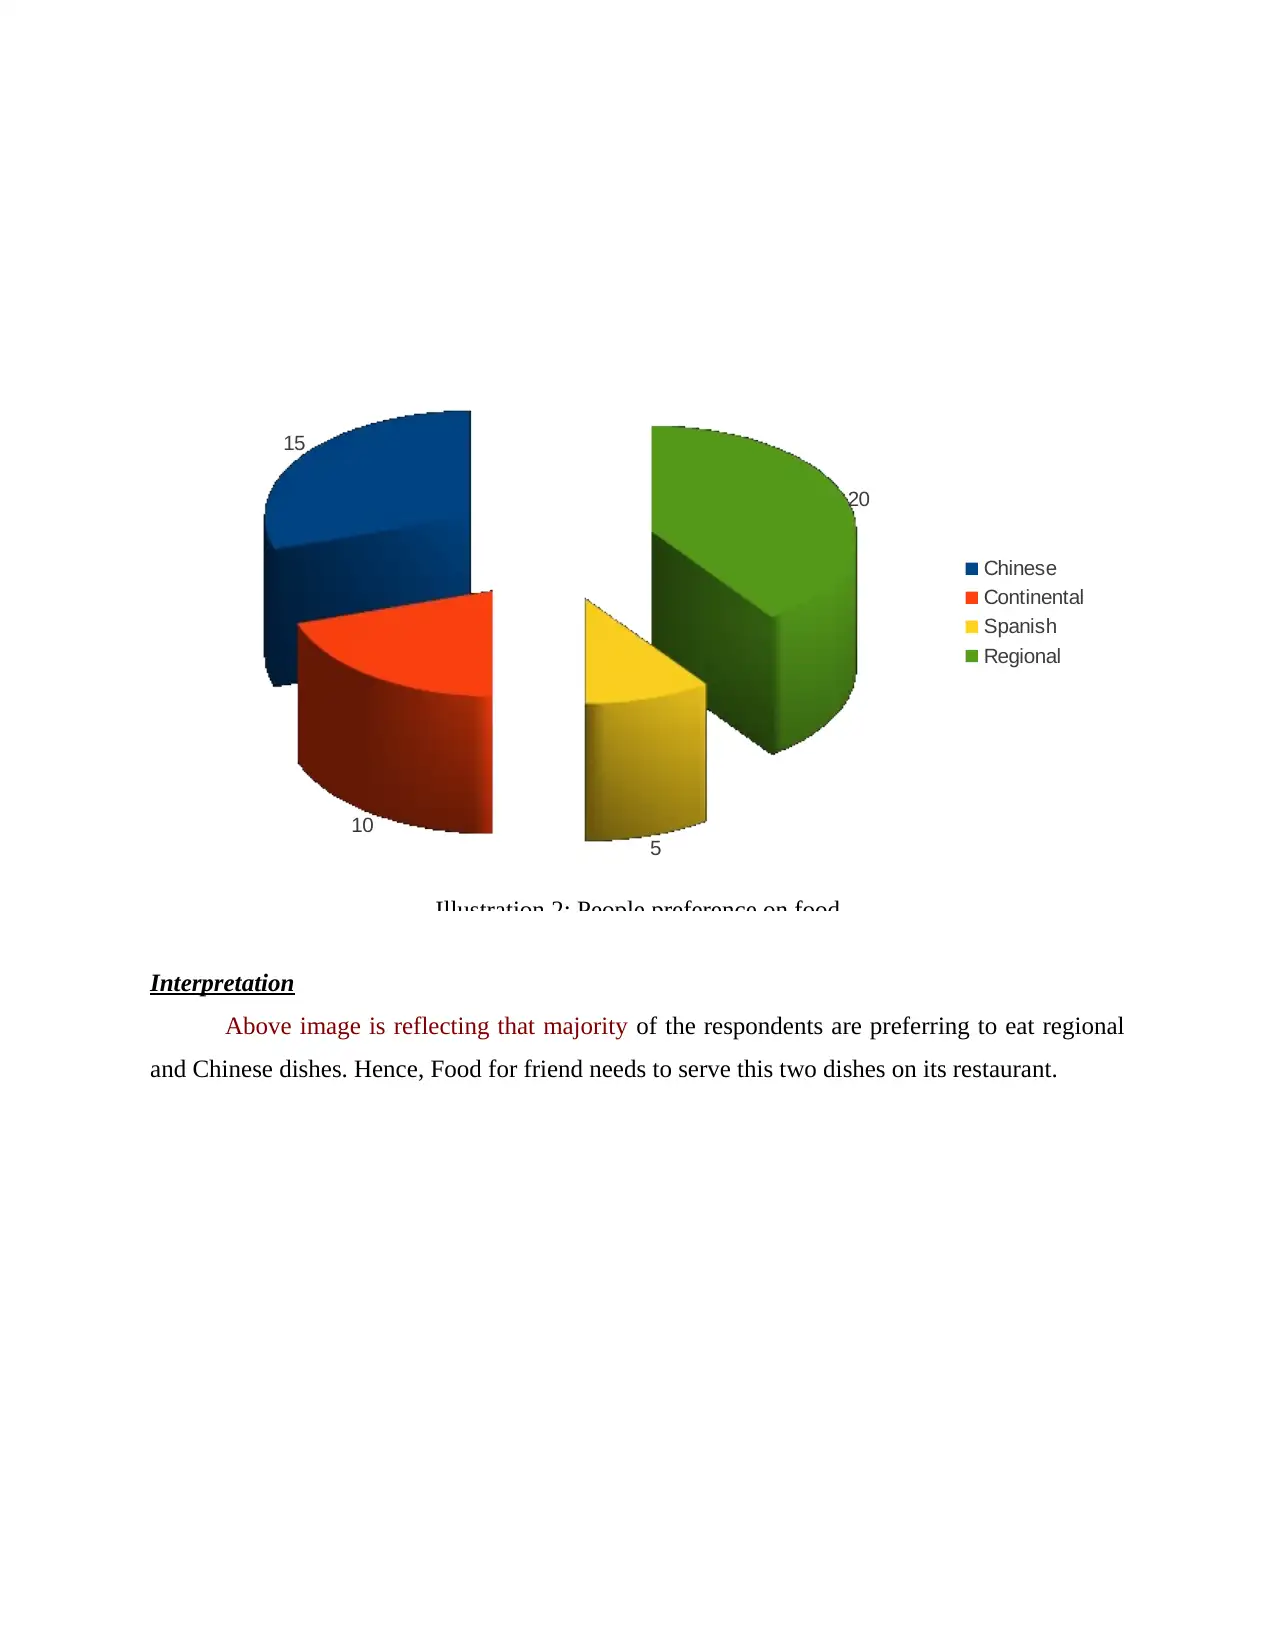
Interpretation
Above image is reflecting that majority of the respondents are preferring to eat regional
and Chinese dishes. Hence, Food for friend needs to serve this two dishes on its restaurant.
15
10
5
20
Chinese
Continental
Spanish
Regional
Illustration 2: People preference on food
Above image is reflecting that majority of the respondents are preferring to eat regional
and Chinese dishes. Hence, Food for friend needs to serve this two dishes on its restaurant.
15
10
5
20
Chinese
Continental
Spanish
Regional
Illustration 2: People preference on food
⊘ This is a preview!⊘
Do you want full access?
Subscribe today to unlock all pages.
Trusted by 1+ million students worldwide
1 out of 19
Related Documents


Your All-in-One AI-Powered Toolkit for Academic Success.
+13062052269
info@desklib.com
Available 24*7 on WhatsApp / Email
![[object Object]](/_next/static/media/star-bottom.7253800d.svg)
Unlock your academic potential
Copyright © 2020–2026 A2Z Services. All Rights Reserved. Developed and managed by ZUCOL.