Business Decision Making Report: Data Analysis for XYZ Hotel London
VerifiedAdded on 2019/12/03
|19
|4168
|275
Report
AI Summary
This report provides a detailed analysis of business decision-making for the hypothetical XYZ hotel chain, which is considering setting up a hotel in London. The report begins with an introduction highlighting the importance of data-driven decisions and then moves into Task 1, which covers data collection methods, including primary and secondary data sources, and survey methodology. The report includes a questionnaire designed to gather relevant market information. Data collected, including sales and expenditure figures, is then summarized using representative values and analyzed through various statistical tools, such as mean, median, mode, standard deviation, measures of dispersion, quartiles, percentiles, and correlation. Task 2 focuses on graphical representations and capital budgeting techniques, including trend lines and a business report summarizing the findings. The report concludes that opening a hotel in London is a feasible option based on the positive results obtained through the data analysis and statistical tools. The report also uses information processing tools and provides a project plan for an activity, alongside the use of financial tools to aid in decision-making.

Business decision making
Paraphrase This Document
Need a fresh take? Get an instant paraphrase of this document with our AI Paraphraser
TABLE OF CONTENTS
INTRODUCTION...........................................................................................................................1
TASK 1 DATA COLLECTION......................................................................................................1
1.1 Collection of primary and secondary data.............................................................................1
1.2 Survey methodology..............................................................................................................2
1.3 Questionnaire for given business problem............................................................................2
2.1 Collect data and summarize the collected data using representative values..........................4
2.2 Analyze the collected data.....................................................................................................4
2.3 Measures of dispersion..........................................................................................................5
2.4 Your calculations must include quartile, percentiles and the correlation..............................5
TASK 2 GRAPHS AND CAPITAL BUDGETING TECHNIQUES.............................................6
3.1 Graph conclusion...................................................................................................................6
3.2 Trend line...............................................................................................................................7
3.3 Business presentation.............................................................................................................7
3.4 Business report.......................................................................................................................7
4.1 Information processing tools.................................................................................................8
4.2 Project plan for an activity.....................................................................................................9
4.3 Use financial tools for decision making..............................................................................10
CONCLUSION..............................................................................................................................13
REFERENCES..............................................................................................................................14

TABLE OF FIGURES
Figure 1: Graph of sales and expenses data.....................................................................................6
Figure 2: trend line for sales and expenses of XYZ........................................................................7
Figure 3: Gantt chart........................................................................................................................9
Figure 4: Critical path....................................................................................................................10
⊘ This is a preview!⊘
Do you want full access?
Subscribe today to unlock all pages.
Trusted by 1+ million students worldwide

Paraphrase This Document
Need a fresh take? Get an instant paraphrase of this document with our AI Paraphraser
INTRODUCTION
Decision making quality of the organization is significantly influenced by the quality of
information underlying the decisions. There are various sources through which an entity can
gather useful data that serves its purpose of arriving at timely and relevant information. It is
therefore crucial for every organization to take reasonable initiatives to come up with reasonable
conclusions about the source through which it can get the desired information and identify the
techniques through which the gathered data can be analyzed to derive the useful results. In the
assigned unit, we are taking hypothetical example XYZ hotel chain which is intending to set up
its hotel in London and keen to know whether its action would be viable or not. Therefore, the
discussion undertaken in aforesaid paragraphs will assist it in deciding as to whether it shall
resort to such a move or not.
TASK 1 DATA COLLECTION
1.1 Collection of primary and secondary data
Data can be collected through primary as well as secondary means. While primary means
are concerned with capturing data directly from the target population, secondary means place
reliance on external sources which gives an insight of trends prevailing in the market and people
´s attitude towards the specific industry (Sapsford and Jupp, 2006). Given below are some of the
techniques through which primary and secondary data can be gathered by the organization.
Primary data can be collected through: Interview – It involves personal interaction with the concerned audience in order to gain
in depth understanding of their preferences and their perceptions about the particular
industry. Questionnaires – In this technique, questionnaire is prepared covering relevant aspects
and circulated among the target audience to get an overview about the situations
prevailing in the market.
Observations – It deals with observing the trend to gather general understanding about
people’s attitude towards the concerned industry.
Secondary data can be collected through external sources such as newspapers, magazines,
journals, internet etc. which gives general information about trends prevailing in market and
performance of the concerned industry (Lusthaus, 2000). However, information collected
1
through secondary sources is useful only to limited extent as compared to the information
collected through primary means because secondary data usually offers a broader perspective
which cannot be relied upon as a strong basis for formulating strategic as well as long term
decisions. Accordingly, it is advisable for XYZ to collect information about the prevailing
market trends in London through primary sources as against secondary sources in order to
facilitate effective decision making.
1.2 Survey methodology
Survey methodology refers to selection and study of samples from the target population
and identifying the techniques through which collected data can be analyzed in order to arrive at
reasonable inferences. The sample is selected in such a way that it is representative of the entire
population being targeted and is not just confined to any particular section of the society.
Sampling can be either probabilistic sampling or non probabilistic sampling (Ryan and Ryan,
2002). A brief description of these sampling techniques has been given as follows:
Under probabilistic sampling, samples are selected from the target population in such a
manner that they represent the whole population. The level of confidence is high and
probability of error occurrence is comparatively low as compared to the non probabilistic
sampling.
Non probabilistic sampling – Under this sampling techniques, samples are selected
haphazardly without giving consideration as to whether they are apt for the purpose to be
achieved.
As far as XYZ is concerned, it is advisable for it to go for probabilistic sampling since it
can be observed as more convenient means of yielding relevant outcomes as compared to non
probabilistic sampling.
1.3 Questionnaire for given business problem
1. Name:
2. Age:
3. Gender:
Male
Female
4. Marital status:
2
⊘ This is a preview!⊘
Do you want full access?
Subscribe today to unlock all pages.
Trusted by 1+ million students worldwide
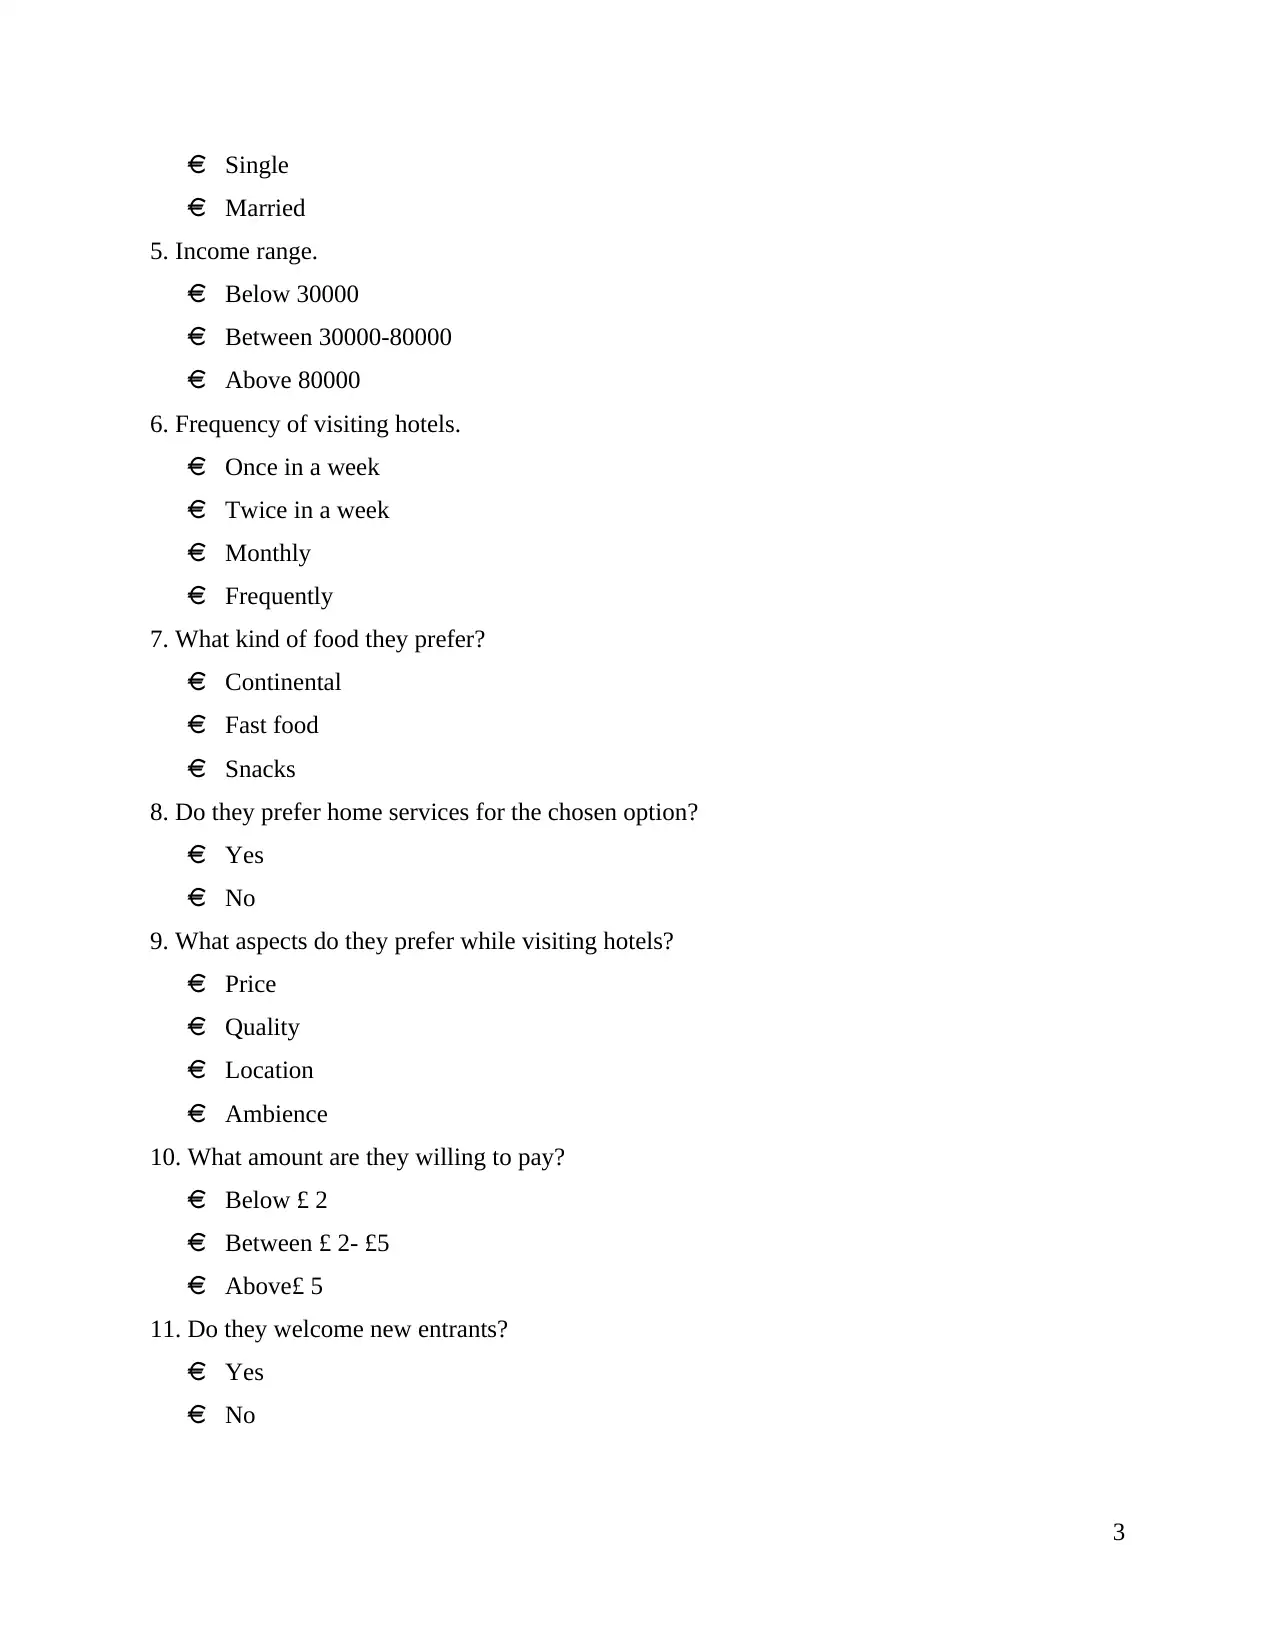
Single
Married
5. Income range.
Below 30000
Between 30000-80000
Above 80000
6. Frequency of visiting hotels.
Once in a week
Twice in a week
Monthly
Frequently
7. What kind of food they prefer?
Continental
Fast food
Snacks
8. Do they prefer home services for the chosen option?
Yes
No
9. What aspects do they prefer while visiting hotels?
Price
Quality
Location
Ambience
10. What amount are they willing to pay?
Below £ 2
Between £ 2- £5
Above£ 5
11. Do they welcome new entrants?
Yes
No
3
Paraphrase This Document
Need a fresh take? Get an instant paraphrase of this document with our AI Paraphraser
2.1Collect data and summarize the collected data using representative values
Table 1: Sales data for XYZ
2006 2007 2008 2009 2010 2011 2012 2013
Sales (in £) 10000 15000 18000 19000 18500 18000 20000 25000
Expenditure on services (in £) 3000 3800 4000 5000 4500 5000 8000 10000
2.2 Analyze the collected data
Table 2: Analysis of sales data of XYZ
Sales
Mean 17937.5
Standard Error 1507.24
Median 18250
Mode 18000
Standard Deviation 4263.11
Sample Variance 1.8E+07
Kurtosis 1.90043
Skewness -0.4008
Range 15000
Minimum 10000
Maximum 25000
Sum 143500
Count 8
Confidence Level(95.0%) 3564.05
Mean: It refers to the average of all the values and is measured by dividing all the
numbers by number of elements in a given set.
Mean = Sum of all the elements / number of elements
In the present scenario mean for sales is 17937.5 Median: It is regarded as the middle value given in set of element which contains odd
number of values. Median for the present data is 18250 Mode: It is the number that is present in given set of data most frequently. In the present
case no number is repeating so it is not possible to calculate mode.
4
Standard deviation: It provides idea how close is the entire set of data to the average.
Furthermore, it provides information in relation with how spread out information is.
Standard deviation for sales is 4263.11.
After applying all the statistical tools it can be easily said that option linked with opening
up of new restaurant in London is feasible as every tool is representing positive result and
business can grab large amount of opportunities by implementing the plan.
2.3Measures of dispersion.
Table 3: Measures of dispersion
Sales
Variance 5618393
Standard deviation 2370.31
Range 7000
Measure of dispersion helps in determining how squeezed a particular distribution is and
takes into consideration variance, standard deviations and inter-quartile range. In many cases it is
possible that two set of elements are interlinked in terms of their mean but they totally differs
from one another.
5
Exp on services
Mean 5412.5
Standard Error 838.033
Median 4750
Mode 5000
Standard Deviation 2370.31
Sample Variance 5618393
Kurtosis 0.89015
Skewness 1.31466
Range 7000
Minimum 3000
Maximum 10000
Sum 43300
Count 8
Confidence Level(95.0%) 1981.63
⊘ This is a preview!⊘
Do you want full access?
Subscribe today to unlock all pages.
Trusted by 1+ million students worldwide
Variance: It refers to the average of squared differences from mean and to calculate
variance it is necessary to determine mean first. It also helps in identifying the exact
range at which set of elements are spread out. In the present scenario variance for sales is
5618393. Standard deviation: It helps in knowing about amount of variation from range and is the
square root of variance. Standard deviation for sales is 2370.31
Range: It is calculated by deducting lowest value from highest one. Range for sales is
7000.
So the measures of dispersion calculated are also showing positive results and it is
feasible for management to open its second restaurant chain in London where different
opportunities are present and they can be grabbed easily.
2.4 Your calculations must include quartile, percentiles and the correlation.
Table 4: Quartile and percentiles
Sales Expenses
Quartile1/25th percentile 17250 3950
Quartile2/50th percentile 18250 4750
Quartile3/75th percentile 19250 5750
Quartile4/100th percentile 25000 10000
Table 5: computation of correlation
Row 1 Row 2
Row 1 1
Row 2 0.85611 1
TASK 2 GRAPHS AND CAPITAL BUDGETING TECHNIQUES
3.1 Graph conclusion
GraphsDecisions making quality of the organization is significantly influenced by the
quality of information underlying the decisions. There are various sources through which an
entity can gather useful data that serves its purpose of arriving at timely and relevant information
(Mills, 2000). It is therefore crucial for every organization to take reasonable initiatives to come
up with reasonable conclusions about the source through which it can get the desired information
6
Paraphrase This Document
Need a fresh take? Get an instant paraphrase of this document with our AI Paraphraser
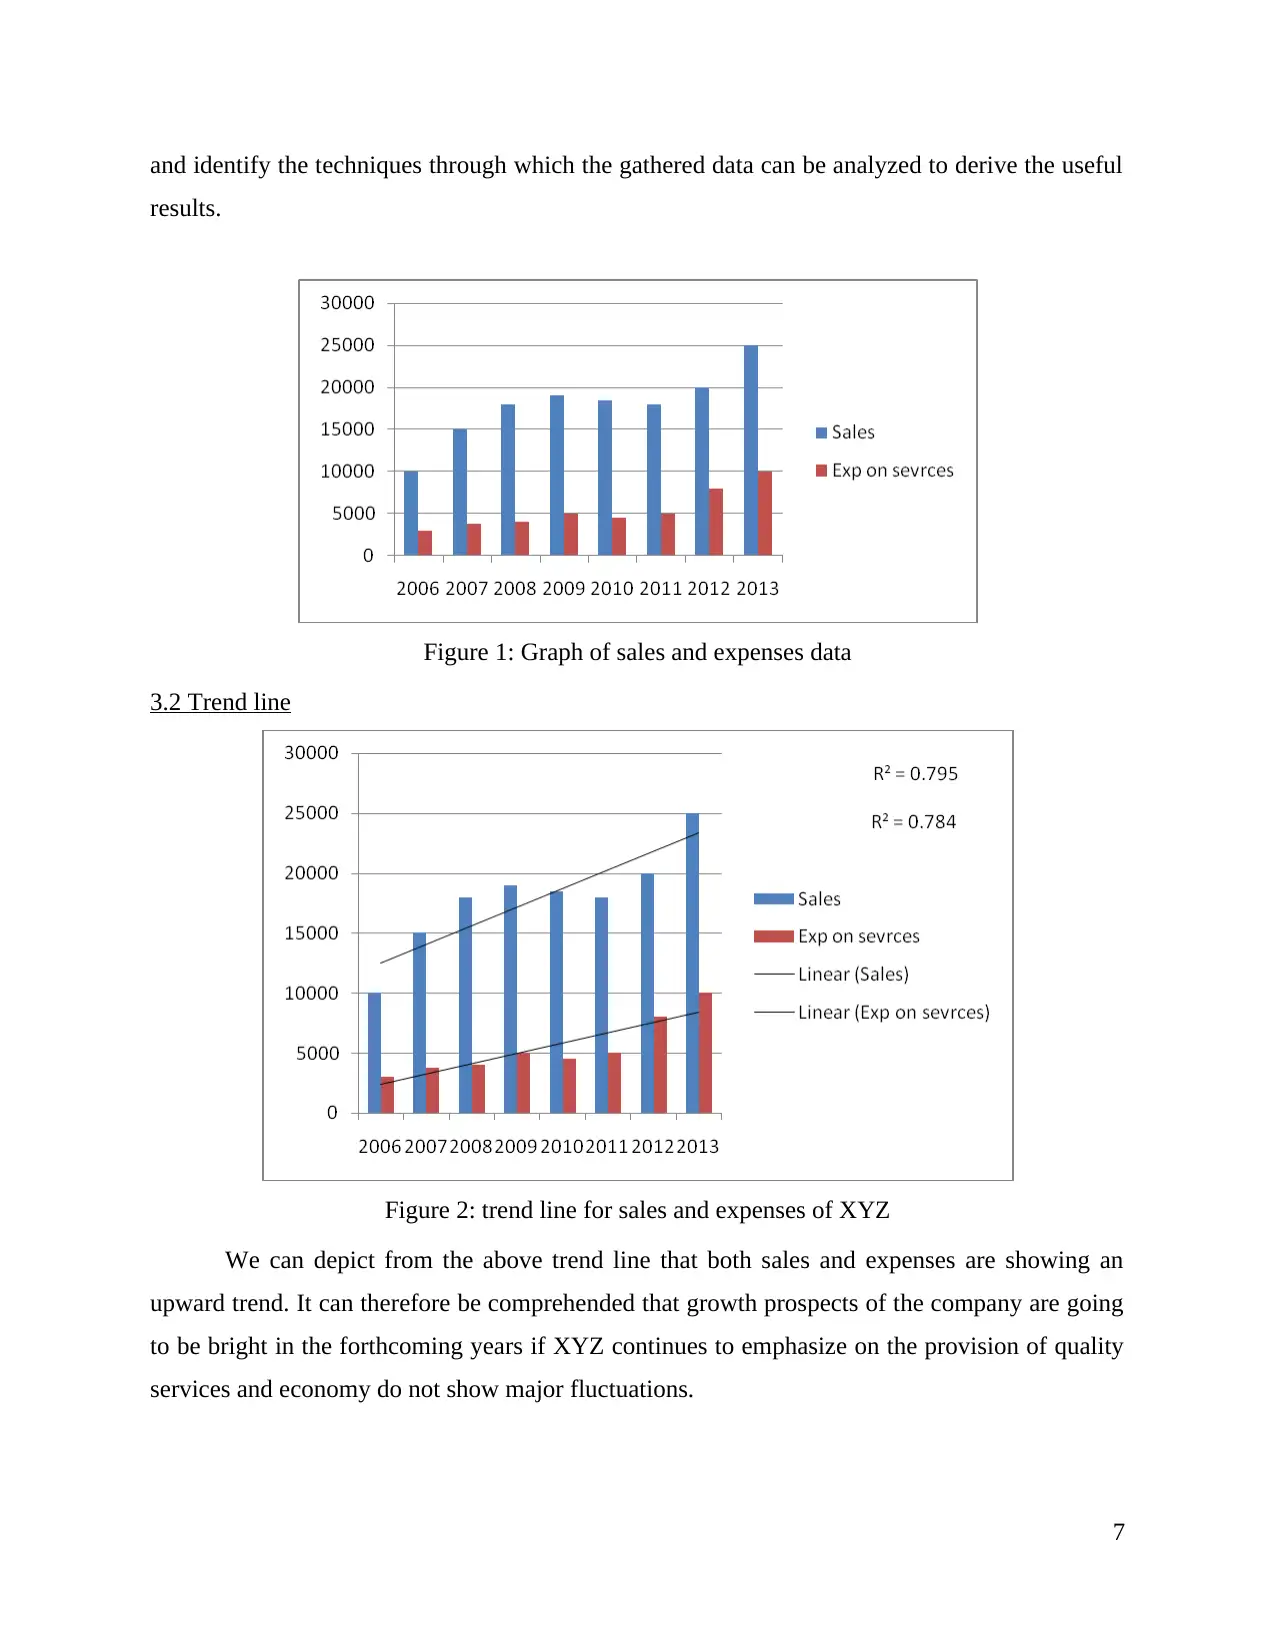
and identify the techniques through which the gathered data can be analyzed to derive the useful
results.
Figure 1: Graph of sales and expenses data
3.2 Trend line
Figure 2: trend line for sales and expenses of XYZ
We can depict from the above trend line that both sales and expenses are showing an
upward trend. It can therefore be comprehended that growth prospects of the company are going
to be bright in the forthcoming years if XYZ continues to emphasize on the provision of quality
services and economy do not show major fluctuations.
7
3.3 Business presentation
Attached ppt
3.4 Business report
Based on the analysis of above statistical data, we can observe that deviation of sales
from the mean is of significant amount insofar as the volume of sales is considered. The
deviation of expenditure from the mean is observed to be high having regard to its quantum
(Simanek, 2014). Hence, it can be said that XYZ has not been able to observe any trend over the
years as regard to the sales pattern and the quantum of expenditure incurred over the years.
Further, the graphical representation of sales reveals that XYZ has not been able to generate
consistently increasing sales over the some of its past years (Engle, 2002). However, reason of
such lower sales has been spotted to be fluctuations in the economy which had an adverse impact
on the growth potential of XYZ in those years. It could further be seen that correlation
coefficient between sales and expenditure on services is coming to be positive which is
indicative of the fact that quantum of sales bears direct connection with the expenditure incurred
on services. Further, the correlation value of 085611 denotes that every 1 rupee of expenditure
has a potential of generating .85611 rupee of sales. Median of 18250 in case of sales reveals that
XYZ has been able to generate 50% of its sales below 18250 and 50% of its sales above 18250
(Wohland, Rigler and Vogel, 2001). Likewise, the median of 4750 as regards expenses reveals
that 50% of its expenses lie above and 50% of its expenses lie below the said amount. Quartiles
represent the range within which certain percentage of the value lie. For example, Quartile 1 of
17250 of sales highlights that 25% of the sales lies within the range of 0- 17250. Likewise,
quartile 2 of 18250 shows that 25% of the values lies between17250 – 18250. The same
interpretation can be used for the quartiles computed in respect of expenditure incurred for
services (Manikandan, 2011). And last but not the least, the trend line of both the sales and
expenses are showing an upward trend which can be used as abasis of making the sales and
expenses forecast for the upcoming years.
4.1 Information processing tools
Information processing tools refers to the computerized tools and techniques which
appreciates the decision making process of an organization. These tools are capable of
automatically processing the data captured from the basic business transactions and manipulate
8
⊘ This is a preview!⊘
Do you want full access?
Subscribe today to unlock all pages.
Trusted by 1+ million students worldwide
1 out of 19
Related Documents


Your All-in-One AI-Powered Toolkit for Academic Success.
+13062052269
info@desklib.com
Available 24*7 on WhatsApp / Email
![[object Object]](/_next/static/media/star-bottom.7253800d.svg)
Unlock your academic potential
Copyright © 2020–2026 A2Z Services. All Rights Reserved. Developed and managed by ZUCOL.