Business Decision Making Report: Data Analysis for Balti Palace Growth
VerifiedAdded on 2020/10/05
|22
|4169
|162
Report
AI Summary
This report focuses on business decision-making for Balti Palace, a UK-based restaurant. It begins by outlining data collection methods, including primary and secondary sources, and the design of questionnaires to gather customer feedback. The report then summarizes data using representative values and analyzes the results through measures of central tendency and dispersion. Furthermore, it explores the creation of graphs and trend lines for forecasting purposes and delves into the application of data methods, critical path analysis, and investment appraisal tools for effective decision-making. The report concludes with a comprehensive analysis of the findings and recommendations for Balti Palace's future business strategies.

Business Decision Making
Paraphrase This Document
Need a fresh take? Get an instant paraphrase of this document with our AI Paraphraser
Table of Contents
INTRODUCTION...........................................................................................................................1
TASK 1............................................................................................................................................1
1.1 Collection of primary and secondary data for a given business problem.............................1
1.3 Designing the questionnaire..................................................................................................3
TASK 2............................................................................................................................................4
2.1 Create information for decision making by summarising the data using representative
values...........................................................................................................................................4
2.2 Analysis of the results...........................................................................................................7
2.3 Analyse the data using measures of dispersion.....................................................................8
2.4 Explain how to find conclusion using Quartiles, percentile and correlation........................9
TASK 3............................................................................................................................................9
3.1 Produce graphs using spreadsheet and draw conclusion using information.........................9
3.2 Create trend lines and graphs to assist forecasting..............................................................15
3.3 Covered in PP T..................................................................................................................16
3.4 Formal report.......................................................................................................................16
TASK 4..........................................................................................................................................17
4.1 Using data methods in decision making: ...........................................................................17
4.2: Critical path .......................................................................................................................17
4.3 Investment appraisal tools...................................................................................................18
CONCLUSION..............................................................................................................................19
REFERENCES..............................................................................................................................20
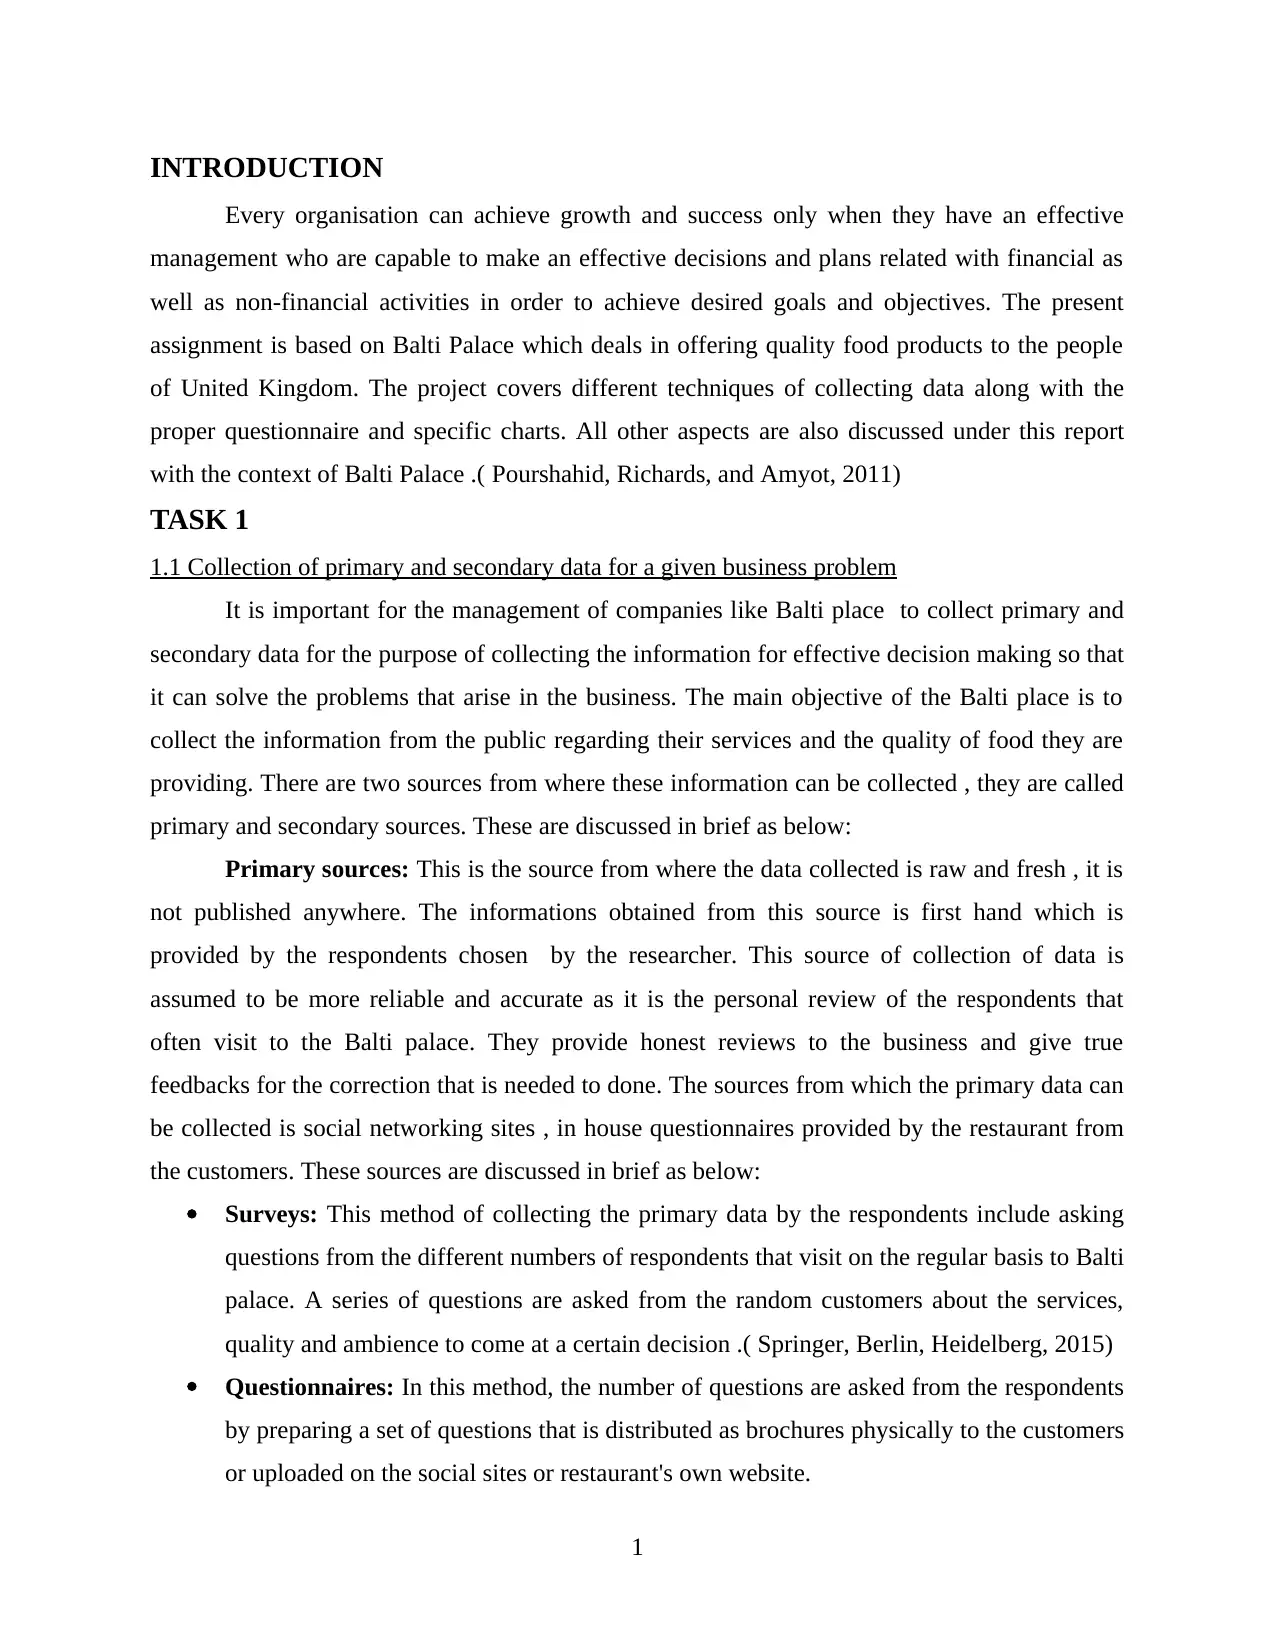
INTRODUCTION
Every organisation can achieve growth and success only when they have an effective
management who are capable to make an effective decisions and plans related with financial as
well as non-financial activities in order to achieve desired goals and objectives. The present
assignment is based on Balti Palace which deals in offering quality food products to the people
of United Kingdom. The project covers different techniques of collecting data along with the
proper questionnaire and specific charts. All other aspects are also discussed under this report
with the context of Balti Palace .( Pourshahid, Richards, and Amyot, 2011)
TASK 1
1.1 Collection of primary and secondary data for a given business problem
It is important for the management of companies like Balti place to collect primary and
secondary data for the purpose of collecting the information for effective decision making so that
it can solve the problems that arise in the business. The main objective of the Balti place is to
collect the information from the public regarding their services and the quality of food they are
providing. There are two sources from where these information can be collected , they are called
primary and secondary sources. These are discussed in brief as below:
Primary sources: This is the source from where the data collected is raw and fresh , it is
not published anywhere. The informations obtained from this source is first hand which is
provided by the respondents chosen by the researcher. This source of collection of data is
assumed to be more reliable and accurate as it is the personal review of the respondents that
often visit to the Balti palace. They provide honest reviews to the business and give true
feedbacks for the correction that is needed to done. The sources from which the primary data can
be collected is social networking sites , in house questionnaires provided by the restaurant from
the customers. These sources are discussed in brief as below:
Surveys: This method of collecting the primary data by the respondents include asking
questions from the different numbers of respondents that visit on the regular basis to Balti
palace. A series of questions are asked from the random customers about the services,
quality and ambience to come at a certain decision .( Springer, Berlin, Heidelberg, 2015)
Questionnaires: In this method, the number of questions are asked from the respondents
by preparing a set of questions that is distributed as brochures physically to the customers
or uploaded on the social sites or restaurant's own website.
1
⊘ This is a preview!⊘
Do you want full access?
Subscribe today to unlock all pages.
Trusted by 1+ million students worldwide
Secondary sources: In this method of collecting the information , published data are used such
as industry related magazines , newspapers, articles , food bloggers etc. This source also collects
past information , which can also be called second hand information and doesn't play as much
relevance as primary sources.
1.2 Presenting survey methodology and sample framing
The main purpose of conducting the surveys is for assembling the data that is necessary
for gathering the information that will be required for solving the problems of the business and
making necessary decisions. This purpose can be solved by conducting the research using the
information collected from primary and secondary sources. These sources help the researcher in
conducting the research coming to a decision that is necessary for solving the problems of the
restaurant, and receiving feedbacks from respondents whether the decision made is effective or
not for satisfying the criteria demanded by them. ( Crowfoot, and Wondolleck, 2012 )
Survey methodologies: This is the methodology of conducting the survey that is adopted
by the Balti palace to assemble the views of random respondents that are selected by the
researcher for determining the quality of services , quality of food , surroundings etc. provided
by them. These surveys are conducted by the management Balti palace using primary source of
data collection. This source of collecting data uses questionnaires and fresh data is collected
from this source. The questionnaires prepared by the management includes question that are
related to the issues that the restaurant is facing currently and then these questionnaires are
issued publicly or on social sites.
Sample Framing: This research process uses sample data from the whole population on
the random basis. In the sample framing, researcher uses a variety of techniques such as random
sampling, stratified sampling, cluster sampling etc. to initiate the research process. The
researcher uses these techniques of sample making because it is impossible to conduct the
research on the whole population.
Here, the research analyst of Balti palace is using the technique of random sampling to
select the sample from the entire population because it is the easiest and most effective method
of selecting the sample from the population. The total of 90 respondents are selected from the
population by using random sampling method. The different issues for which the various
questions are asked from the selected sample of 90 respondents are as follows:
2
Paraphrase This Document
Need a fresh take? Get an instant paraphrase of this document with our AI Paraphraser
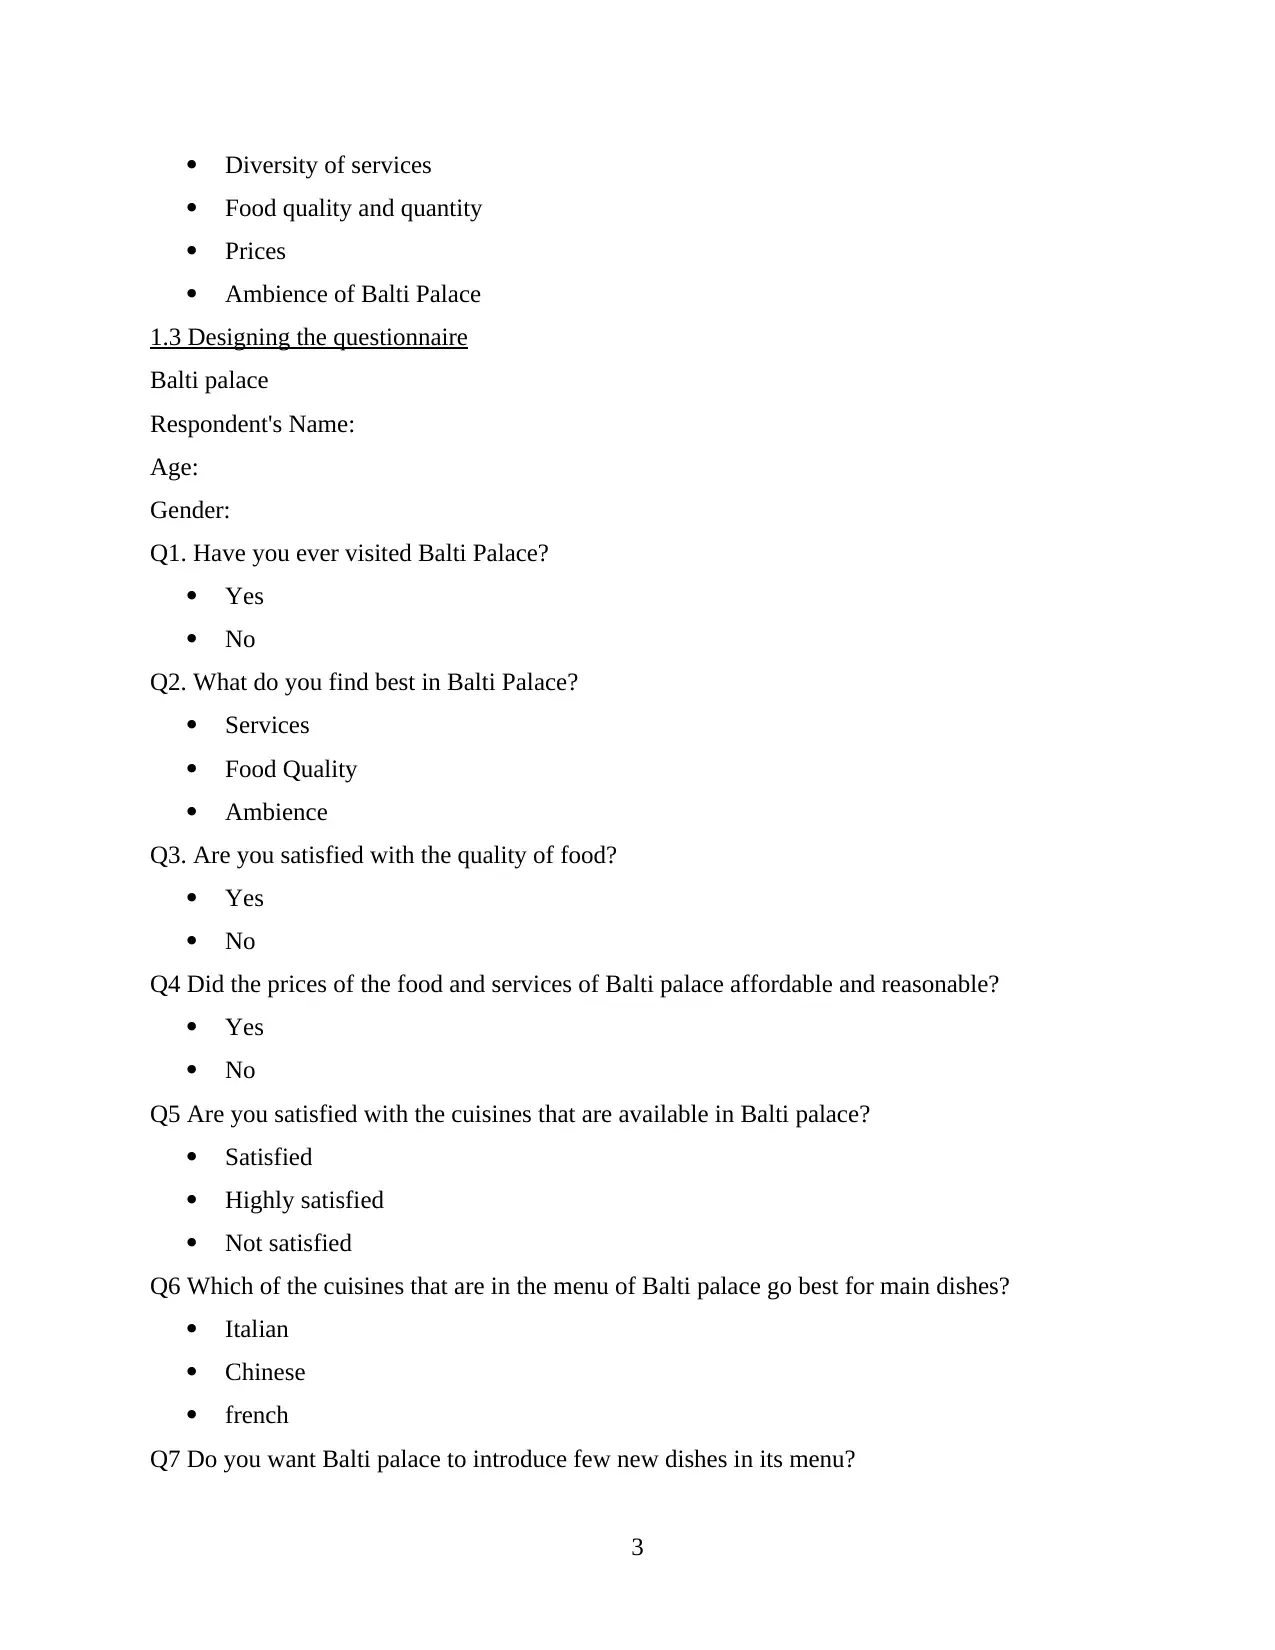
Diversity of services
Food quality and quantity
Prices
Ambience of Balti Palace
1.3 Designing the questionnaire
Balti palace
Respondent's Name:
Age:
Gender:
Q1. Have you ever visited Balti Palace?
Yes
No
Q2. What do you find best in Balti Palace?
Services
Food Quality
Ambience
Q3. Are you satisfied with the quality of food?
Yes
No
Q4 Did the prices of the food and services of Balti palace affordable and reasonable?
Yes
No
Q5 Are you satisfied with the cuisines that are available in Balti palace?
Satisfied
Highly satisfied
Not satisfied
Q6 Which of the cuisines that are in the menu of Balti palace go best for main dishes?
Italian
Chinese
french
Q7 Do you want Balti palace to introduce few new dishes in its menu?
3
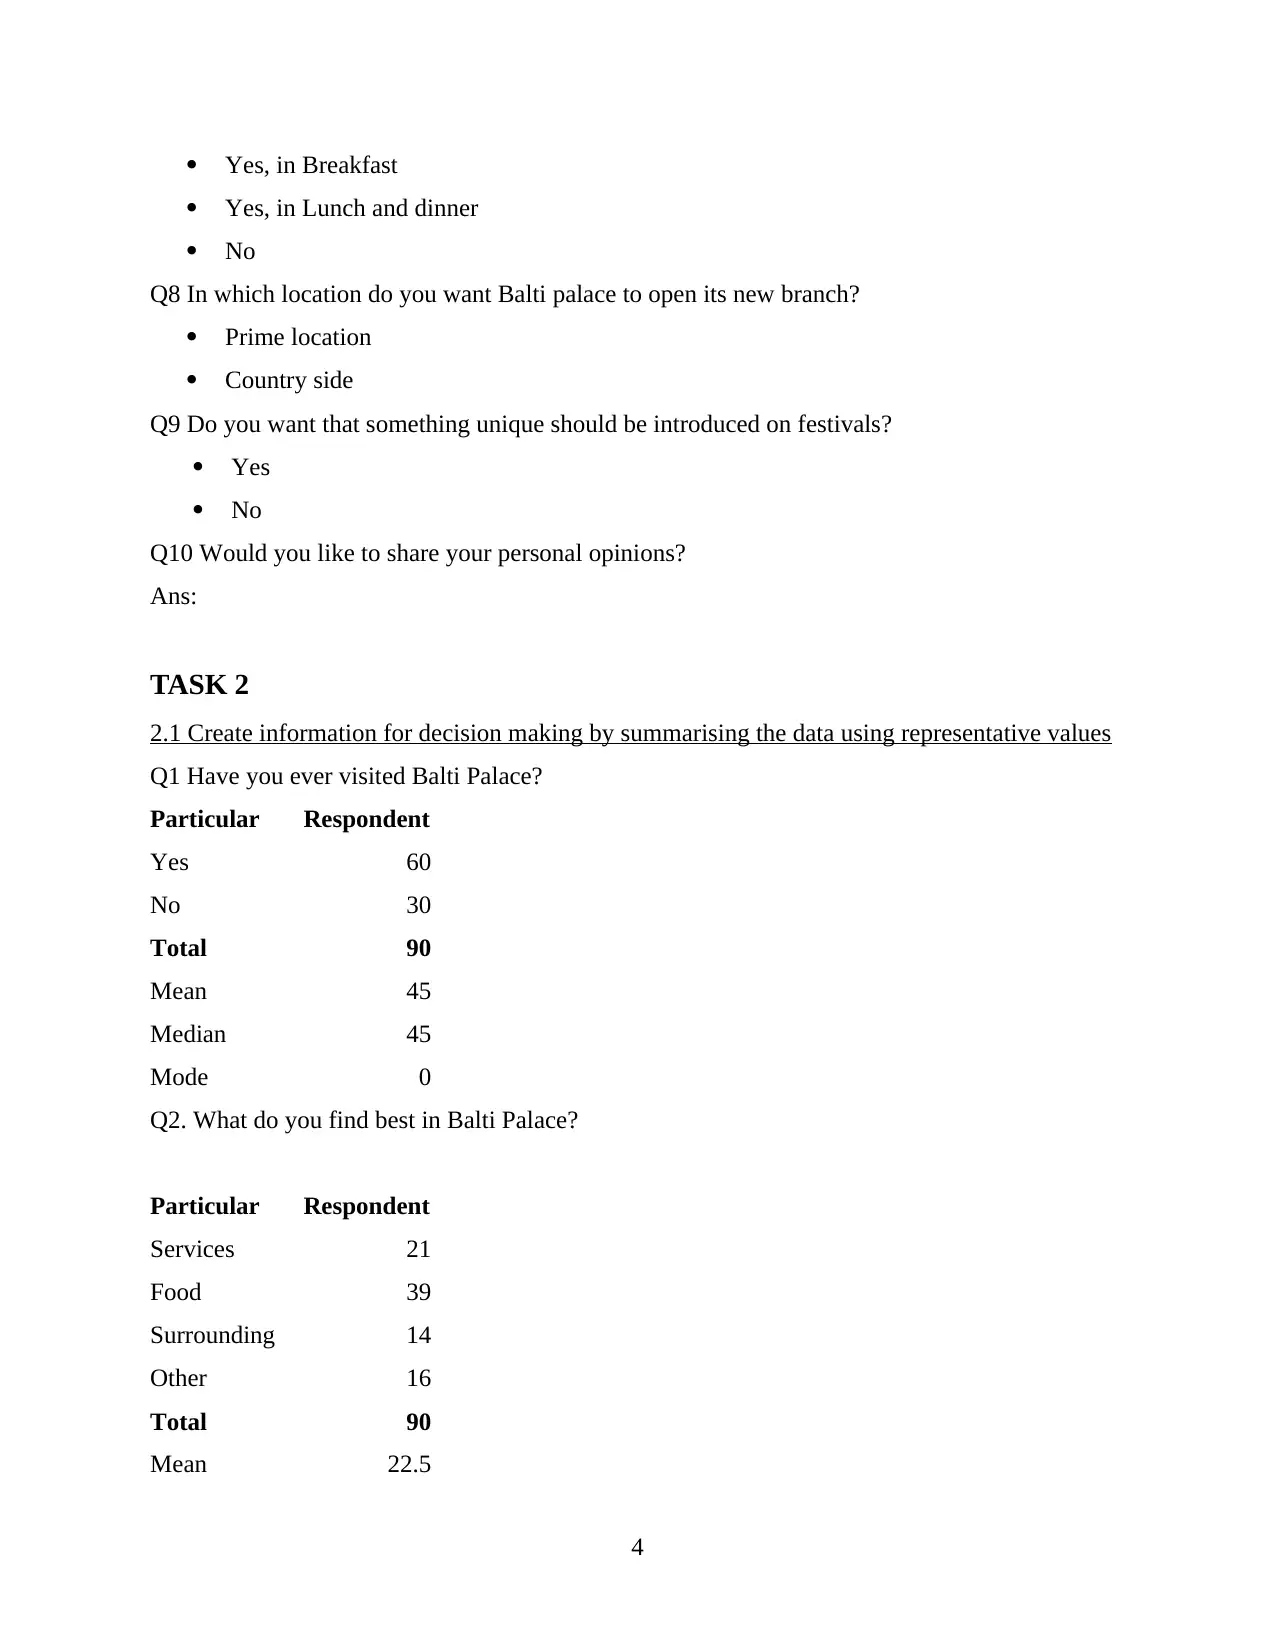
Yes, in Breakfast
Yes, in Lunch and dinner
No
Q8 In which location do you want Balti palace to open its new branch?
Prime location
Country side
Q9 Do you want that something unique should be introduced on festivals?
Yes
No
Q10 Would you like to share your personal opinions?
Ans:
TASK 2
2.1 Create information for decision making by summarising the data using representative values
Q1 Have you ever visited Balti Palace?
Particular Respondent
Yes 60
No 30
Total 90
Mean 45
Median 45
Mode 0
Q2. What do you find best in Balti Palace?
Particular Respondent
Services 21
Food 39
Surrounding 14
Other 16
Total 90
Mean 22.5
4
⊘ This is a preview!⊘
Do you want full access?
Subscribe today to unlock all pages.
Trusted by 1+ million students worldwide
Median 18.5
Mode 5
Q3. Are you satisfied with the quality of food?
Particular Respondent
Yes 55
No 35
Total 90
Mean 45
Median 45
Mode 20
Q4 Did the prices of the food and services of Balti palace affordable and reasonable?
Particular Respondent
Yes 65
No 25
Total 90
Mean 45
Median 45
Mode 15
Q5 Are you satisfied with the cuisines that are available in Balti palace?
Particular Respondent
Satisfy 51
Highly satisfy 16
Dissatisfied 23
Total 90
Mean 30
5
Paraphrase This Document
Need a fresh take? Get an instant paraphrase of this document with our AI Paraphraser
Median 23
Mode 5
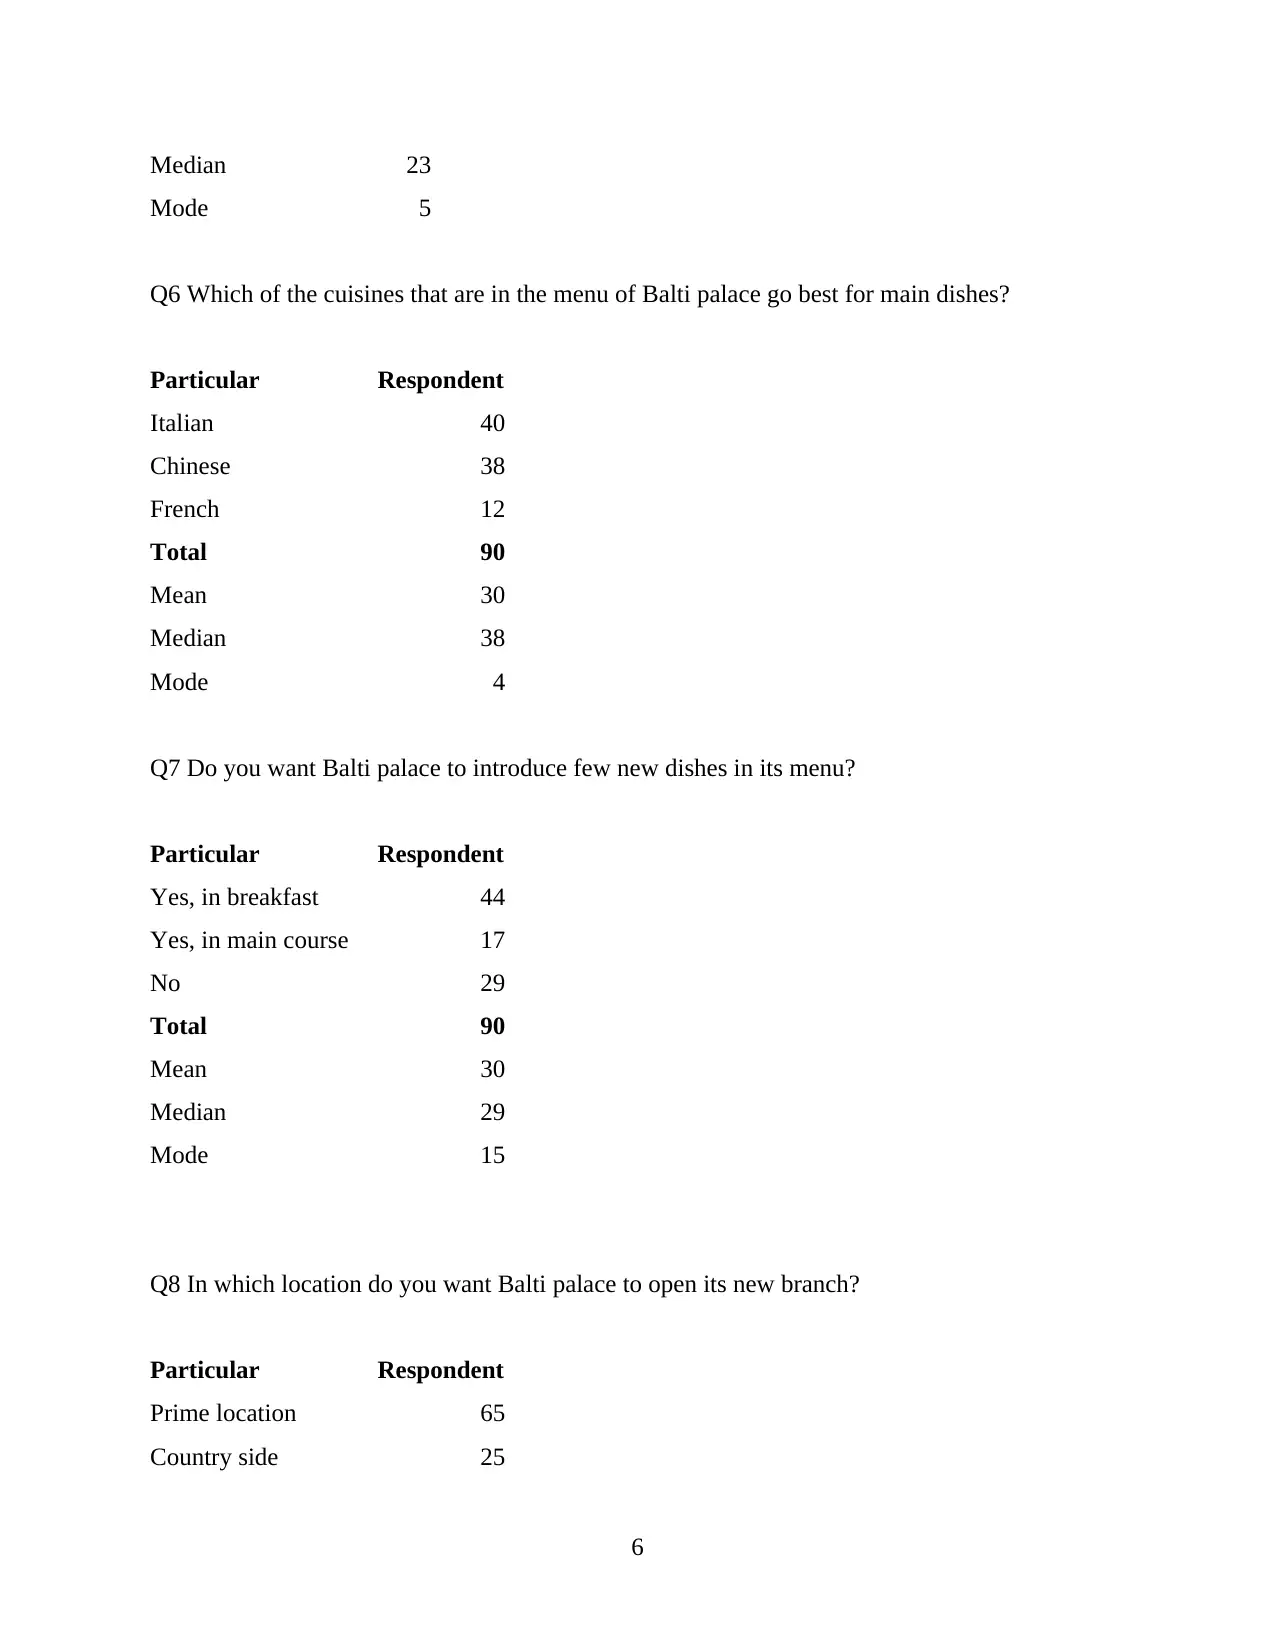
Q6 Which of the cuisines that are in the menu of Balti palace go best for main dishes?
Particular Respondent
Italian 40
Chinese 38
French 12
Total 90
Mean 30
Median 38
Mode 4
Q7 Do you want Balti palace to introduce few new dishes in its menu?
Particular Respondent
Yes, in breakfast 44
Yes, in main course 17
No 29
Total 90
Mean 30
Median 29
Mode 15
Q8 In which location do you want Balti palace to open its new branch?
Particular Respondent
Prime location 65
Country side 25
6
Mode 5
Q6 Which of the cuisines that are in the menu of Balti palace go best for main dishes?
Particular Respondent
Italian 40
Chinese 38
French 12
Total 90
Mean 30
Median 38
Mode 4
Q7 Do you want Balti palace to introduce few new dishes in its menu?
Particular Respondent
Yes, in breakfast 44
Yes, in main course 17
No 29
Total 90
Mean 30
Median 29
Mode 15
Q8 In which location do you want Balti palace to open its new branch?
Particular Respondent
Prime location 65
Country side 25
6
Total 90
Mean 45
Median 45
Mode 15
Q9 Do you want that something unique should be introduced on festivals?
Particular Respondent
Agree 75
Disagree 15
Total 90
Mean 45
Median 45
Mode 0
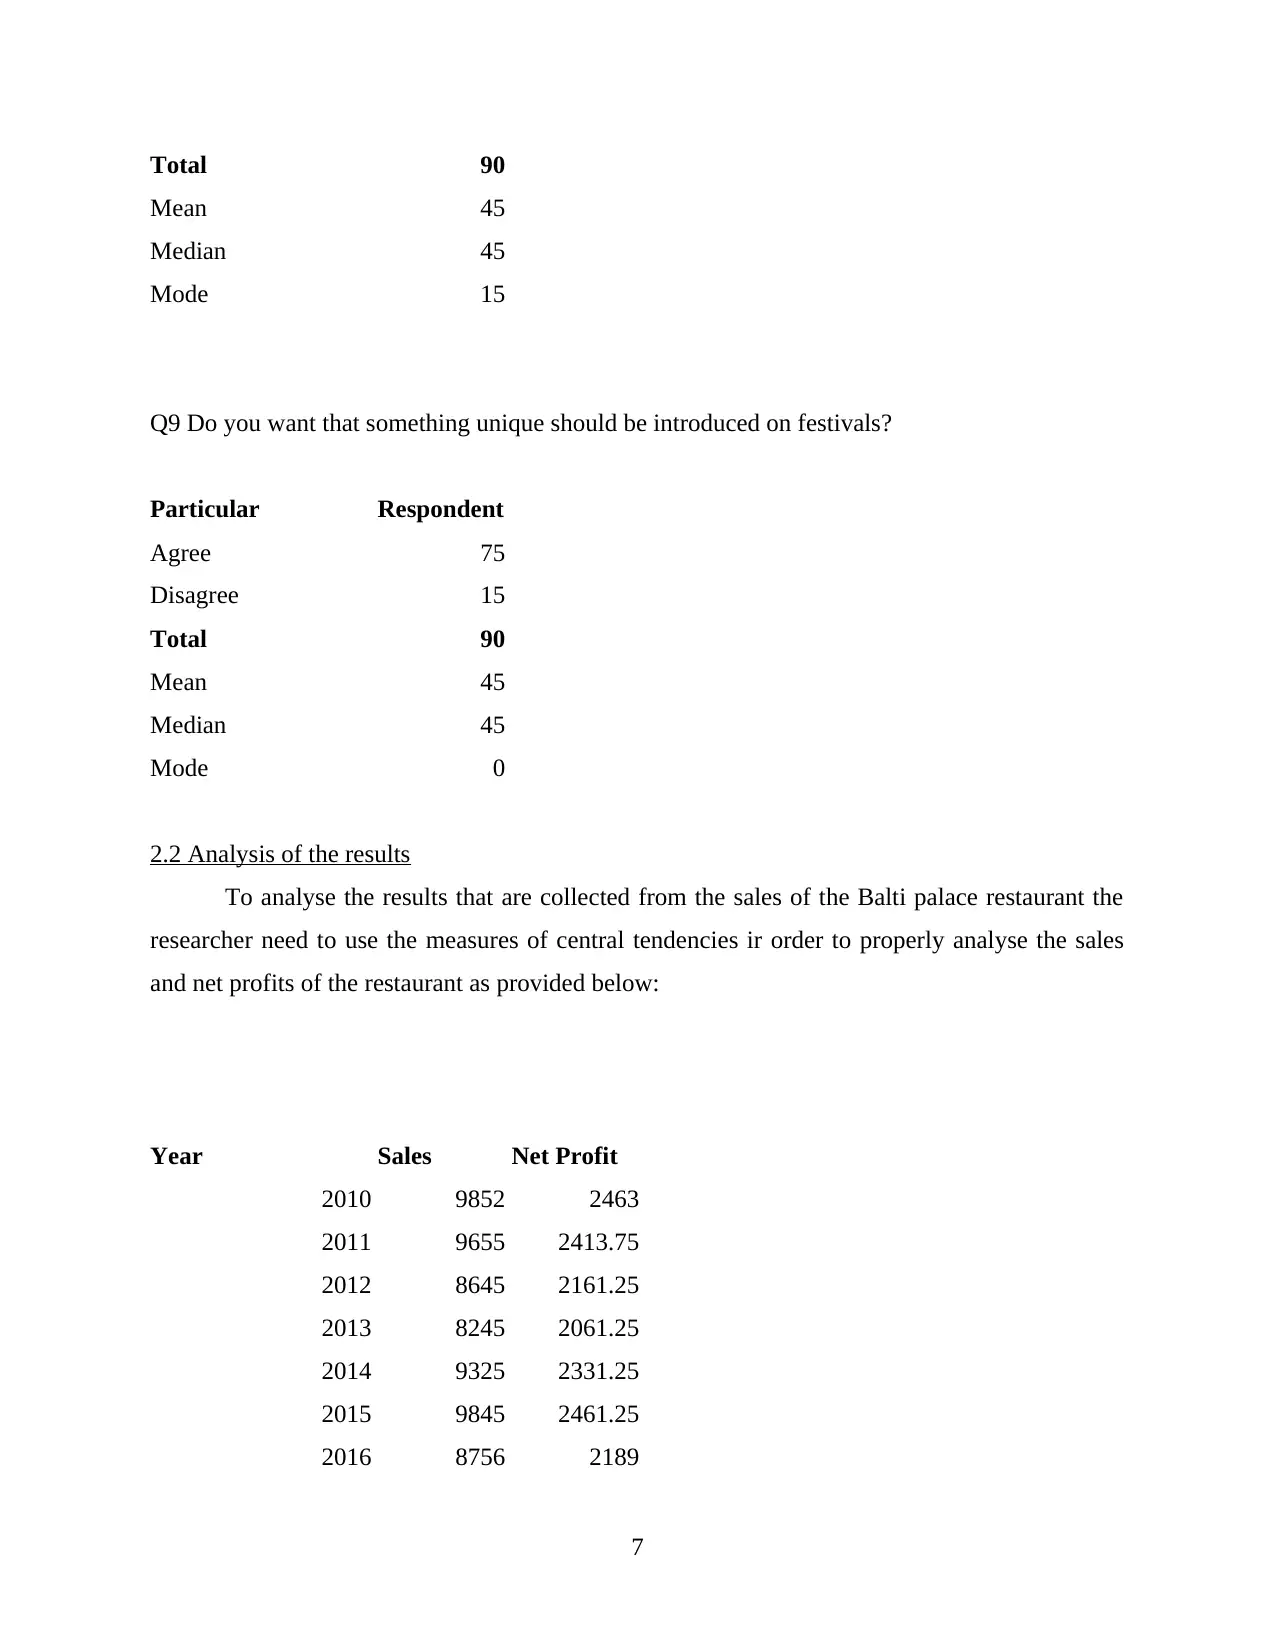
2.2 Analysis of the results
To analyse the results that are collected from the sales of the Balti palace restaurant the
researcher need to use the measures of central tendencies ir order to properly analyse the sales
and net profits of the restaurant as provided below:
Year Sales Net Profit
2010 9852 2463
2011 9655 2413.75
2012 8645 2161.25
2013 8245 2061.25
2014 9325 2331.25
2015 9845 2461.25
2016 8756 2189
7
Mean 45
Median 45
Mode 15
Q9 Do you want that something unique should be introduced on festivals?
Particular Respondent
Agree 75
Disagree 15
Total 90
Mean 45
Median 45
Mode 0
2.2 Analysis of the results
To analyse the results that are collected from the sales of the Balti palace restaurant the
researcher need to use the measures of central tendencies ir order to properly analyse the sales
and net profits of the restaurant as provided below:
Year Sales Net Profit
2010 9852 2463
2011 9655 2413.75
2012 8645 2161.25
2013 8245 2061.25
2014 9325 2331.25
2015 9845 2461.25
2016 8756 2189
7
⊘ This is a preview!⊘
Do you want full access?
Subscribe today to unlock all pages.
Trusted by 1+ million students worldwide
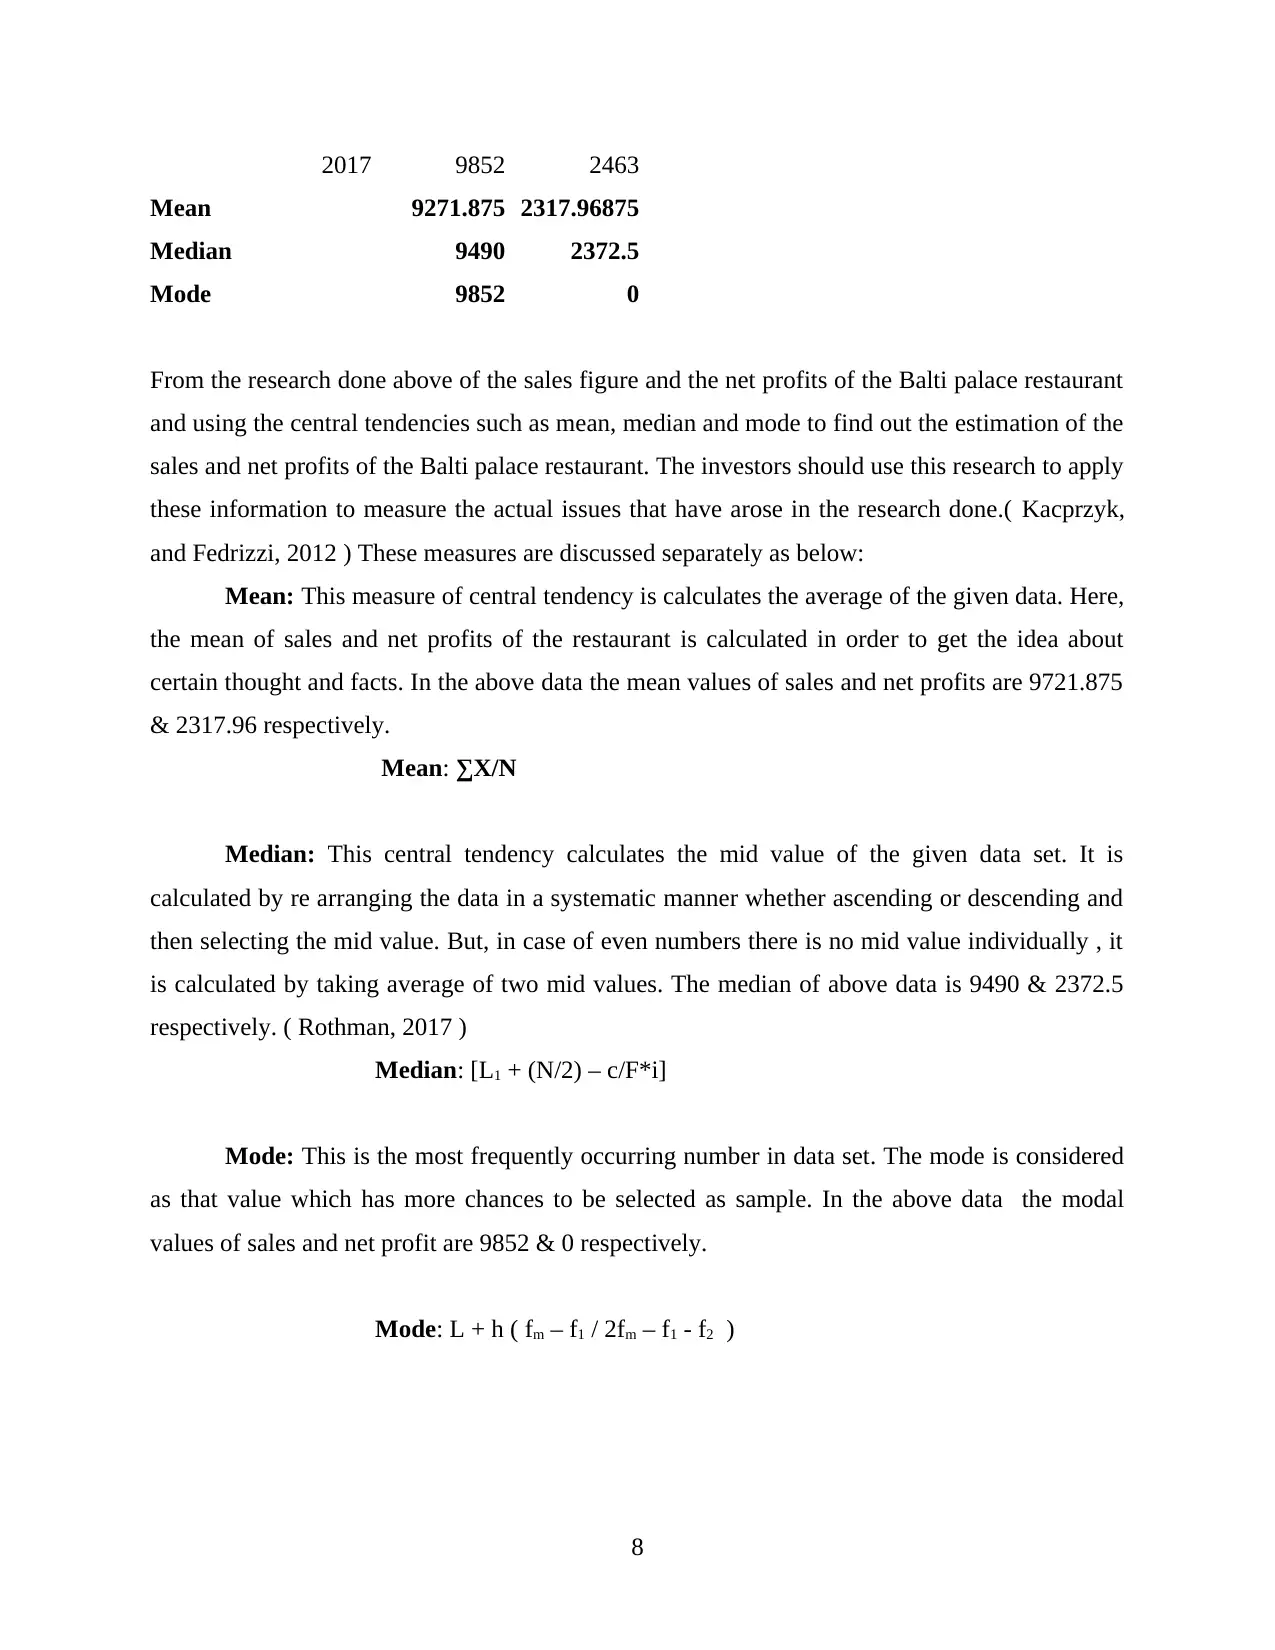
2017 9852 2463
Mean 9271.875 2317.96875
Median 9490 2372.5
Mode 9852 0
From the research done above of the sales figure and the net profits of the Balti palace restaurant
and using the central tendencies such as mean, median and mode to find out the estimation of the
sales and net profits of the Balti palace restaurant. The investors should use this research to apply
these information to measure the actual issues that have arose in the research done.( Kacprzyk,
and Fedrizzi, 2012 ) These measures are discussed separately as below:
Mean: This measure of central tendency is calculates the average of the given data. Here,
the mean of sales and net profits of the restaurant is calculated in order to get the idea about
certain thought and facts. In the above data the mean values of sales and net profits are 9721.875
& 2317.96 respectively.
Mean: ∑X/N
Median: This central tendency calculates the mid value of the given data set. It is
calculated by re arranging the data in a systematic manner whether ascending or descending and
then selecting the mid value. But, in case of even numbers there is no mid value individually , it
is calculated by taking average of two mid values. The median of above data is 9490 & 2372.5
respectively. ( Rothman, 2017 )
Median: [L1 + (N/2) – c/F*i]
Mode: This is the most frequently occurring number in data set. The mode is considered
as that value which has more chances to be selected as sample. In the above data the modal
values of sales and net profit are 9852 & 0 respectively.
Mode: L + h ( fm – f1 / 2fm – f1 - f2 )
8
Paraphrase This Document
Need a fresh take? Get an instant paraphrase of this document with our AI Paraphraser
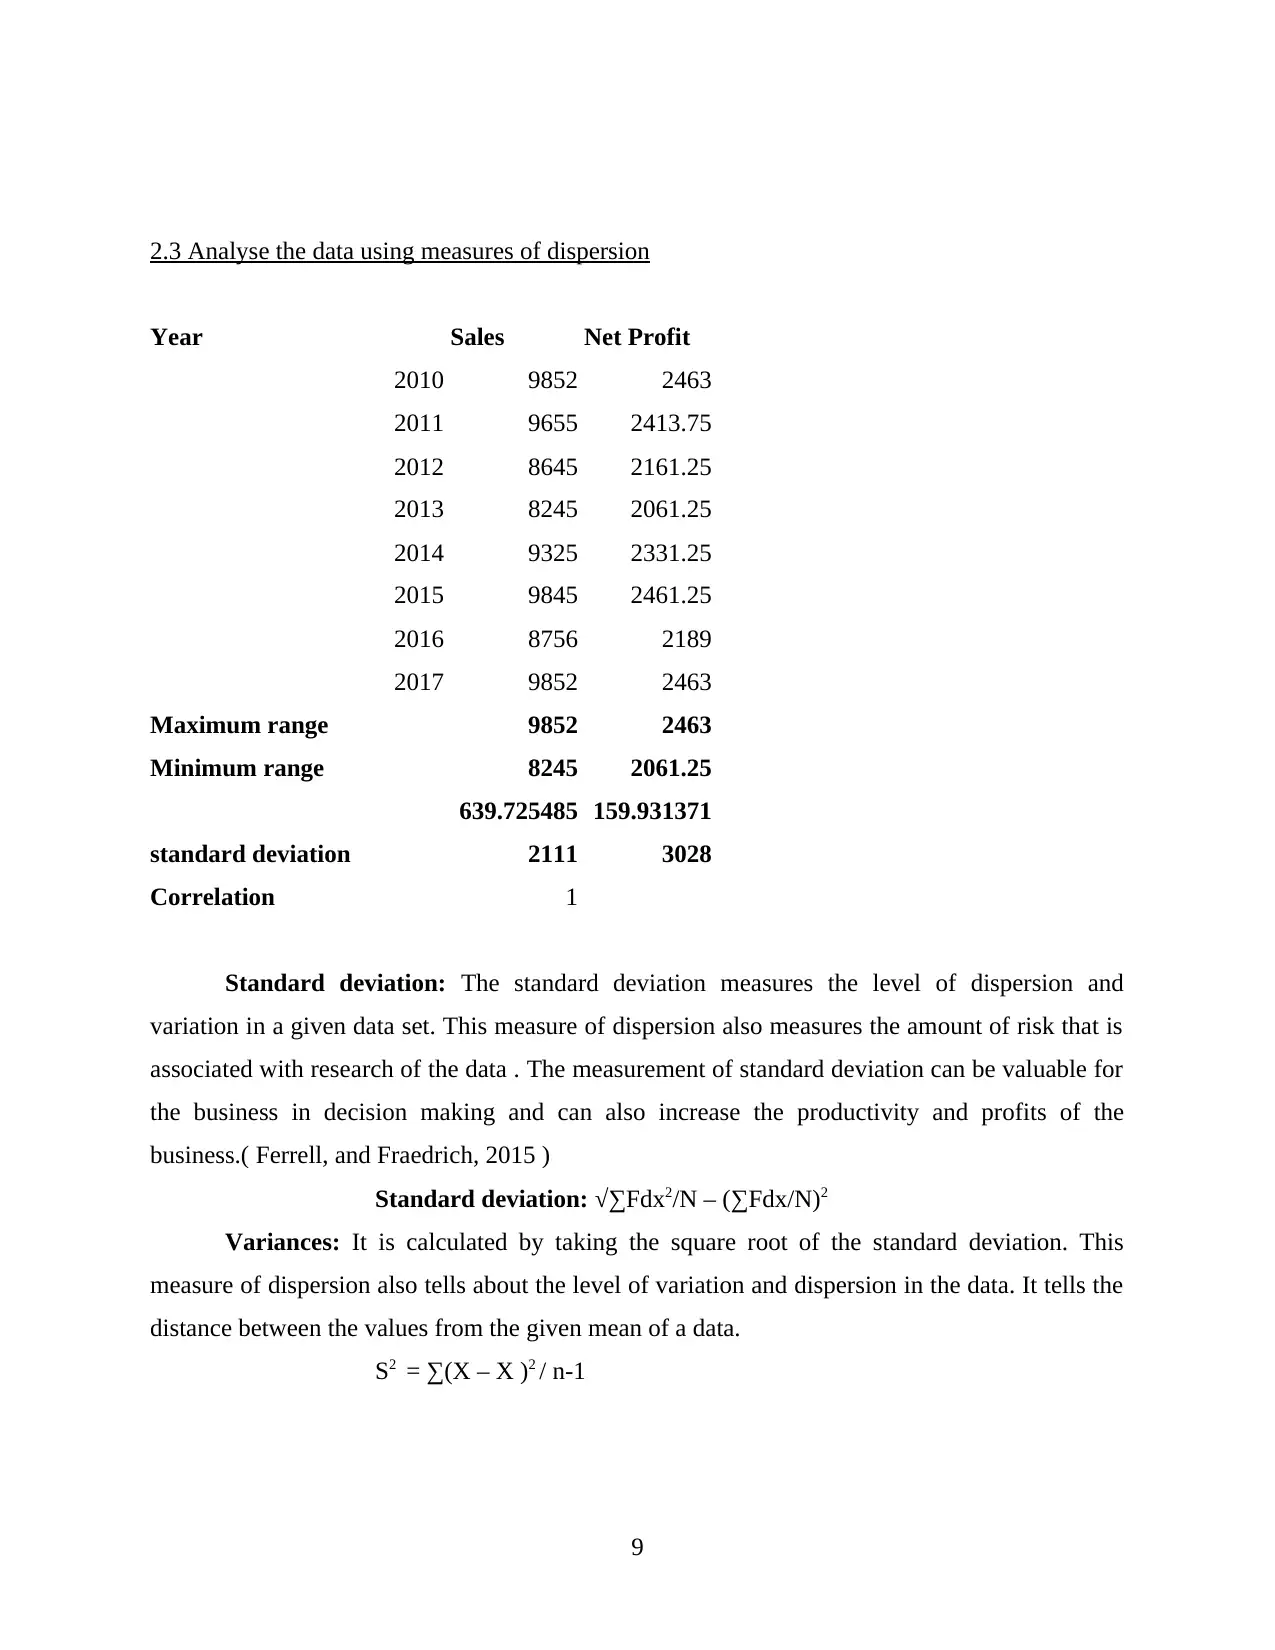
2.3 Analyse the data using measures of dispersion
Year Sales Net Profit
2010 9852 2463
2011 9655 2413.75
2012 8645 2161.25
2013 8245 2061.25
2014 9325 2331.25
2015 9845 2461.25
2016 8756 2189
2017 9852 2463
Maximum range 9852 2463
Minimum range 8245 2061.25
standard deviation
639.725485
2111
159.931371
3028
Correlation 1
Standard deviation: The standard deviation measures the level of dispersion and
variation in a given data set. This measure of dispersion also measures the amount of risk that is
associated with research of the data . The measurement of standard deviation can be valuable for
the business in decision making and can also increase the productivity and profits of the
business.( Ferrell, and Fraedrich, 2015 )
Standard deviation: √∑Fdx2/N – (∑Fdx/N)2
Variances: It is calculated by taking the square root of the standard deviation. This
measure of dispersion also tells about the level of variation and dispersion in the data. It tells the
distance between the values from the given mean of a data.
S2 = ∑(X – X )2 / n-1
9
2.4 Explain how to find conclusion using Quartiles, percentile and correlation
Quartiles: Business entities have to work in different segments within a organisation, so
it is needed to divide the companies into various segments. The quartiles are of three types
namely upper quartile , inter quartile and lower quartile as used by the businesses. The upper
quartile covers the 75% of the organisation and inter quartile covers 50% of the organisation.
Similarly the lower quartile covers the 25% of organisation. The business decisions which are
approved are those that come between the upper quartile and lower quartile. The projects which
do not come between the upper and lower quartile or the projects that are below lower quartile
are disapproved by the management of the business. This method helps in enhancing the decision
making regarding which projects will be beneficial for the company in the long run and therefore
increases the overall profitability and goodwill of the company.( Schmoldt, and et. al., 2013 )
Percentiles: This measure is used in converting the data in the percentage form. For the
purpose of converting data it is required to take a common base. This decision can be effective
only when maximum limit of percentages is in range of 100%. This method helps in easy
comparison of data and improvise the decision-making enables the management to take effective
decisions in the management of Balti palace.
Correlation coefficient: This measure is used for identifying the relationship between
the two set of variables. The use of this measure enables the management in taking decisions
regarding the Balti palace restaurant. The correlation coefficient has an effective limit between
the 1 and -1. Whenever the relationship between the variables come between these limits then the
project is considered as acceptable.
TASK 3
3.1 Produce graphs using spreadsheet and draw conclusion using information
Q1 Have you ever visited Balti Palace?
10
⊘ This is a preview!⊘
Do you want full access?
Subscribe today to unlock all pages.
Trusted by 1+ million students worldwide
1 out of 22
Related Documents


Your All-in-One AI-Powered Toolkit for Academic Success.
+13062052269
info@desklib.com
Available 24*7 on WhatsApp / Email
![[object Object]](/_next/static/media/star-bottom.7253800d.svg)
Unlock your academic potential
Copyright © 2020–2026 A2Z Services. All Rights Reserved. Developed and managed by ZUCOL.