Business Decision Making Report: Analysis of Consumer Preferences

Verified

Added on  2023/02/03

|9
|458
|62
Report
AI Summary
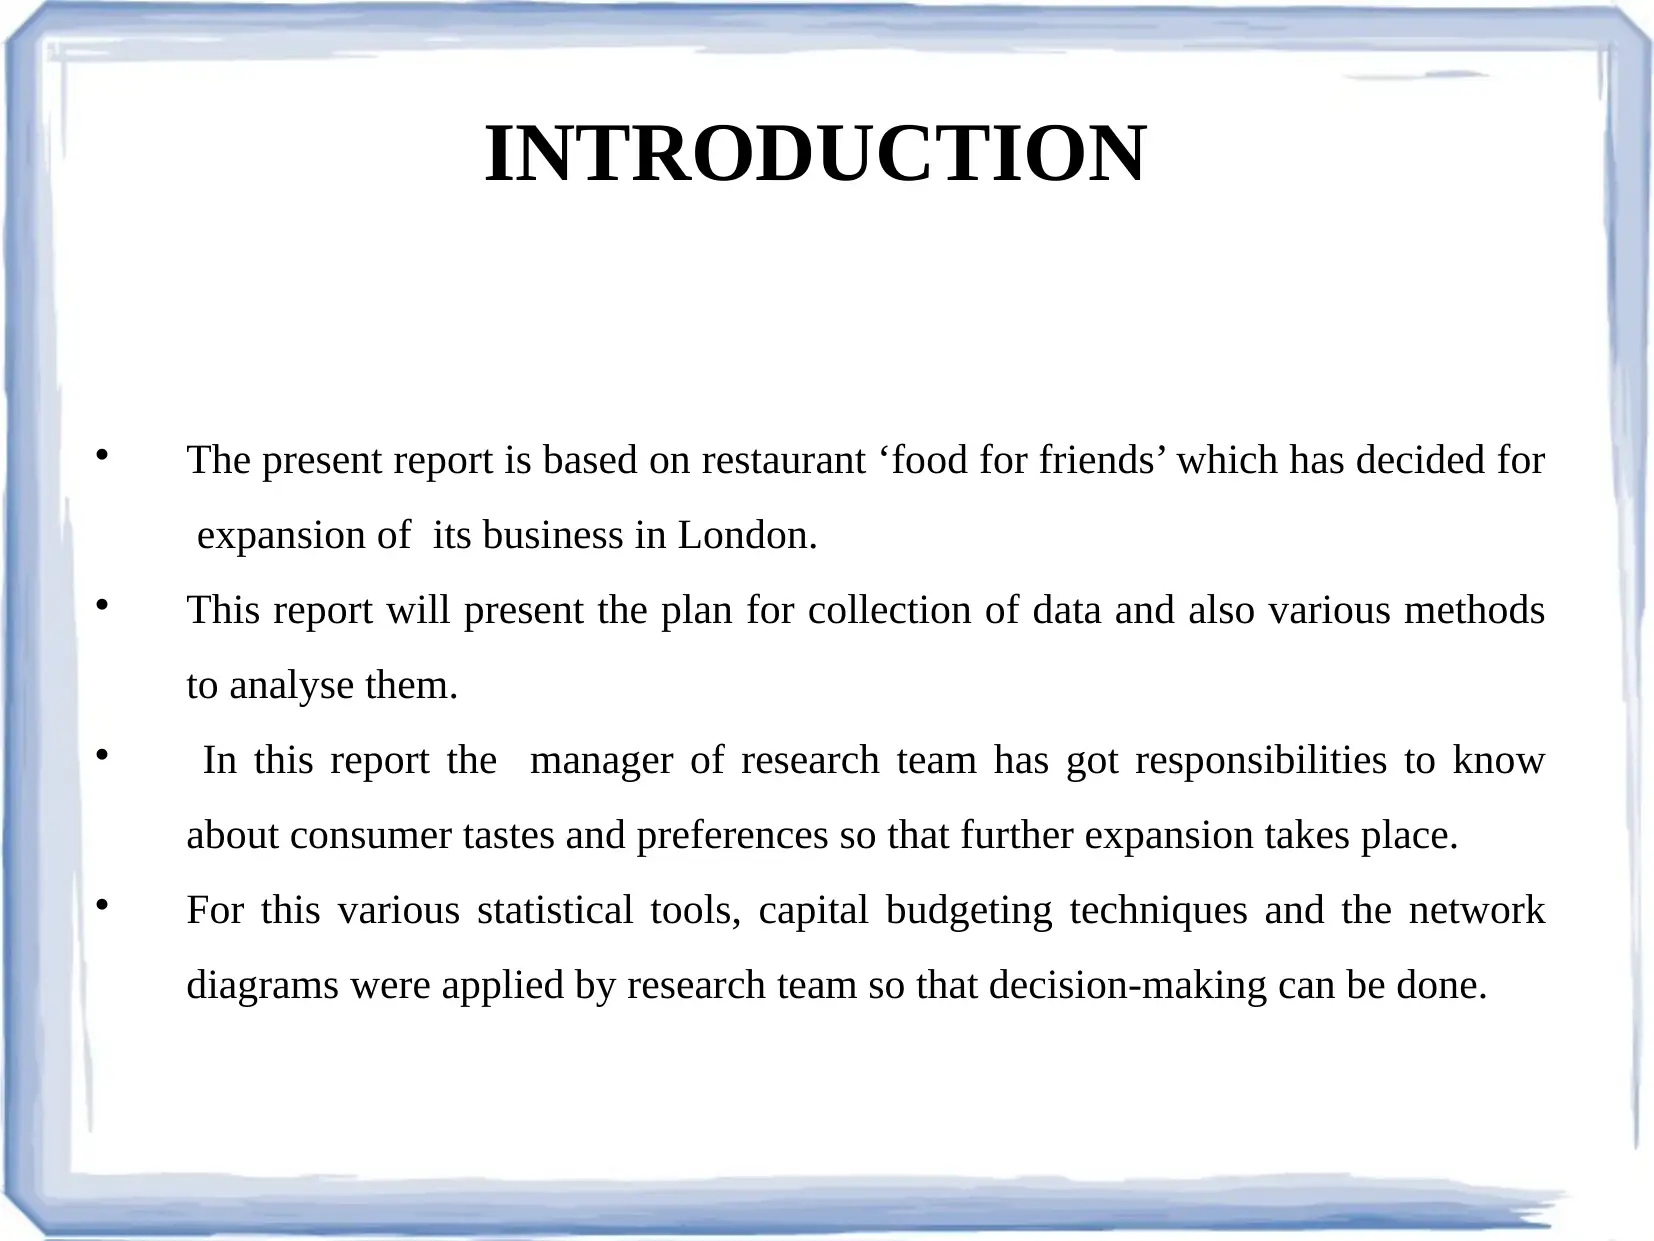
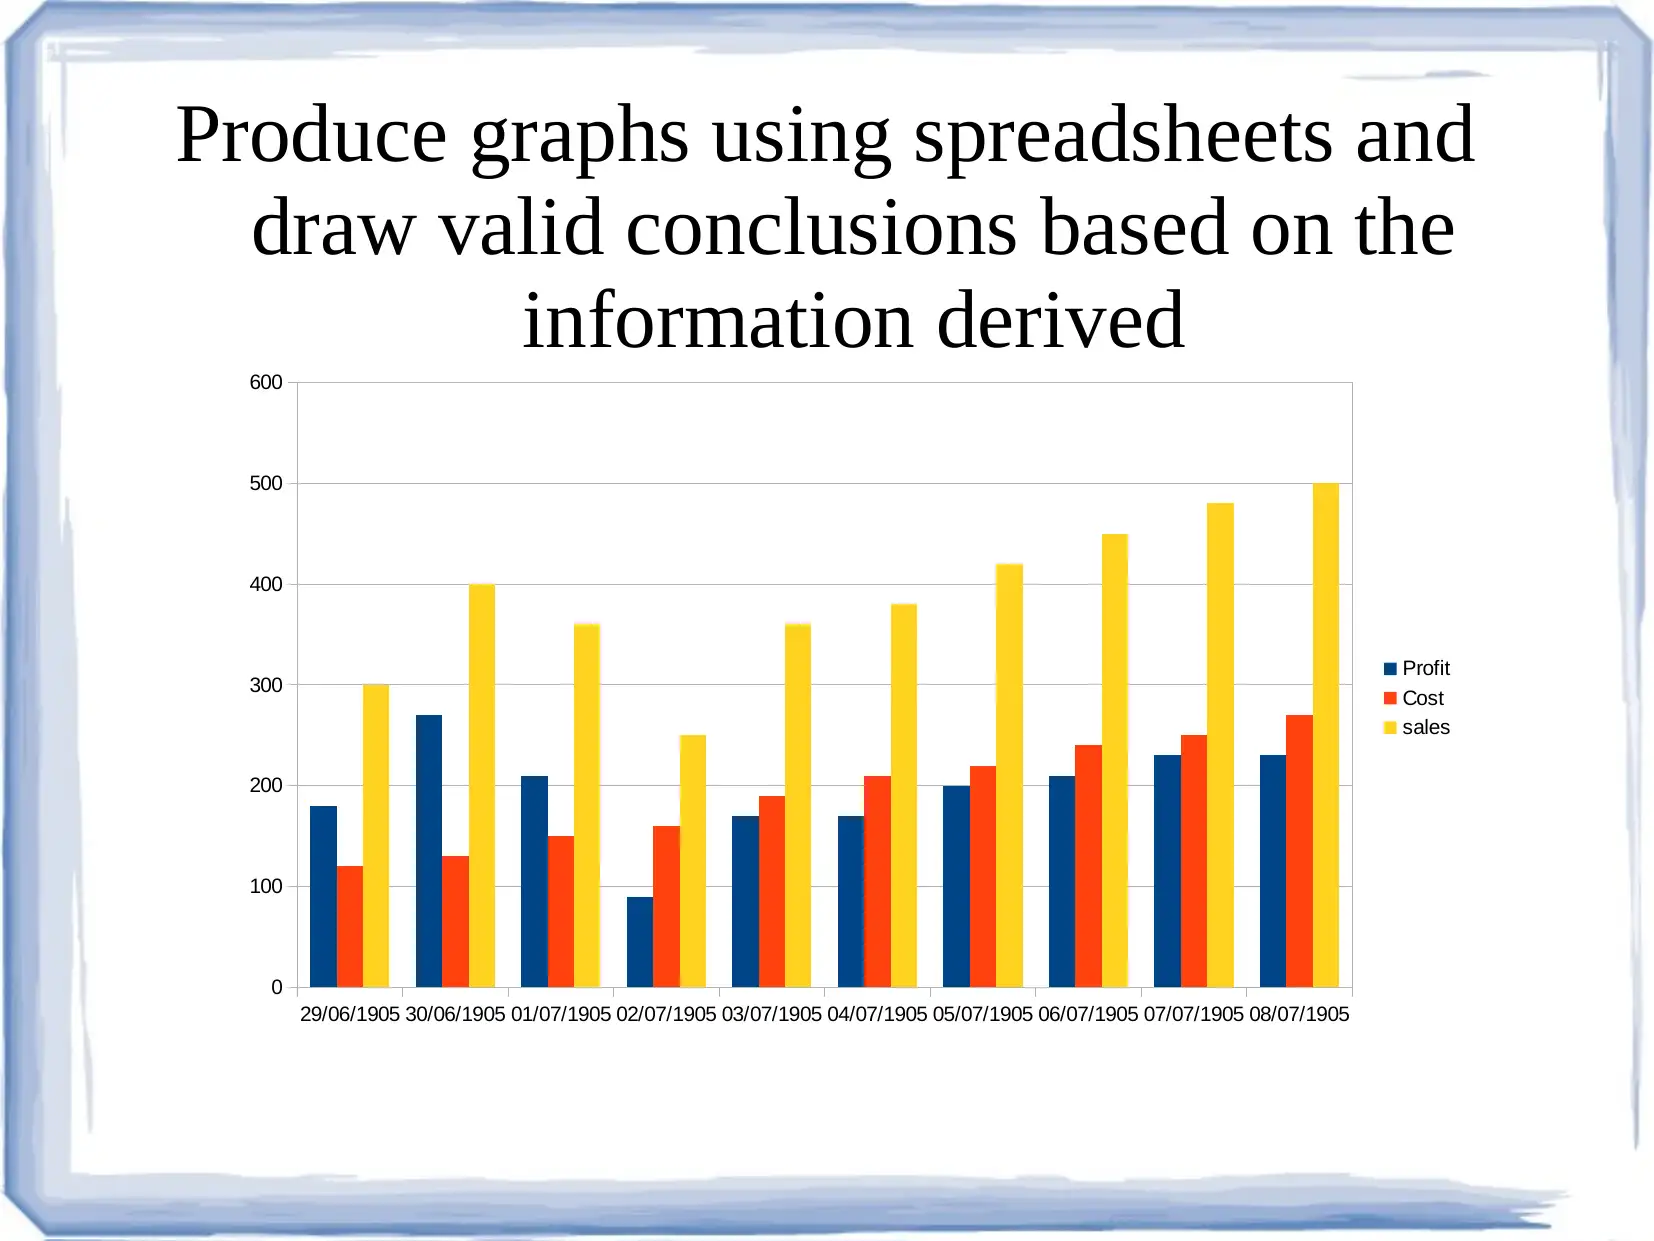
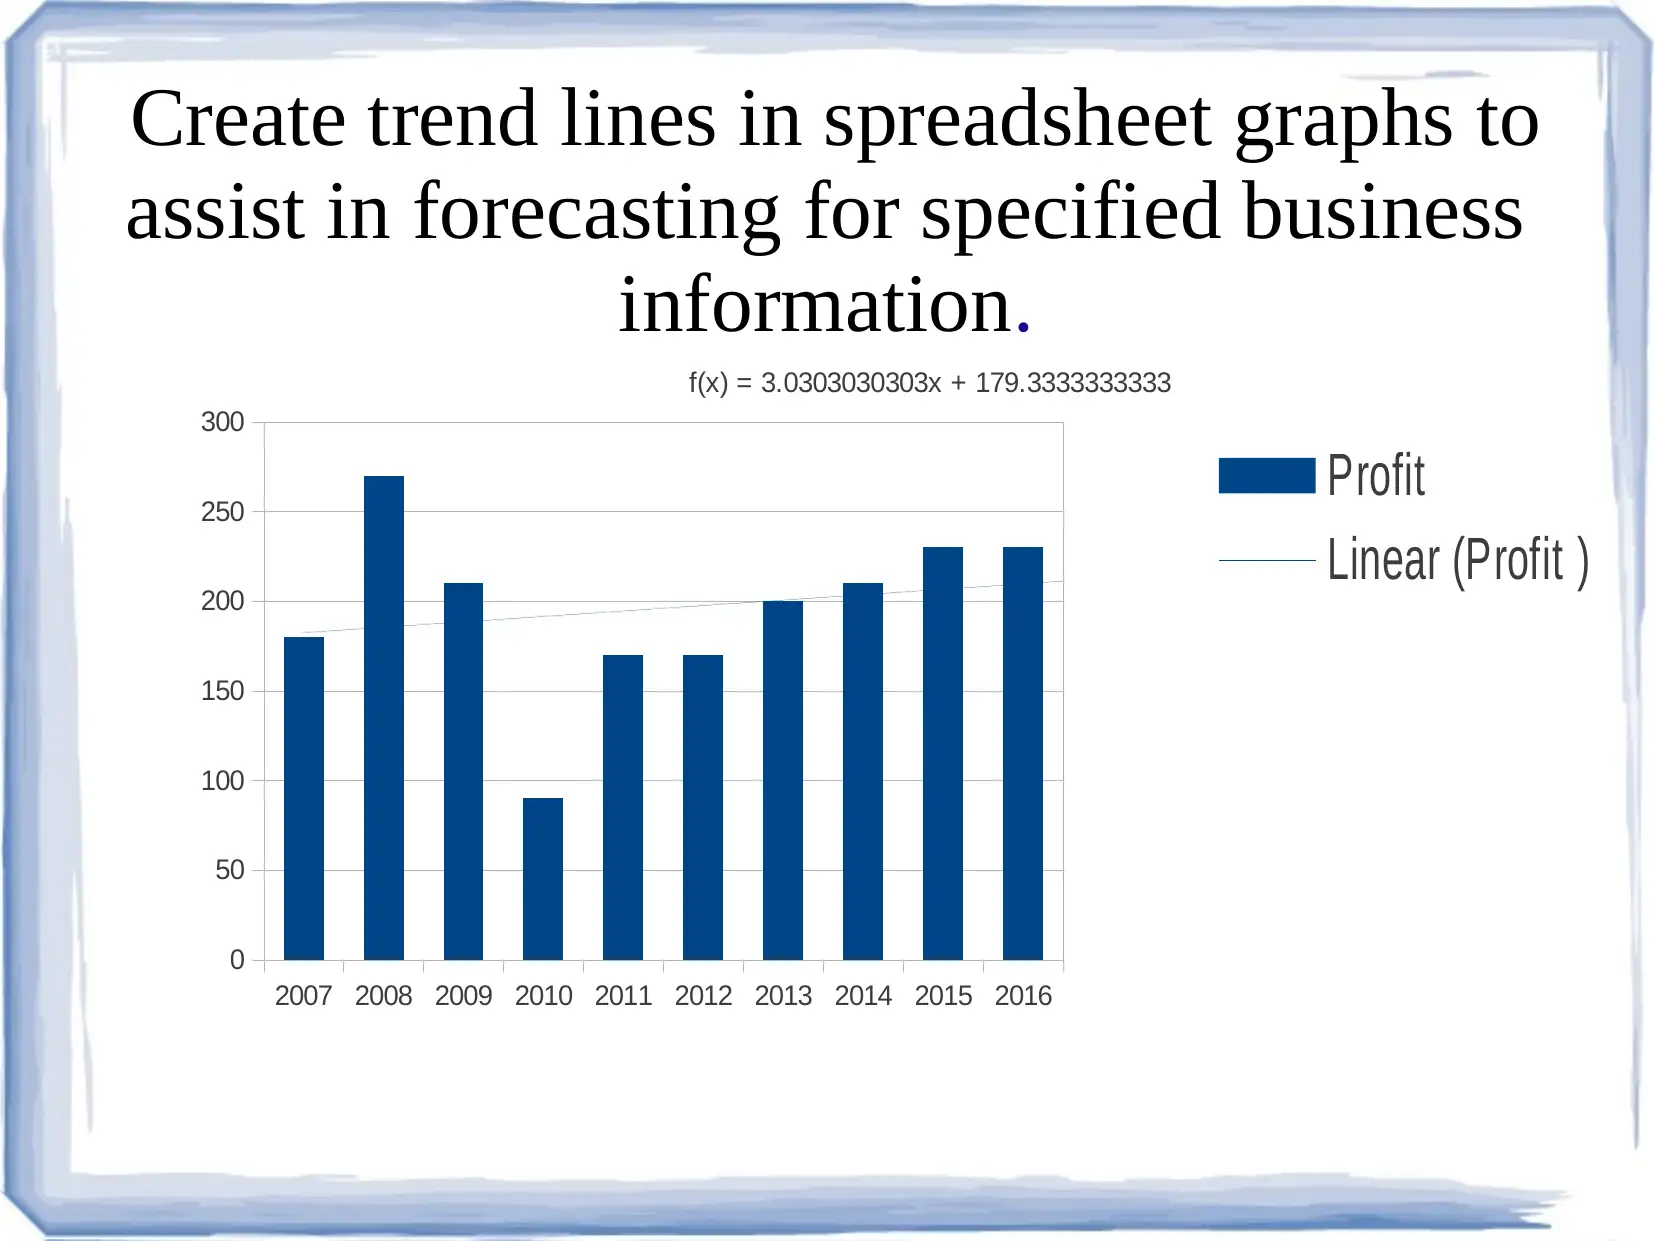
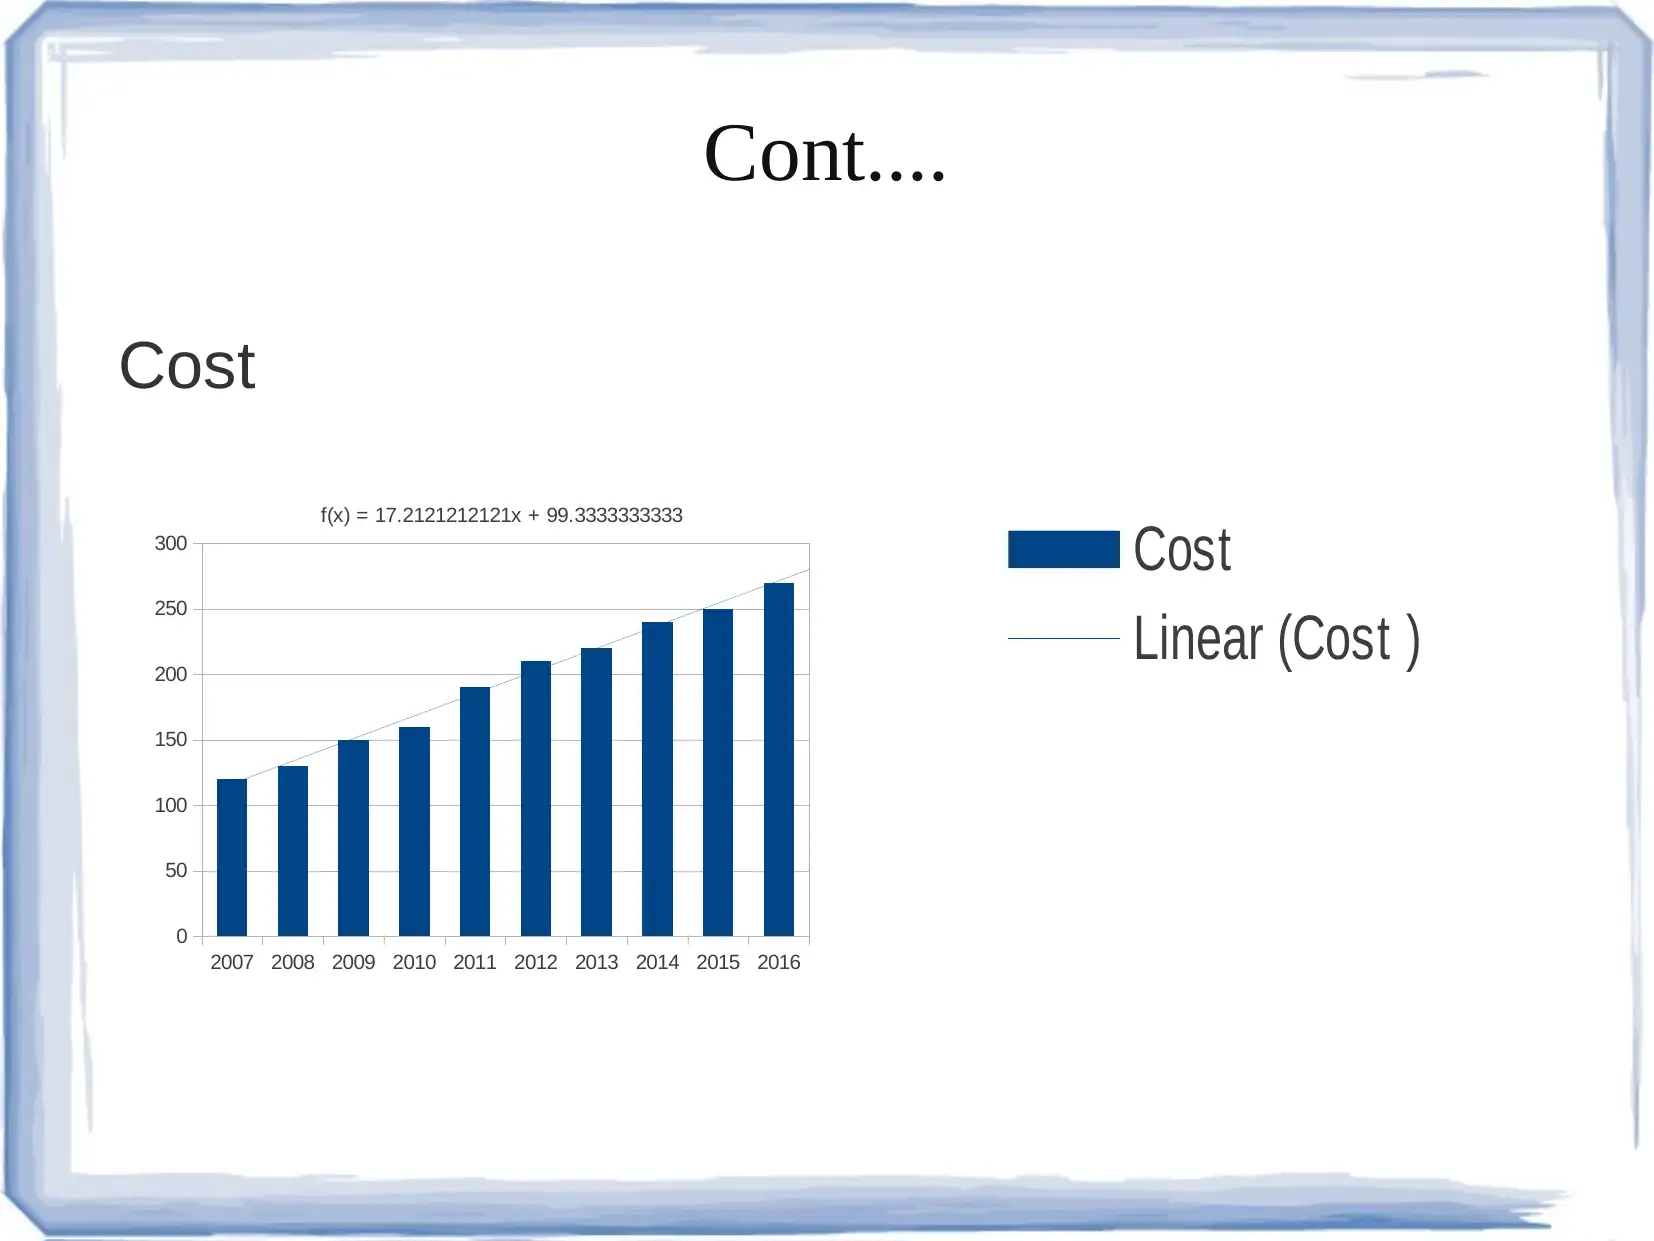
This report focuses on business decision-making for the expansion of the restaurant 'food for friends' in London. It outlines a plan for data collection using primary and secondary sources to understand consumer preferences. The report utilizes various statistical tools, capital budgeting techniques (NPV and IRR), and network diagrams to aid decision-making. Data is presented using graphs created in spreadsheets, and trend lines are used for forecasting sales, costs, and profits. The analysis includes a hypothetical dataset and concludes that, based on the techniques applied, investment for business expansion is not recommended. References include academic sources on agricultural decision-making, farm business development, and the consequences of pride and shame in business.
Document Page
Business decision making
tabler-icon-diamond-filled.svg

Paraphrase This Document

Need a fresh take? Get an instant paraphrase of this document with our AI Paraphraser
Document Page
INTRODUCTION
The present report is based on restaurant ‘food for friends’ which has decided for
expansion of its business in London.
This report will present the plan for collection of data and also various methods
to analyse them.
In this report the manager of research team has got responsibilities to know
about consumer tastes and preferences so that further expansion takes place.
For this various statistical tools, capital budgeting techniques and the network
diagrams were applied by research team so that decision-making can be done.
Document Page
Produce graphs using spreadsheets and
draw valid conclusions based on the
information derived
29/06/1905 30/06/1905 01/07/1905 02/07/1905 03/07/1905 04/07/1905 05/07/1905 06/07/1905 07/07/1905 08/07/1905
0
100
200
300
400
500
600
Profit
Cost
sales
Document Page
Create trend lines in spreadsheet graphs to
assist in forecasting for specified business
information.
2007 2008 2009 2010 2011 2012 2013 2014 2015 2016
0
50
100
150
200
250
300
f(x) = 3.0303030303x + 179.3333333333
Profit
Linear (Profit )
tabler-icon-diamond-filled.svg

Paraphrase This Document

Need a fresh take? Get an instant paraphrase of this document with our AI Paraphraser
Document Page
Cont....
Cost
2007 2008 2009 2010 2011 2012 2013 2014 2015 2016
0
50
100
150
200
250
300
f(x) = 17.2121212121x + 99.3333333333
Cost
Linear (Cost )
Document Page
Cont...
Sales
2007 2008 2009 2010 2011 2012 2013 2014 2015 2016
0
100
200
300
400
500
600
f(x) = 20.2424242424x + 278.6666666667
sales
Linear (sales)
Document Page
CONCLUSION
With the use of various statistical tool and techniques it is concluded that a survey
was conducted by the food for friends restaurant for which the collection of data
through primary and secondary sources has been done.
The collection of data assisted the researcher in understanding the representation
of the consumers so that they can grow their business .
In this hypothetical data of cost related to sales and production is triggered which
is formed by the adoption of trend line, with the help of budgeting techniques i.e.
NPV and IRR it is advised to the food for friends not to do the further
investment for the expansion of the business.
tabler-icon-diamond-filled.svg

Paraphrase This Document

Need a fresh take? Get an instant paraphrase of this document with our AI Paraphraser
Document Page
REFERENCES
Barlett, P.F. ed., 2016. Agricultural decision making: Anthropological
contributions to rural development. Academic Press.
Sutherland, L. A. and Holstead, K. L., 2014. Future-proofing the farm: On-farm
wind turbine development in farm business decision-making. Land use
policy.36. pp.102-112.
Bagozzi, R.P., Sekerka, L.E. and Sguera, F., 2018. Understanding the
consequences of pride and shame: How self-evaluations guide moral decision
making in business. Journal of Business Research. 84. pp.271-284.
Document Page
chevron_up_icon
1 out of 9
circle_padding
hide_on_mobile
zoom_out_icon
[object Object]