Business Decision Making Report: Analysis and Application - BA5F01
VerifiedAdded on 2023/01/05
|9
|2219
|23
Report
AI Summary
This report provides a comprehensive analysis of business decision-making processes. It begins with an introduction to the topic, followed by a detailed examination of statistical concepts, including the creation of a frequency table, and calculations for mean, median, mode, range, variance, and standard deviation. The report then delves into project management techniques by constructing a network diagram to identify the critical path. Furthermore, the report explores financial decision-making tools, such as the payback period and both non-discounted and discounted cash flow methods, with examples to illustrate their application. The report concludes by summarizing the key findings and their implications for effective business decision-making, supported by relevant references.

BUSINESS DECISION
MAKING
MAKING
Paraphrase This Document
Need a fresh take? Get an instant paraphrase of this document with our AI Paraphraser
Table of Contents
INTRODUCTION...........................................................................................................................3
QUESTION 1...................................................................................................................................3
Frequency Table..........................................................................................................................3
QUESTION 2...................................................................................................................................4
1. Mean........................................................................................................................................4
2. Median....................................................................................................................................4
3. Mode.......................................................................................................................................5
4. Range......................................................................................................................................5
5. Variance..................................................................................................................................5
6. Standard Deviation..................................................................................................................6
QUESTION 3...................................................................................................................................6
Network Diagram........................................................................................................................6
Critical Path.................................................................................................................................6
QUESTION 4...................................................................................................................................7
Payback Period............................................................................................................................7
QUESTION 5...................................................................................................................................7
Non Discounted Cash Flow Methods.........................................................................................7
QUESTION 6...................................................................................................................................8
Discounted Cash Flow Methods.................................................................................................8
CONCLUSION................................................................................................................................8
REFERENCES................................................................................................................................9
INTRODUCTION
Business decision making is a crucial activity for any given organisation where there needs
to be a thorough analysis of the existing options that a management has and then selecting the
most profitable one (Dubey, Kothari and Awari, 2016). In this report, various concepts and
calculations related to business decision making will be carried out accordingly.
QUESTION 1
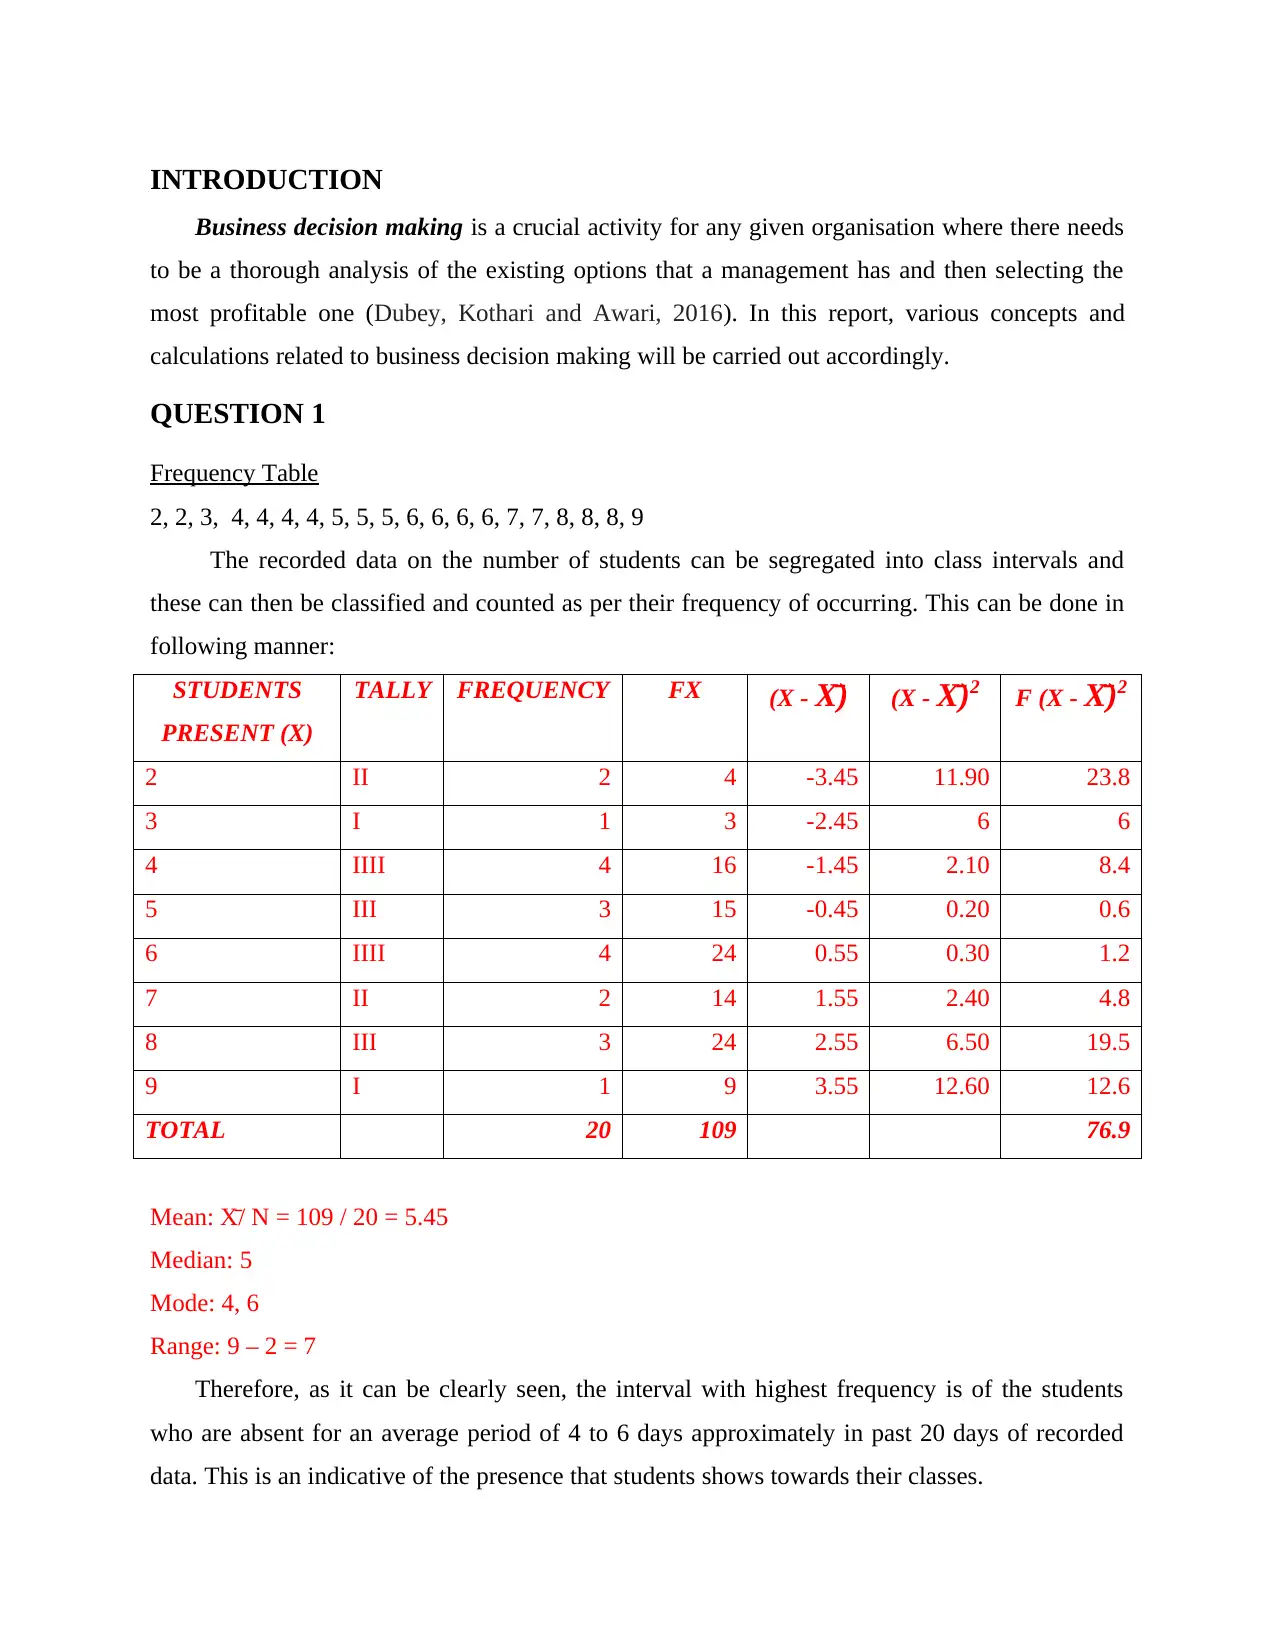
Frequency Table
2, 2, 3, 4, 4, 4, 4, 5, 5, 5, 6, 6, 6, 6, 7, 7, 8, 8, 8, 9
The recorded data on the number of students can be segregated into class intervals and
these can then be classified and counted as per their frequency of occurring. This can be done in
following manner:
STUDENTS
PRESENT (X)
TALLY FREQUENCY FX (X - X̄) (X - X̄)2 F (X - X̄)2
2 II 2 4 -3.45 11.90 23.8
3 I 1 3 -2.45 6 6
4 IIII 4 16 -1.45 2.10 8.4
5 III 3 15 -0.45 0.20 0.6
6 IIII 4 24 0.55 0.30 1.2
7 II 2 14 1.55 2.40 4.8
8 III 3 24 2.55 6.50 19.5
9 I 1 9 3.55 12.60 12.6
TOTAL 20 109 76.9
Mean: X̄/ N = 109 / 20 = 5.45
Median: 5
Mode: 4, 6
Range: 9 – 2 = 7
Therefore, as it can be clearly seen, the interval with highest frequency is of the students
who are absent for an average period of 4 to 6 days approximately in past 20 days of recorded
data. This is an indicative of the presence that students shows towards their classes.
Business decision making is a crucial activity for any given organisation where there needs
to be a thorough analysis of the existing options that a management has and then selecting the
most profitable one (Dubey, Kothari and Awari, 2016). In this report, various concepts and
calculations related to business decision making will be carried out accordingly.
QUESTION 1
Frequency Table
2, 2, 3, 4, 4, 4, 4, 5, 5, 5, 6, 6, 6, 6, 7, 7, 8, 8, 8, 9
The recorded data on the number of students can be segregated into class intervals and
these can then be classified and counted as per their frequency of occurring. This can be done in
following manner:
STUDENTS
PRESENT (X)
TALLY FREQUENCY FX (X - X̄) (X - X̄)2 F (X - X̄)2
2 II 2 4 -3.45 11.90 23.8
3 I 1 3 -2.45 6 6
4 IIII 4 16 -1.45 2.10 8.4
5 III 3 15 -0.45 0.20 0.6
6 IIII 4 24 0.55 0.30 1.2
7 II 2 14 1.55 2.40 4.8
8 III 3 24 2.55 6.50 19.5
9 I 1 9 3.55 12.60 12.6
TOTAL 20 109 76.9
Mean: X̄/ N = 109 / 20 = 5.45
Median: 5
Mode: 4, 6
Range: 9 – 2 = 7
Therefore, as it can be clearly seen, the interval with highest frequency is of the students
who are absent for an average period of 4 to 6 days approximately in past 20 days of recorded
data. This is an indicative of the presence that students shows towards their classes.
⊘ This is a preview!⊘
Do you want full access?
Subscribe today to unlock all pages.
Trusted by 1+ million students worldwide
QUESTION 2
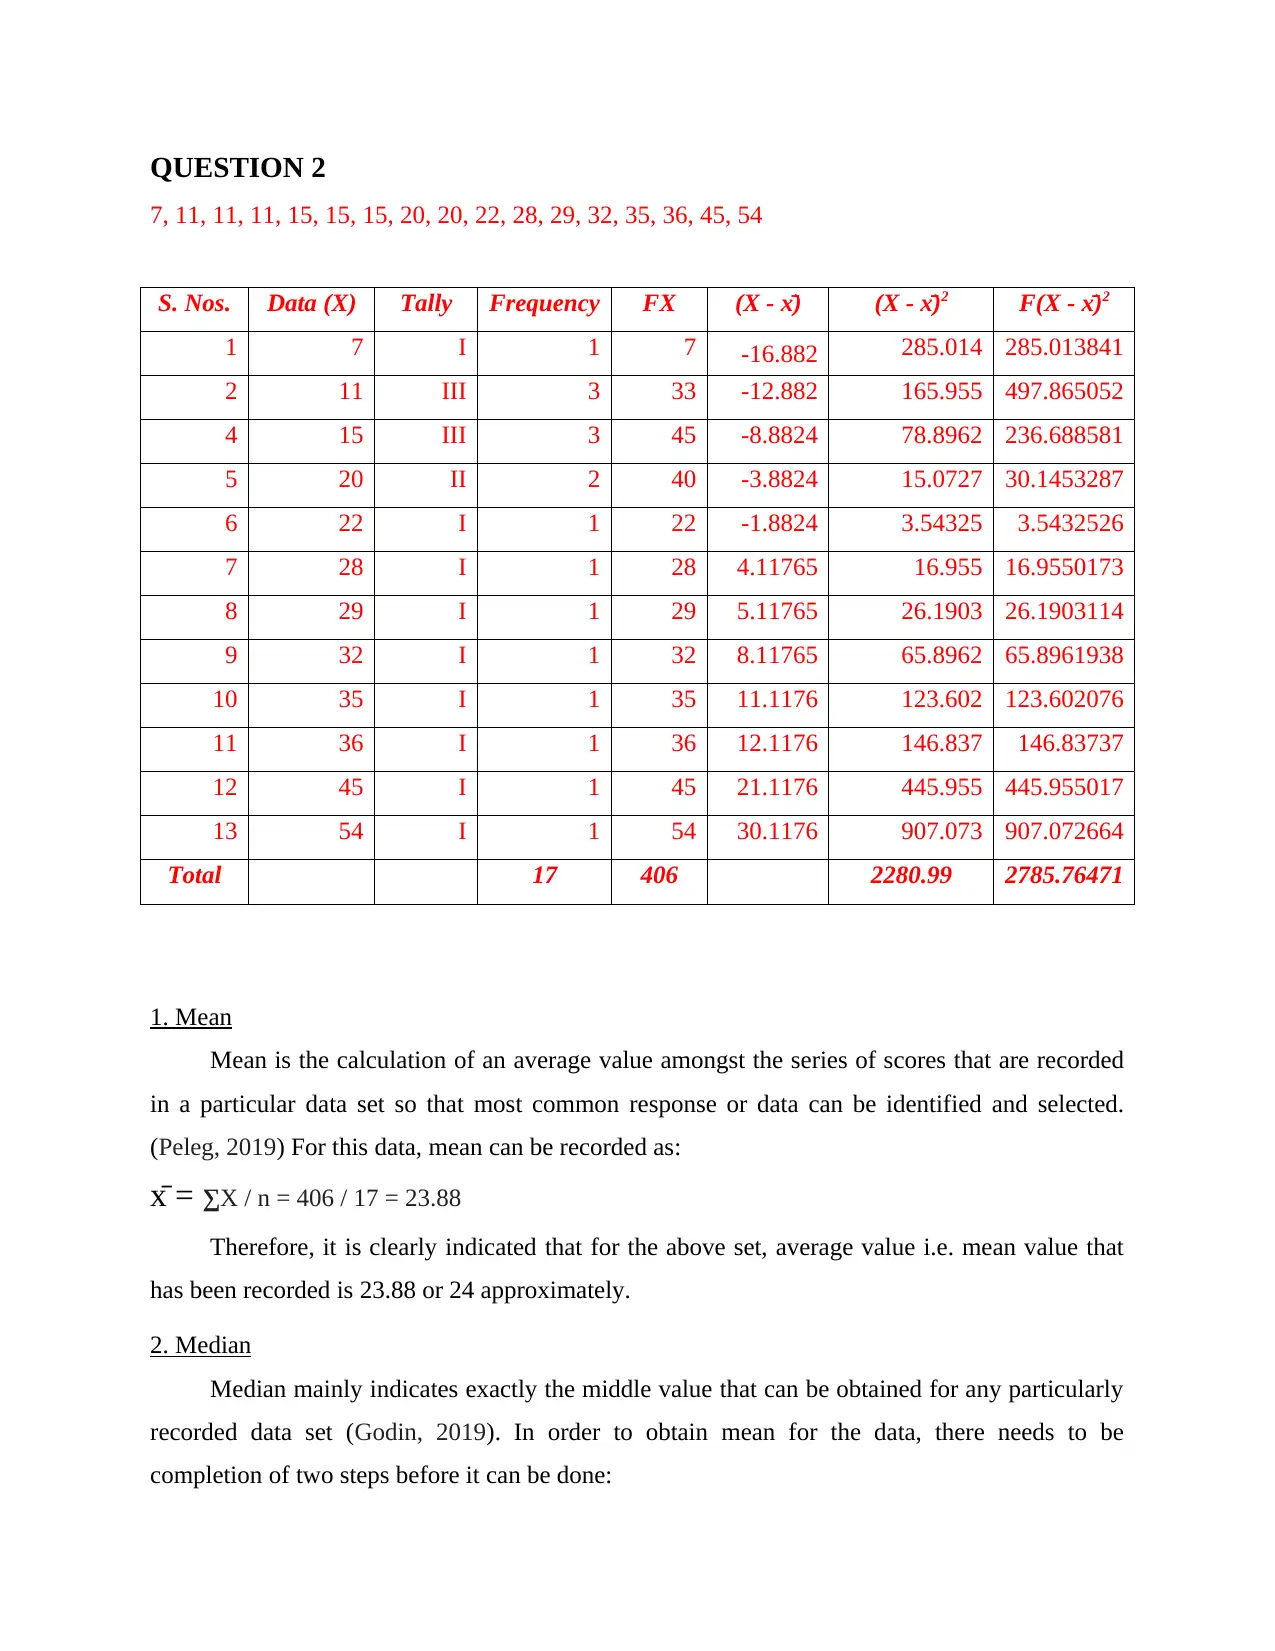
7, 11, 11, 11, 15, 15, 15, 20, 20, 22, 28, 29, 32, 35, 36, 45, 54
S. Nos. Data (X) Tally Frequency FX (X - x̄) (X - x̄)2 F(X - x̄)2
1 7 I 1 7 -16.882 285.014 285.013841
2 11 III 3 33 -12.882 165.955 497.865052
4 15 III 3 45 -8.8824 78.8962 236.688581
5 20 II 2 40 -3.8824 15.0727 30.1453287
6 22 I 1 22 -1.8824 3.54325 3.5432526
7 28 I 1 28 4.11765 16.955 16.9550173
8 29 I 1 29 5.11765 26.1903 26.1903114
9 32 I 1 32 8.11765 65.8962 65.8961938
10 35 I 1 35 11.1176 123.602 123.602076
11 36 I 1 36 12.1176 146.837 146.83737
12 45 I 1 45 21.1176 445.955 445.955017
13 54 I 1 54 30.1176 907.073 907.072664
Total 17 406 2280.99 2785.76471
1. Mean
Mean is the calculation of an average value amongst the series of scores that are recorded
in a particular data set so that most common response or data can be identified and selected.
(Peleg, 2019) For this data, mean can be recorded as:
x̄ = ∑X / n = 406 / 17 = 23.88
Therefore, it is clearly indicated that for the above set, average value i.e. mean value that
has been recorded is 23.88 or 24 approximately.
2. Median
Median mainly indicates exactly the middle value that can be obtained for any particularly
recorded data set (Godin, 2019). In order to obtain mean for the data, there needs to be
completion of two steps before it can be done:
Paraphrase This Document
Need a fresh take? Get an instant paraphrase of this document with our AI Paraphraser
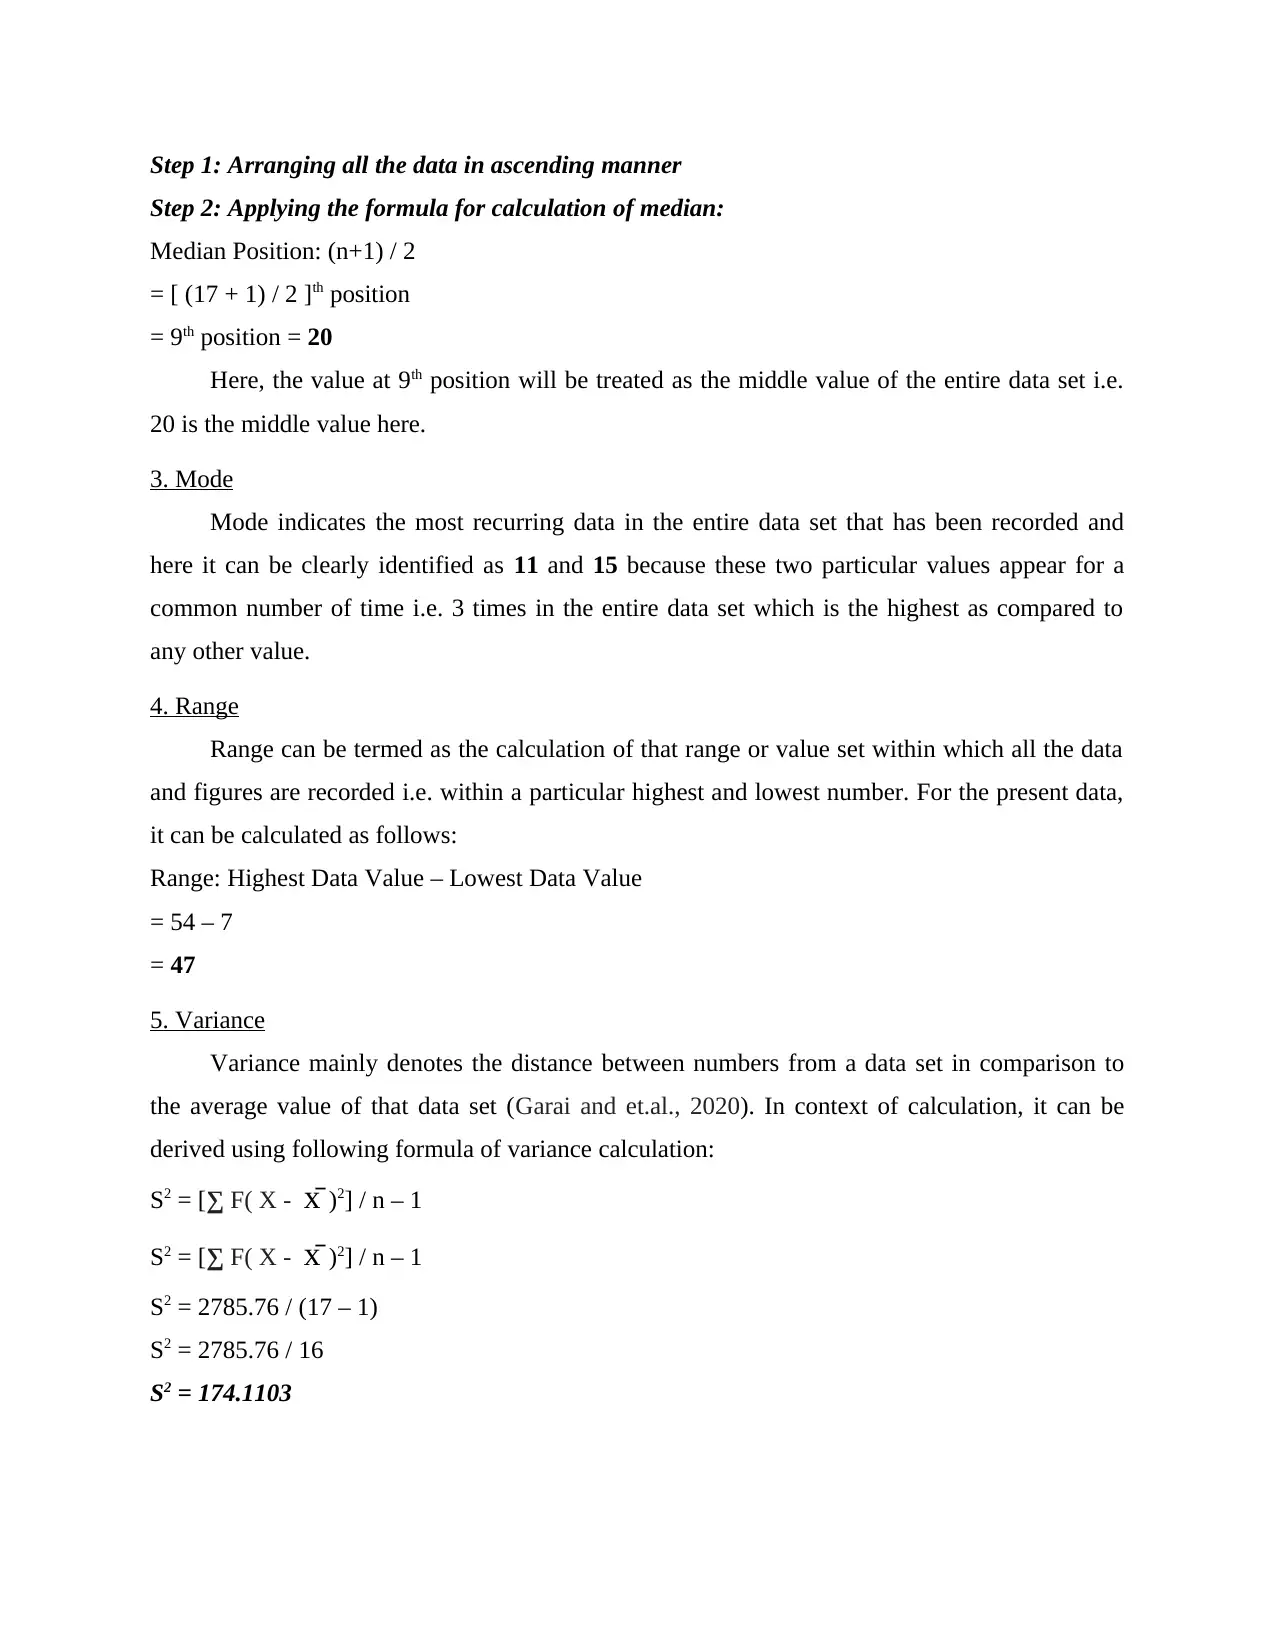
Step 1: Arranging all the data in ascending manner
Step 2: Applying the formula for calculation of median:
Median Position: (n+1) / 2
= [ (17 + 1) / 2 ]th position
= 9th position = 20
Here, the value at 9th position will be treated as the middle value of the entire data set i.e.
20 is the middle value here.
3. Mode
Mode indicates the most recurring data in the entire data set that has been recorded and
here it can be clearly identified as 11 and 15 because these two particular values appear for a
common number of time i.e. 3 times in the entire data set which is the highest as compared to
any other value.
4. Range
Range can be termed as the calculation of that range or value set within which all the data
and figures are recorded i.e. within a particular highest and lowest number. For the present data,
it can be calculated as follows:
Range: Highest Data Value – Lowest Data Value
= 54 – 7
= 47
5. Variance
Variance mainly denotes the distance between numbers from a data set in comparison to
the average value of that data set (Garai and et.al., 2020). In context of calculation, it can be
derived using following formula of variance calculation:
S2 = [∑ F( X - x̄ )2] / n – 1
S2 = [∑ F( X - x̄ )2] / n – 1
S2 = 2785.76 / (17 – 1)
S2 = 2785.76 / 16
S2 = 174.1103
Therefore this indicates that on an average, the squared variation that occurs of the values
in comparison to its average mean are ascertained at the value of 174 approximately indicating
that there are wider variations.
6. Standard Deviation
Standard deviation is identified as the square root of the variance value that has been
calculated and indicates the direct dispersion o the values amongst any particular data set
(Khurche, 2020). For the current set, standard deviation can be calculated as:
Standard Deviation = SQRT (Variance)
= SQRT (174.11)
= 13.19
Therefore, it can be clearly understood that the standard variance has been obtained at the
value of 13.19 for the above data set.
QUESTION 3
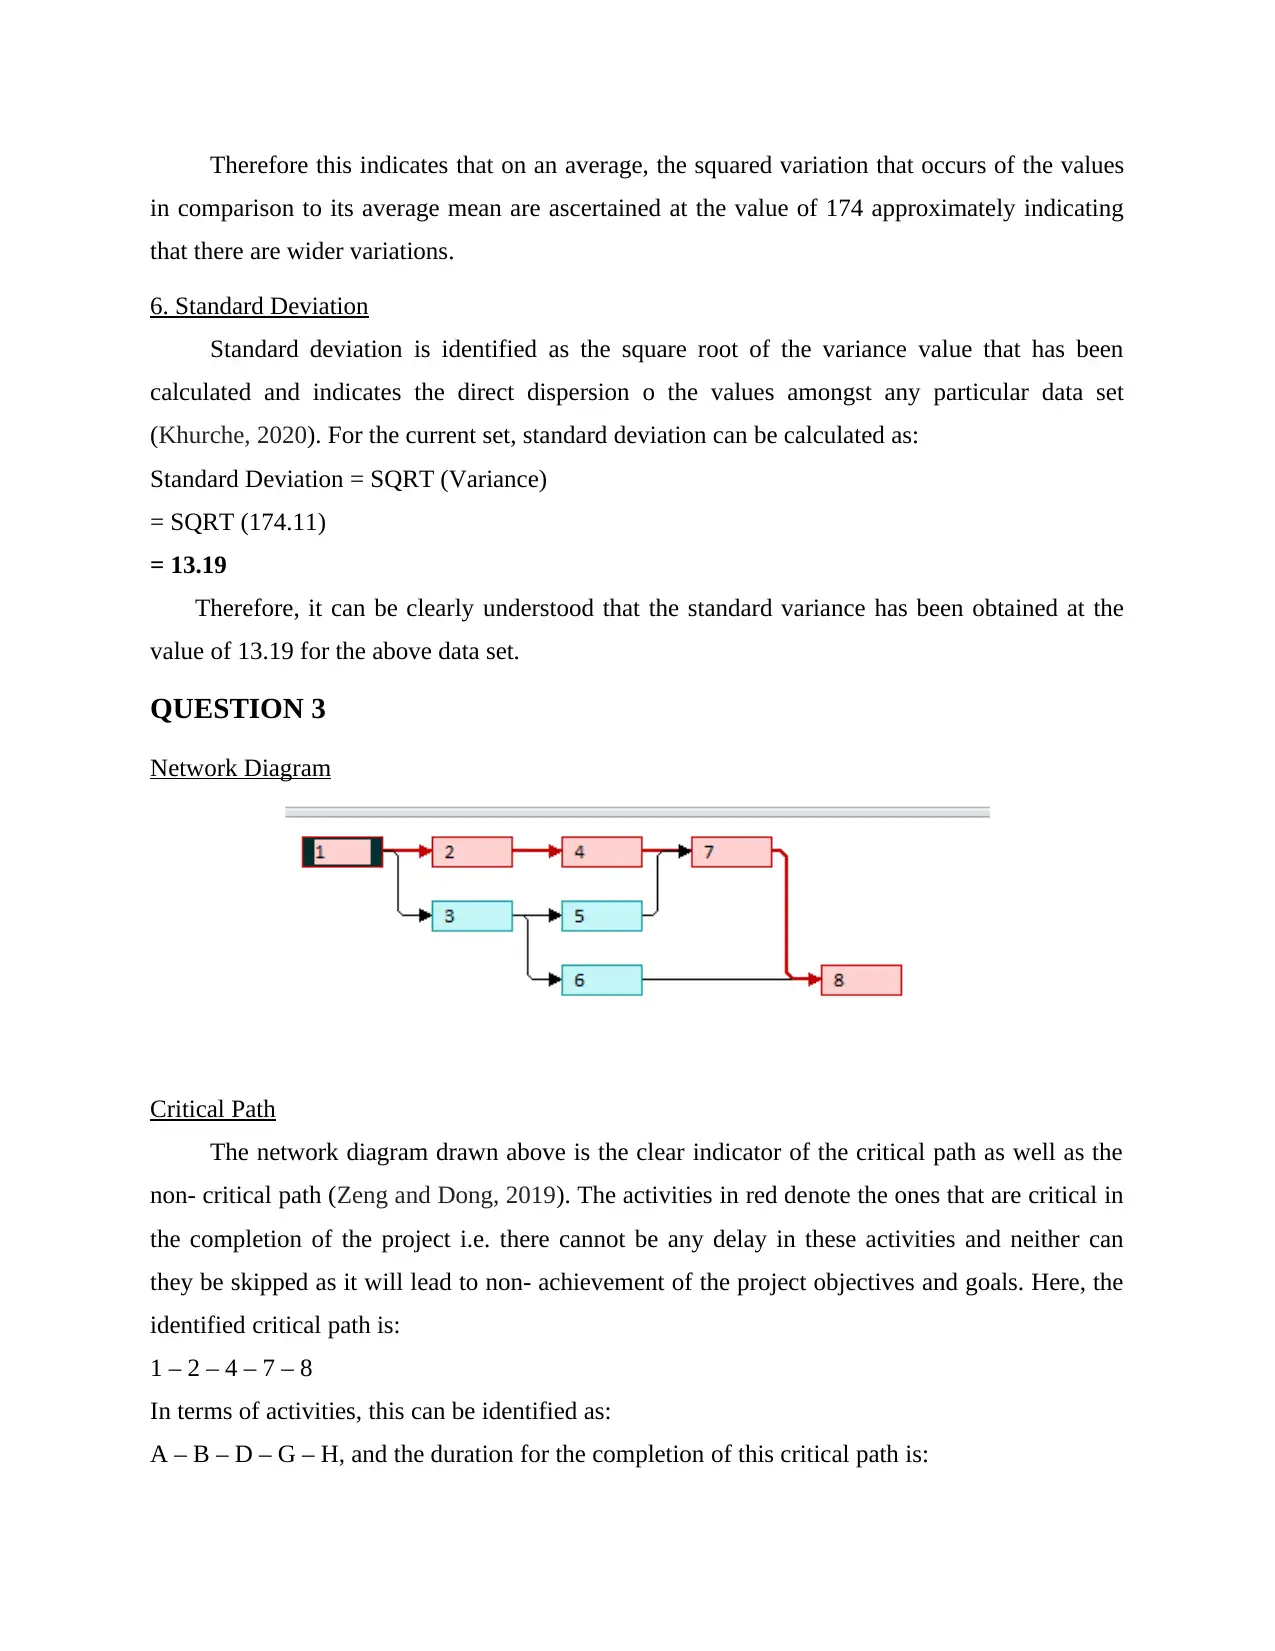
Network Diagram
Critical Path
The network diagram drawn above is the clear indicator of the critical path as well as the
non- critical path (Zeng and Dong, 2019). The activities in red denote the ones that are critical in
the completion of the project i.e. there cannot be any delay in these activities and neither can
they be skipped as it will lead to non- achievement of the project objectives and goals. Here, the
identified critical path is:
1 – 2 – 4 – 7 – 8
In terms of activities, this can be identified as:
A – B – D – G – H, and the duration for the completion of this critical path is:
in comparison to its average mean are ascertained at the value of 174 approximately indicating
that there are wider variations.
6. Standard Deviation
Standard deviation is identified as the square root of the variance value that has been
calculated and indicates the direct dispersion o the values amongst any particular data set
(Khurche, 2020). For the current set, standard deviation can be calculated as:
Standard Deviation = SQRT (Variance)
= SQRT (174.11)
= 13.19
Therefore, it can be clearly understood that the standard variance has been obtained at the
value of 13.19 for the above data set.
QUESTION 3
Network Diagram
Critical Path
The network diagram drawn above is the clear indicator of the critical path as well as the
non- critical path (Zeng and Dong, 2019). The activities in red denote the ones that are critical in
the completion of the project i.e. there cannot be any delay in these activities and neither can
they be skipped as it will lead to non- achievement of the project objectives and goals. Here, the
identified critical path is:
1 – 2 – 4 – 7 – 8
In terms of activities, this can be identified as:
A – B – D – G – H, and the duration for the completion of this critical path is:
⊘ This is a preview!⊘
Do you want full access?
Subscribe today to unlock all pages.
Trusted by 1+ million students worldwide
3 days + 4 days + 5 days + 4 days + 3 days
19 days.
Since out of all the plausible paths, the longest path is categorised as the critical path, it
can be further verified by calculating the duration of all the paths that are identifiable in the
network diagram:
Path 1: 1 – 2 – 4 – 7 – 8
Path 1: 3 + 4 + 5 + 4 + 3
Path 1: 19 days
Path 2: 1 – 3 – 5 – 7 – 8
Path 2: 3 + 2 + 1 + 4 + 3
Path 2: 13 days
Path 3: 1 – 3 – 6 – 8
Path 3: 3 + 2 + 2 + 3
Path 3: 10 days
As it has been clearly identified, the critical path is path 1 which will require 19 days to be
completed altogether.
QUESTION 4
Payback Period
Payback period helps in obtaining the time period within which the investment that is
being made on any asset ca be recovered effectively. For Delta, this can be calculated as:
Payback Period = Amount that is to be invested / Annual net cash flow
Payback period = 25000/ 10000 = 2.5 years
Therefore, within a period of just 2.5 years, Delta would be able to recover the amount that
they have invested. Now since, the maximum desired payback time is 3 years an the actual one
which has been computed is less that this i.e. it is only 2.5 years, it is beneficial for Delta to
invest in this machine X in good faith.
QUESTION 5
Non Discounted Cash Flow Methods
Two traditional methods of capital budgeting can be identified as:
Paraphrase This Document
Need a fresh take? Get an instant paraphrase of this document with our AI Paraphraser
Payback Method: This method just identifies the time period in which company can
recover investment that it is doing and only potential cash inflows are taken into
consideration (Sarwary, 2019). The time value of money aspect is completely ignored
here.
Payback Period: Investment / Annual Cash Inflow
Accounting rate of return: Here, although the rate of return does take into consideration
the life of investment and selects only those rates which are more than the minimum rates
(Gupta, 2017). Also, these rates only denote a percentage of the potential earnings that
management can gain, but still, this method also fails to consider time value of money in
their calculation which again raises a major question on the efficacy of this method.
ARR = Average Income / Average Investment Value
QUESTION 6
Discounted Cash Flow Methods
The two prominent techniques under discounted cash flow methods that yield accurate and
updated results are:
Net Present Value: NPV is the most preferred technique where investment made in
future is discounted at the present value and then the net profitability of the investment is
being obtained (Farnham, 2016 ). Here time value is the sole basis of asset evaluation and
a higher or/ and positive NPV indicates the viability of the investment options. Formula
for this is:
NPV = Present value of Cash inflows – Initial Investment being made
Internal Rate of Return: Here NPV on any investment is taken at 0 and discounted
outflow is treated as equivalent to discounted outflow (Shaban, Al-Zubi and Abdallah,
2017). Here, in consideration with the time value, a particular rate of interest is obtained
at which, if funds are invested by company, then they can be paid from the inflows itself.
CONCLUSION
The report discussed various concepts, mean, mode median, frequency tables, calculation of
critical paths and also analysis of capital budgeting techniques and their implementation. It was
illustrated that how these different techniques can be used to obtain relevant results and take
decisions.
REFERENCES
Books and journals
Dubey, U., Kothari, D.P. and Awari, G.K., 2016. Quantitative techniques in business,
management and finance: A case-study approach. CRC Press.
Farnham, L., 2016 Capital Budgeting Techniques.
Garai, T., and et.al., 2020. Possibility mean, variance and standard deviation of single-valued
neutrosophic numbers and its applications to multi-attribute decision-making
problems. Soft Computing, pp.1-15.
Godin, S., 2019. WHAT'S THE PROBLEM? MESSING WITH MEAN, MEDIAN, AND
MODE. Gazette-Ontario Association for Mathematics, 58(1), pp.44-46.
Gupta, D., 2017. Capital budgeting decisions and the firm’s size. International Journal of
Economic Behavior and Organization, 4(6), p.45.
Khurche, R.D., 2020. Standard Deviation & Variance.
Peleg, M., 2019. Beta distributions for particle size having a finite range and predetermined
mode, mean or median. Powder Technology, 356, pp.790-794.
Sarwary, Z., 2019. Capital budgeting techniques in SMEs: A literature review. Journal of
Accounting and Finance, 19(3).
Shaban, O.S., Al-Zubi, Z. and Abdallah, A.A., 2017. The Extent of Using Capital Budgeting
Techniques in Evaluating Manager’s Investments Projects Decisions (A Case Study on
Jordanian Industrial Companies). International Journal of Economics and
Finance, 9(12), pp.175-179.
Zeng, X. and Dong, J., 2019. Calculation in Seconds for Time-Parameters and Critical Path of
the Network Diagram.
⊘ This is a preview!⊘
Do you want full access?
Subscribe today to unlock all pages.
Trusted by 1+ million students worldwide
1 out of 9
Related Documents


Your All-in-One AI-Powered Toolkit for Academic Success.
+13062052269
info@desklib.com
Available 24*7 on WhatsApp / Email
![[object Object]](/_next/static/media/star-bottom.7253800d.svg)
Unlock your academic potential
Copyright © 2020–2025 A2Z Services. All Rights Reserved. Developed and managed by ZUCOL.