Business Decision Making Report - Module Analysis, HND Level 5
VerifiedAdded on 2020/07/23
|21
|4774
|32
Report
AI Summary
This report delves into the realm of business decision-making, focusing on the application of data analysis techniques to real-world scenarios. The project centers on Murano restaurant, a small business, and explores the collection of both primary and secondary data. The report details the planning of data collection, survey methodology, questionnaire design, and sampling frames. It further analyzes the collected data using measures of central tendency and dispersion, correlation coefficients, and trend lines. The study also incorporates the use of software-generated information, time scales, and financial data to determine project feasibility, culminating in a comprehensive report presentation designed for senior management. The report highlights the importance of informed decision-making in supporting business growth and maximizing operations, as well as the effective use of data analysis in business strategy.
Business Decision Making
Paraphrase This Document
Need a fresh take? Get an instant paraphrase of this document with our AI Paraphraser
Table of Contents
INTRODUCTION...........................................................................................................................1
TASK 1............................................................................................................................................1
1.1 Plan for collecting primary and secondary data....................................................................1
1.2 Survey methodology and sampling frame.............................................................................2
1.3 Designing a questionnaire for study......................................................................................2
2.1 Dissemination of information...............................................................................................4
2.2 Analysis of data by using measure of central tendency........................................................5
2.3 Analysis of data by using measure of dispersion..................................................................5
2.4 Use of correlation coefficient for decision making...............................................................6
TASK 2............................................................................................................................................7
3.1 Creation of graphs and charts................................................................................................7
3.2 Use of trend line in interpretation as well as future forecasting...........................................9
3.3 Presentation of report with suitable graphs and charts........................................................10
3.4 Report presentation by devising all sections to senior management...................................10
TASK 3..........................................................................................................................................11
4.1 Use of software generated information...............................................................................11
4.2 Use of time scale for evaluating duration of project...........................................................11
4.3 Use of financial information in order to determine feasibility of project...........................13
CONCLUSION..............................................................................................................................14
REFERENCES..............................................................................................................................16
INTRODUCTION
An appropriate judgement always support an organisation to grow and maximise
operations at a large scale (Ferrell and Fraedrich, 2015). In this context, it is the duty of
managers to take beneficial judgement which promotes and supports an association to grow and
maximise operations as well. This project is based on Murano restaurant which is one of the
well-established small firms in London with appropriate customer base. Many people proclaim
that they deliver high quality products to gain better and suitable outcomes. There are variety of
sources could be used by an organisation in order to collect primary and secondary data as per
primary and secondary basis. On the basis of such consideration, there are various techniques get
evaluated which need to understand by business managers properly and utilise them effectively
for business purpose. With collected information, data need to get presented in an appropriate
frame with suitable graphs and charts for better and effective working. Thus, for better and
appropriate decision making, software generated information need to implement in an
organisation.
TASK 1
1.1 Plan for collecting primary and secondary data
A major thing which supports any kind of investigation is primary and secondary data
process (Ford and Richardson, 2013). Business needs to evaluate both these methods and
techniques properly so that appropriate and suitable study will lead to get organised. Thus,
Murano needs to understand both these approaches properly and frame suitable plan to collect
information for new chain in other parts of London, UK.
Primary data: One of the major sources for gathering information which is raw in nature
and organised on vast range of people is primary data. It is the type of study which
supports in gaining better and effective outcomes directly through an individual by
conducting interview, questionnaire survey, etc. Murano can use this technique for
evaluating appropriate and suitable aspects properly in order to determine the best
suitable results and outcomes directly through customers.
Secondary data: This is another kind of data collection process but in never provides raw
information in nature but based on already propose studies. Such information for business
is in the form of previous balance sheet, past year’s profit, etc. These records are used for
1
⊘ This is a preview!⊘
Do you want full access?
Subscribe today to unlock all pages.
Trusted by 1+ million students worldwide
deriving comparison between performances of a company. Murano can use this pathway
for evaluating the feasibility of future concern project by using past few records.
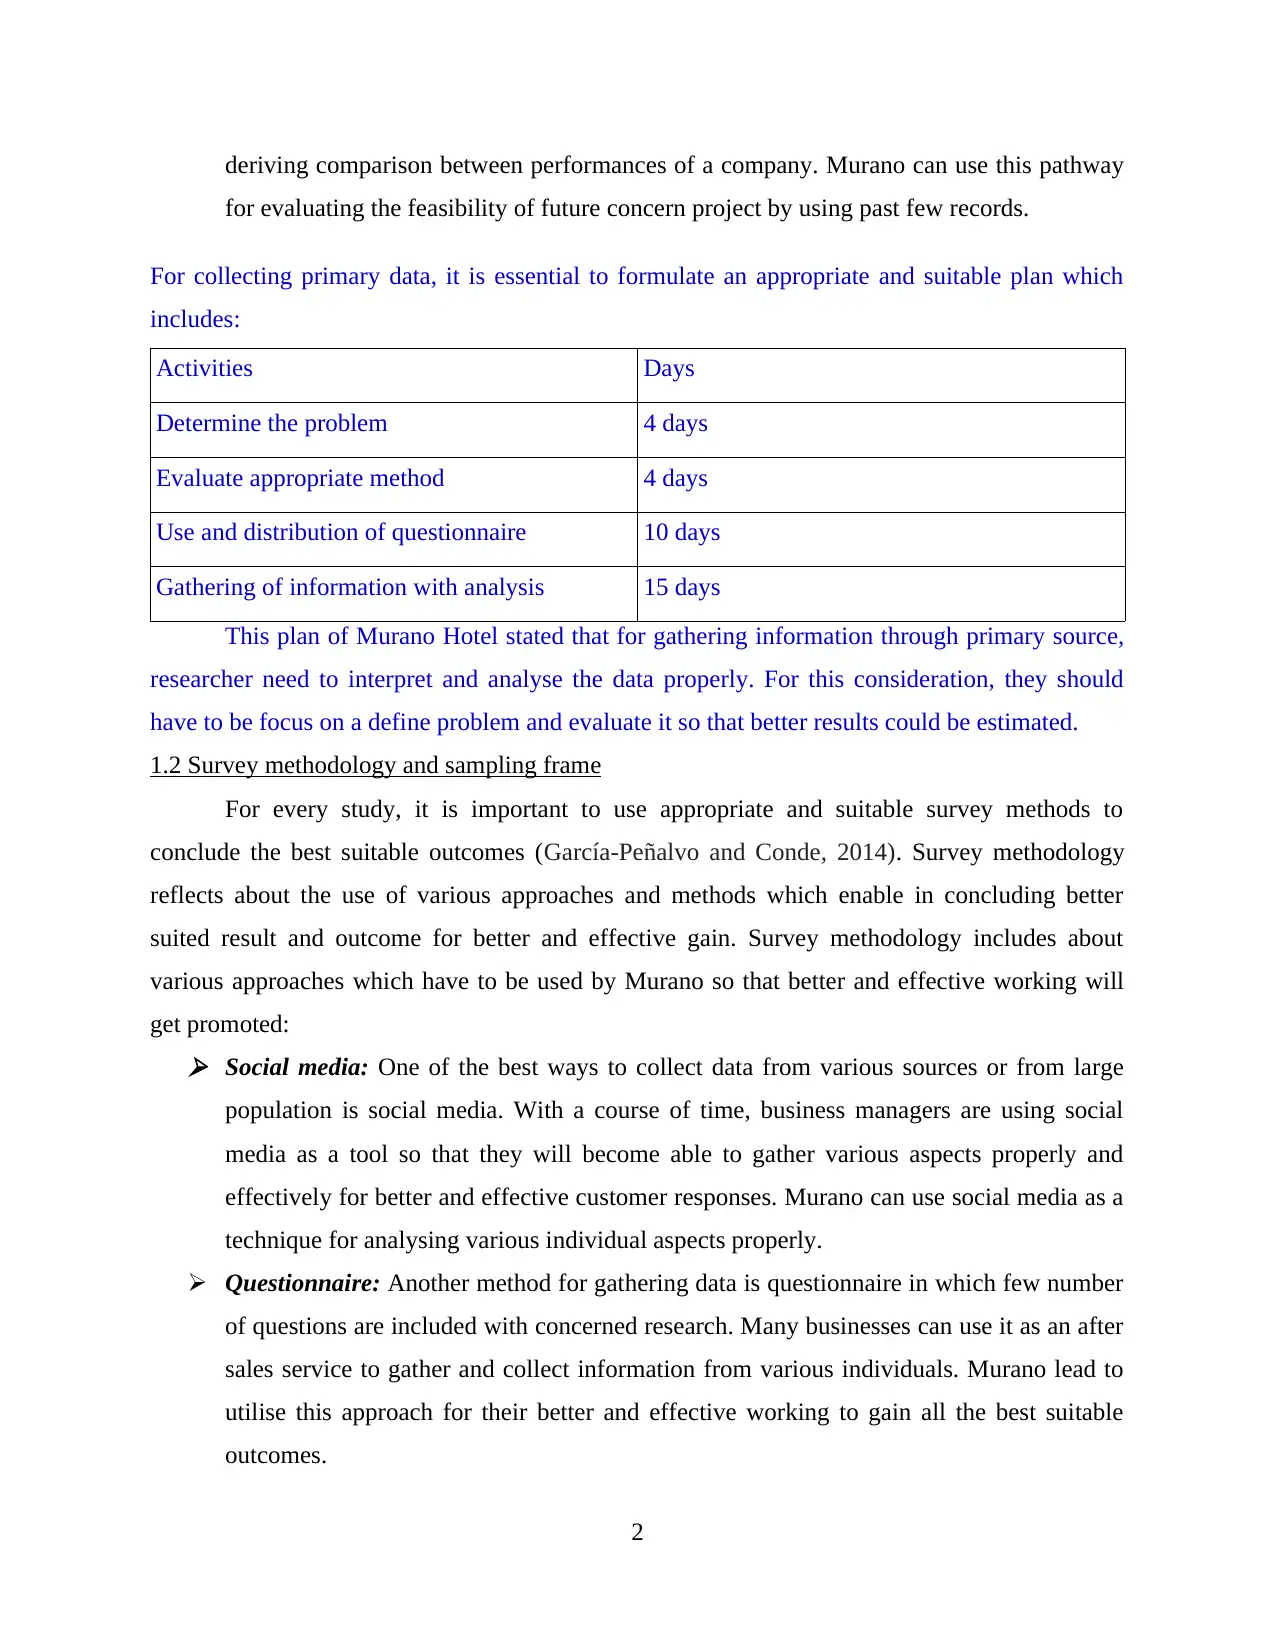
For collecting primary data, it is essential to formulate an appropriate and suitable plan which
includes:
Activities Days
Determine the problem 4 days
Evaluate appropriate method 4 days
Use and distribution of questionnaire 10 days
Gathering of information with analysis 15 days
This plan of Murano Hotel stated that for gathering information through primary source,
researcher need to interpret and analyse the data properly. For this consideration, they should
have to be focus on a define problem and evaluate it so that better results could be estimated.
1.2 Survey methodology and sampling frame
For every study, it is important to use appropriate and suitable survey methods to
conclude the best suitable outcomes (García-Peñalvo and Conde, 2014). Survey methodology
reflects about the use of various approaches and methods which enable in concluding better
suited result and outcome for better and effective gain. Survey methodology includes about
various approaches which have to be used by Murano so that better and effective working will
get promoted: Social media: One of the best ways to collect data from various sources or from large
population is social media. With a course of time, business managers are using social
media as a tool so that they will become able to gather various aspects properly and
effectively for better and effective customer responses. Murano can use social media as a
technique for analysing various individual aspects properly.
Questionnaire: Another method for gathering data is questionnaire in which few number
of questions are included with concerned research. Many businesses can use it as an after
sales service to gather and collect information from various individuals. Murano lead to
utilise this approach for their better and effective working to gain all the best suitable
outcomes.
2
for evaluating the feasibility of future concern project by using past few records.
For collecting primary data, it is essential to formulate an appropriate and suitable plan which
includes:
Activities Days
Determine the problem 4 days
Evaluate appropriate method 4 days
Use and distribution of questionnaire 10 days
Gathering of information with analysis 15 days
This plan of Murano Hotel stated that for gathering information through primary source,
researcher need to interpret and analyse the data properly. For this consideration, they should
have to be focus on a define problem and evaluate it so that better results could be estimated.
1.2 Survey methodology and sampling frame
For every study, it is important to use appropriate and suitable survey methods to
conclude the best suitable outcomes (García-Peñalvo and Conde, 2014). Survey methodology
reflects about the use of various approaches and methods which enable in concluding better
suited result and outcome for better and effective gain. Survey methodology includes about
various approaches which have to be used by Murano so that better and effective working will
get promoted: Social media: One of the best ways to collect data from various sources or from large
population is social media. With a course of time, business managers are using social
media as a tool so that they will become able to gather various aspects properly and
effectively for better and effective customer responses. Murano can use social media as a
technique for analysing various individual aspects properly.
Questionnaire: Another method for gathering data is questionnaire in which few number
of questions are included with concerned research. Many businesses can use it as an after
sales service to gather and collect information from various individuals. Murano lead to
utilise this approach for their better and effective working to gain all the best suitable
outcomes.
2
Paraphrase This Document
Need a fresh take? Get an instant paraphrase of this document with our AI Paraphraser
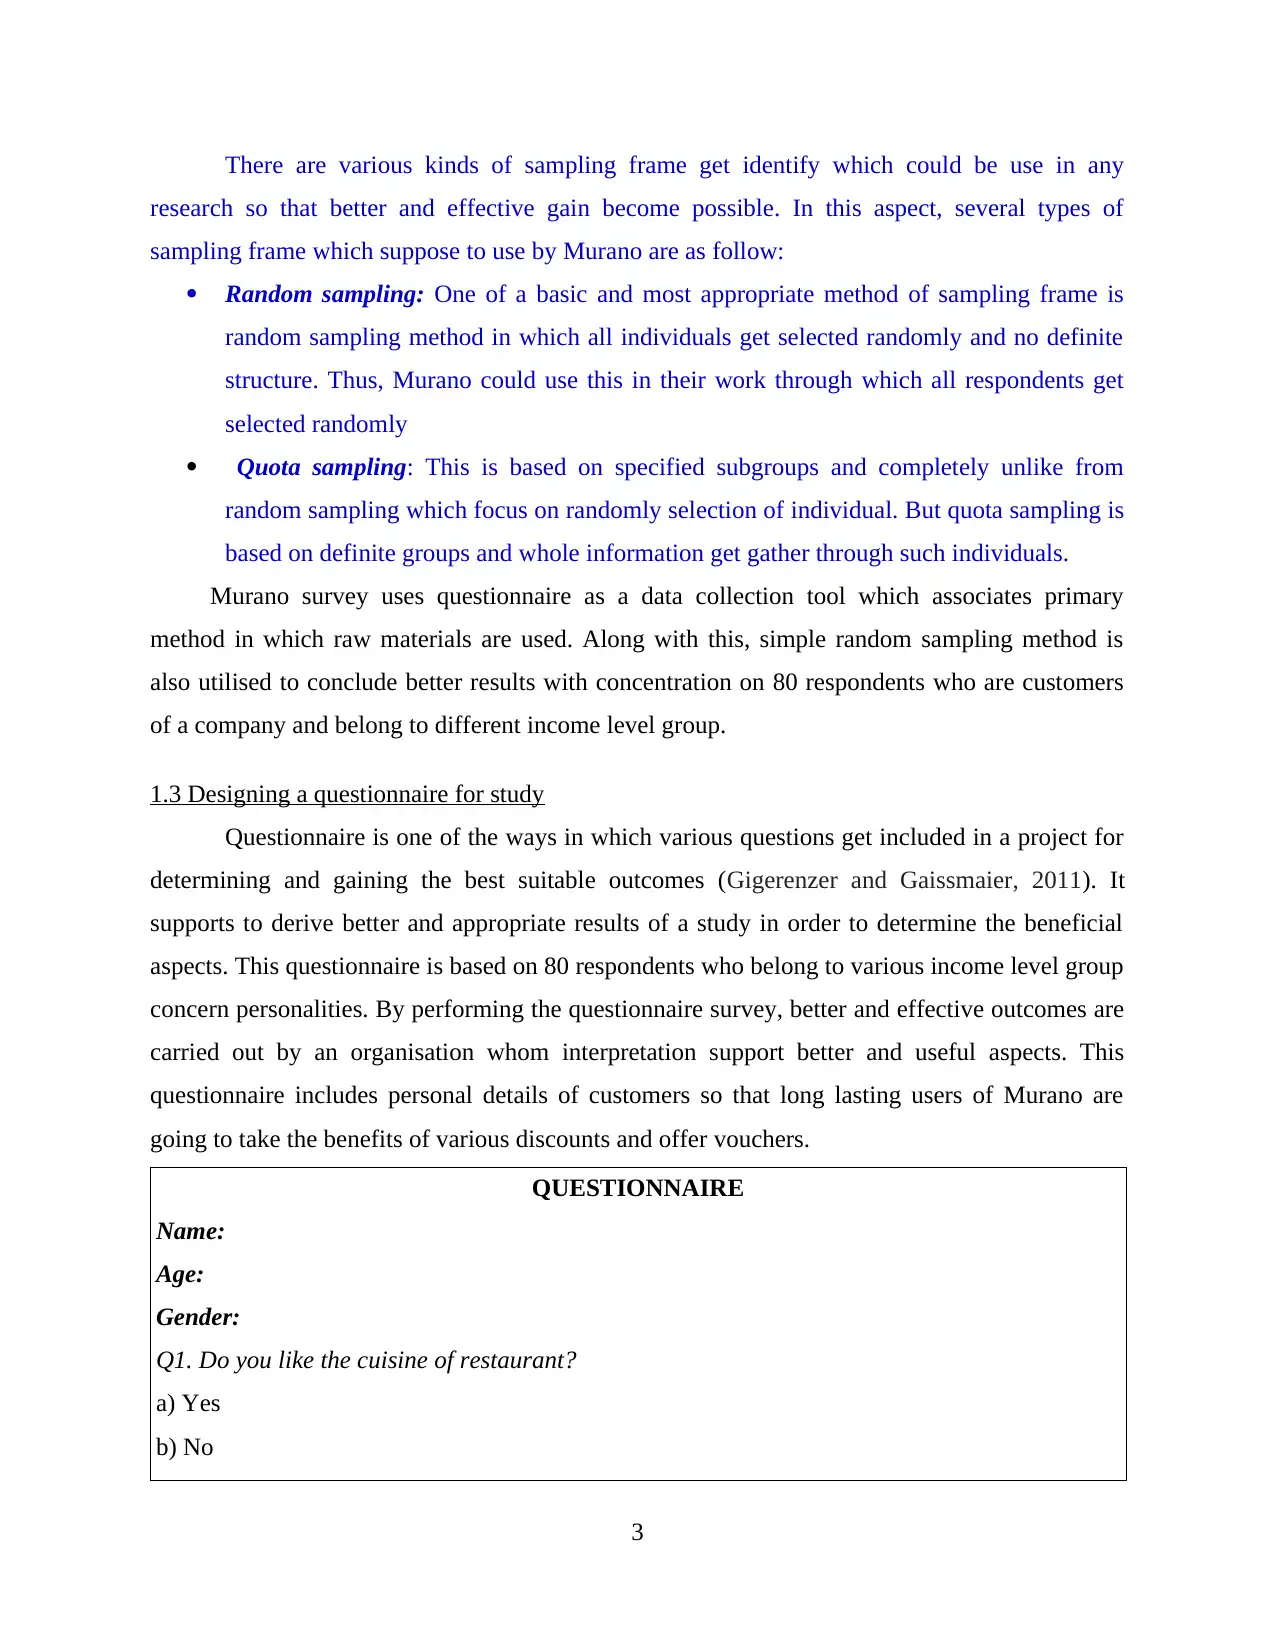
There are various kinds of sampling frame get identify which could be use in any
research so that better and effective gain become possible. In this aspect, several types of
sampling frame which suppose to use by Murano are as follow:
Random sampling: One of a basic and most appropriate method of sampling frame is
random sampling method in which all individuals get selected randomly and no definite
structure. Thus, Murano could use this in their work through which all respondents get
selected randomly
Quota sampling: This is based on specified subgroups and completely unlike from
random sampling which focus on randomly selection of individual. But quota sampling is
based on definite groups and whole information get gather through such individuals.
Murano survey uses questionnaire as a data collection tool which associates primary
method in which raw materials are used. Along with this, simple random sampling method is
also utilised to conclude better results with concentration on 80 respondents who are customers
of a company and belong to different income level group.
1.3 Designing a questionnaire for study
Questionnaire is one of the ways in which various questions get included in a project for
determining and gaining the best suitable outcomes (Gigerenzer and Gaissmaier, 2011). It
supports to derive better and appropriate results of a study in order to determine the beneficial
aspects. This questionnaire is based on 80 respondents who belong to various income level group
concern personalities. By performing the questionnaire survey, better and effective outcomes are
carried out by an organisation whom interpretation support better and useful aspects. This
questionnaire includes personal details of customers so that long lasting users of Murano are
going to take the benefits of various discounts and offer vouchers.
QUESTIONNAIRE
Name:
Age:
Gender:
Q1. Do you like the cuisine of restaurant?
a) Yes
b) No
3
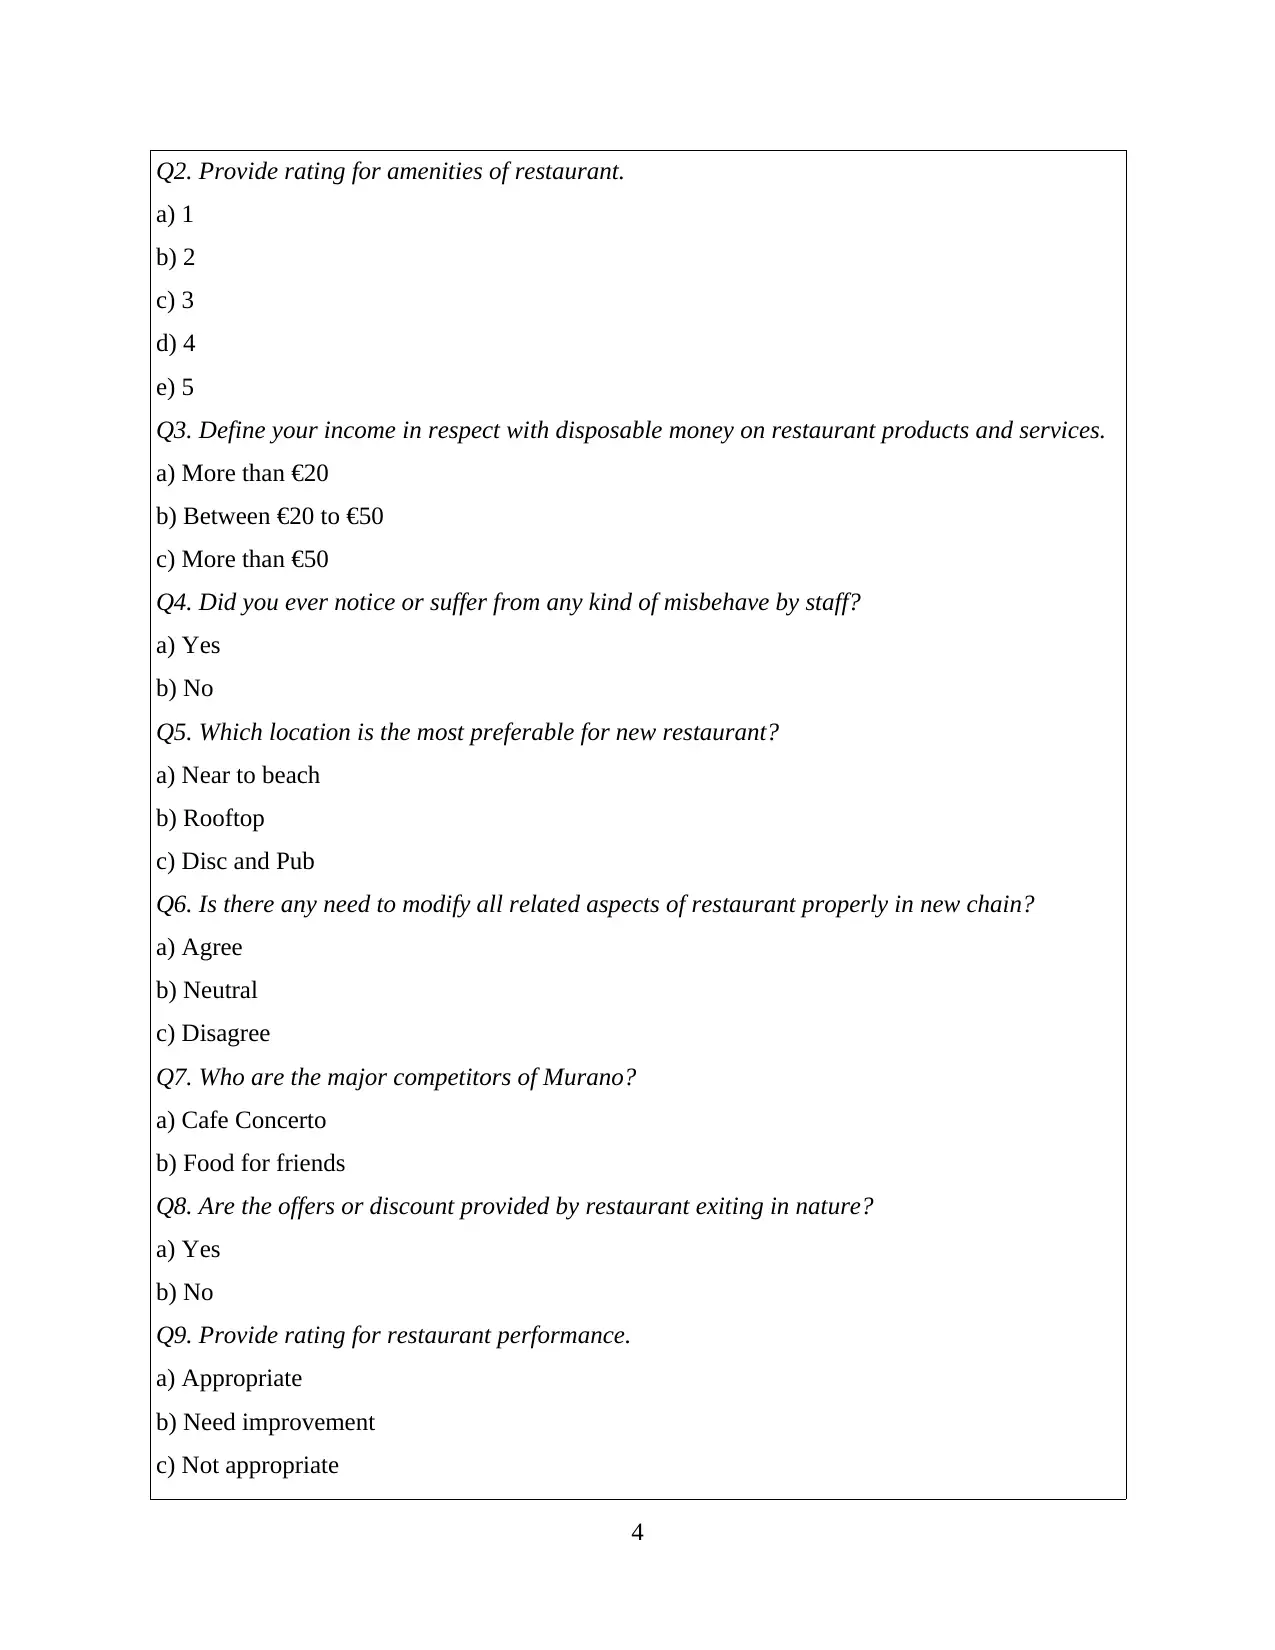
Q2. Provide rating for amenities of restaurant.
a) 1
b) 2
c) 3
d) 4
e) 5
Q3. Define your income in respect with disposable money on restaurant products and services.
a) More than €20
b) Between €20 to €50
c) More than €50
Q4. Did you ever notice or suffer from any kind of misbehave by staff?
a) Yes
b) No
Q5. Which location is the most preferable for new restaurant?
a) Near to beach
b) Rooftop
c) Disc and Pub
Q6. Is there any need to modify all related aspects of restaurant properly in new chain?
a) Agree
b) Neutral
c) Disagree
Q7. Who are the major competitors of Murano?
a) Cafe Concerto
b) Food for friends
Q8. Are the offers or discount provided by restaurant exiting in nature?
a) Yes
b) No
Q9. Provide rating for restaurant performance.
a) Appropriate
b) Need improvement
c) Not appropriate
4
⊘ This is a preview!⊘
Do you want full access?
Subscribe today to unlock all pages.
Trusted by 1+ million students worldwide
Q10. Any further suggestions or recommendations?
____________________________________________________________________________
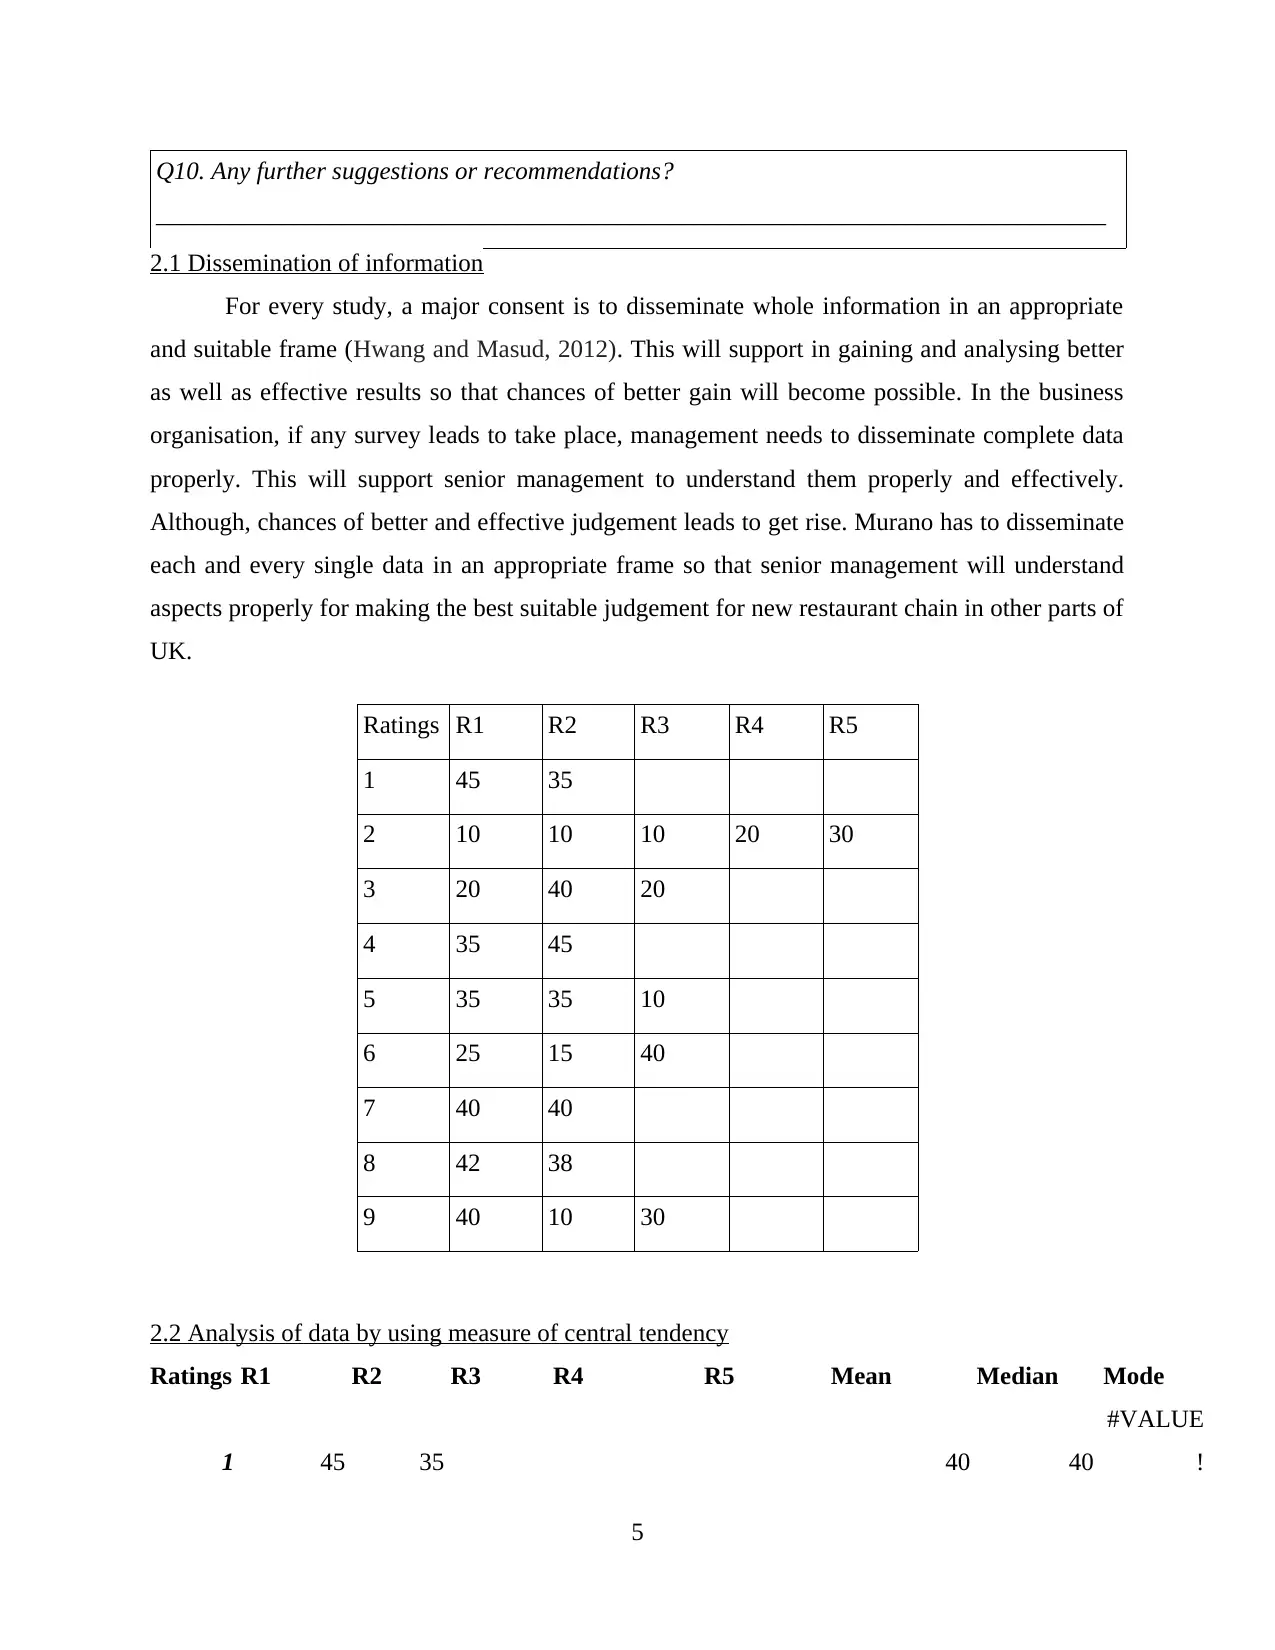
2.1 Dissemination of information
For every study, a major consent is to disseminate whole information in an appropriate
and suitable frame (Hwang and Masud, 2012). This will support in gaining and analysing better
as well as effective results so that chances of better gain will become possible. In the business
organisation, if any survey leads to take place, management needs to disseminate complete data
properly. This will support senior management to understand them properly and effectively.
Although, chances of better and effective judgement leads to get rise. Murano has to disseminate
each and every single data in an appropriate frame so that senior management will understand
aspects properly for making the best suitable judgement for new restaurant chain in other parts of
UK.
Ratings R1 R2 R3 R4 R5
1 45 35
2 10 10 10 20 30
3 20 40 20
4 35 45
5 35 35 10
6 25 15 40
7 40 40
8 42 38
9 40 10 30
2.2 Analysis of data by using measure of central tendency
Ratings R1 R2 R3 R4 R5 Mean Median Mode
1 45 35 40 40
#VALUE
!
5
____________________________________________________________________________
2.1 Dissemination of information
For every study, a major consent is to disseminate whole information in an appropriate
and suitable frame (Hwang and Masud, 2012). This will support in gaining and analysing better
as well as effective results so that chances of better gain will become possible. In the business
organisation, if any survey leads to take place, management needs to disseminate complete data
properly. This will support senior management to understand them properly and effectively.
Although, chances of better and effective judgement leads to get rise. Murano has to disseminate
each and every single data in an appropriate frame so that senior management will understand
aspects properly for making the best suitable judgement for new restaurant chain in other parts of
UK.
Ratings R1 R2 R3 R4 R5
1 45 35
2 10 10 10 20 30
3 20 40 20
4 35 45
5 35 35 10
6 25 15 40
7 40 40
8 42 38
9 40 10 30
2.2 Analysis of data by using measure of central tendency
Ratings R1 R2 R3 R4 R5 Mean Median Mode
1 45 35 40 40
#VALUE
!
5
Paraphrase This Document
Need a fresh take? Get an instant paraphrase of this document with our AI Paraphraser
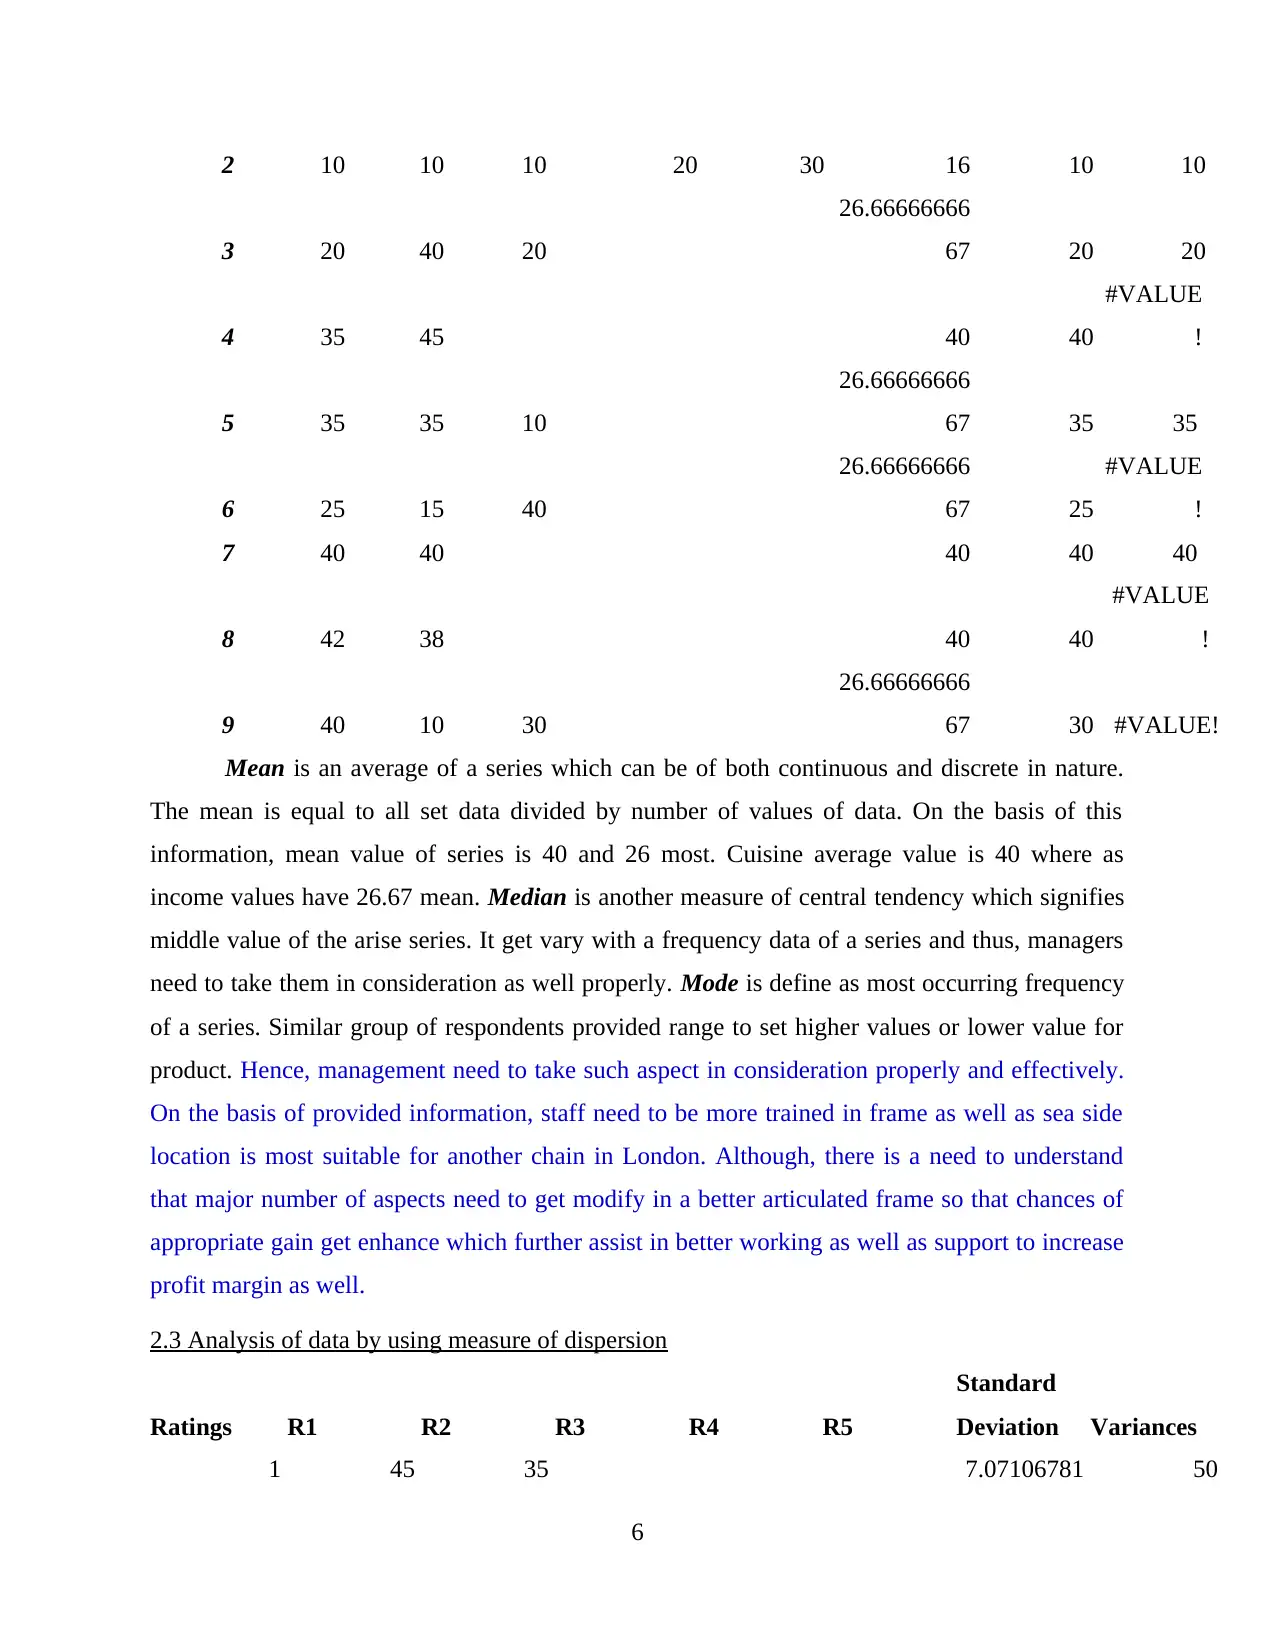
2 10 10 10 20 30 16 10 10
3 20 40 20
26.66666666
67 20 20
4 35 45 40 40
#VALUE
!
5 35 35 10
26.66666666
67 35 35
6 25 15 40
26.66666666
67 25
#VALUE
!
7 40 40 40 40 40
8 42 38 40 40
#VALUE
!
9 40 10 30
26.66666666
67 30 #VALUE!
Mean is an average of a series which can be of both continuous and discrete in nature.
The mean is equal to all set data divided by number of values of data. On the basis of this
information, mean value of series is 40 and 26 most. Cuisine average value is 40 where as
income values have 26.67 mean. Median is another measure of central tendency which signifies
middle value of the arise series. It get vary with a frequency data of a series and thus, managers
need to take them in consideration as well properly. Mode is define as most occurring frequency
of a series. Similar group of respondents provided range to set higher values or lower value for
product. Hence, management need to take such aspect in consideration properly and effectively.
On the basis of provided information, staff need to be more trained in frame as well as sea side
location is most suitable for another chain in London. Although, there is a need to understand
that major number of aspects need to get modify in a better articulated frame so that chances of
appropriate gain get enhance which further assist in better working as well as support to increase
profit margin as well.
2.3 Analysis of data by using measure of dispersion
Ratings R1 R2 R3 R4 R5
Standard
Deviation Variances
1 45 35 7.07106781 50
6
19
2 10 10 10 20 30 8.94427191 80
3 20 40 20
11.5470053
838
133.333333
3333
4 35 45
7.07106781
19 50
5 35 35 10
14.4337567
297
208.333333
3333
6 25 15 40
12.5830573
921
158.333333
3333
7 40 40 0 0
8 42 38
2.82842712
47 8
9 40 10 30
15.2752523
165
233.333333
3333
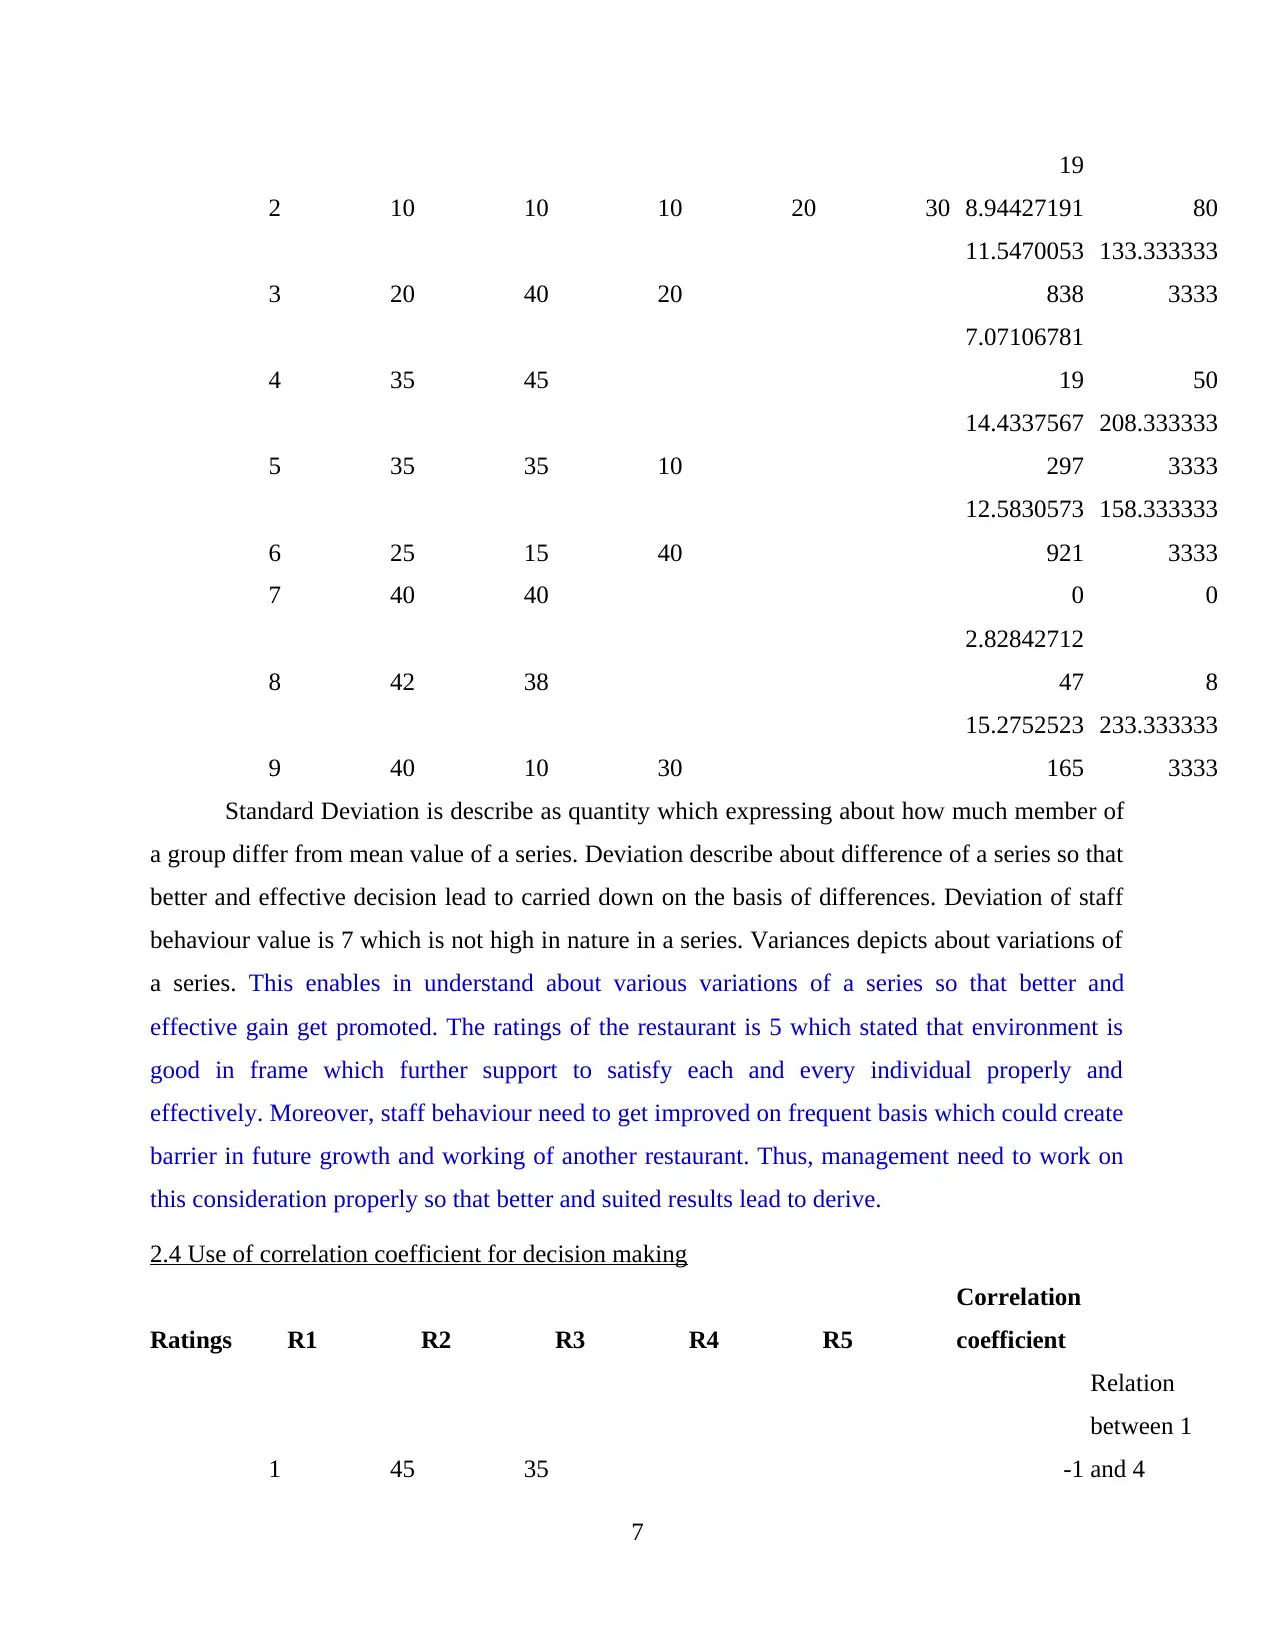
Standard Deviation is describe as quantity which expressing about how much member of
a group differ from mean value of a series. Deviation describe about difference of a series so that
better and effective decision lead to carried down on the basis of differences. Deviation of staff
behaviour value is 7 which is not high in nature in a series. Variances depicts about variations of
a series. This enables in understand about various variations of a series so that better and
effective gain get promoted. The ratings of the restaurant is 5 which stated that environment is
good in frame which further support to satisfy each and every individual properly and
effectively. Moreover, staff behaviour need to get improved on frequent basis which could create
barrier in future growth and working of another restaurant. Thus, management need to work on
this consideration properly so that better and suited results lead to derive.
2.4 Use of correlation coefficient for decision making
Ratings R1 R2 R3 R4 R5
Correlation
coefficient
1 45 35 -1
Relation
between 1
and 4
7
2 10 10 10 20 30 8.94427191 80
3 20 40 20
11.5470053
838
133.333333
3333
4 35 45
7.07106781
19 50
5 35 35 10
14.4337567
297
208.333333
3333
6 25 15 40
12.5830573
921
158.333333
3333
7 40 40 0 0
8 42 38
2.82842712
47 8
9 40 10 30
15.2752523
165
233.333333
3333
Standard Deviation is describe as quantity which expressing about how much member of
a group differ from mean value of a series. Deviation describe about difference of a series so that
better and effective decision lead to carried down on the basis of differences. Deviation of staff
behaviour value is 7 which is not high in nature in a series. Variances depicts about variations of
a series. This enables in understand about various variations of a series so that better and
effective gain get promoted. The ratings of the restaurant is 5 which stated that environment is
good in frame which further support to satisfy each and every individual properly and
effectively. Moreover, staff behaviour need to get improved on frequent basis which could create
barrier in future growth and working of another restaurant. Thus, management need to work on
this consideration properly so that better and suited results lead to derive.
2.4 Use of correlation coefficient for decision making
Ratings R1 R2 R3 R4 R5
Correlation
coefficient
1 45 35 -1
Relation
between 1
and 4
7
⊘ This is a preview!⊘
Do you want full access?
Subscribe today to unlock all pages.
Trusted by 1+ million students worldwide
2 10 10 10 20 30
3 20 40 20 0.5
Relation
between 3
and 5
4 35 45
5 35 35 10
6 25 15 40
0.56362148
02
Relation
between 6
and 9
7 40 40
8 42 38 #DIV/0!
9 40 10 30
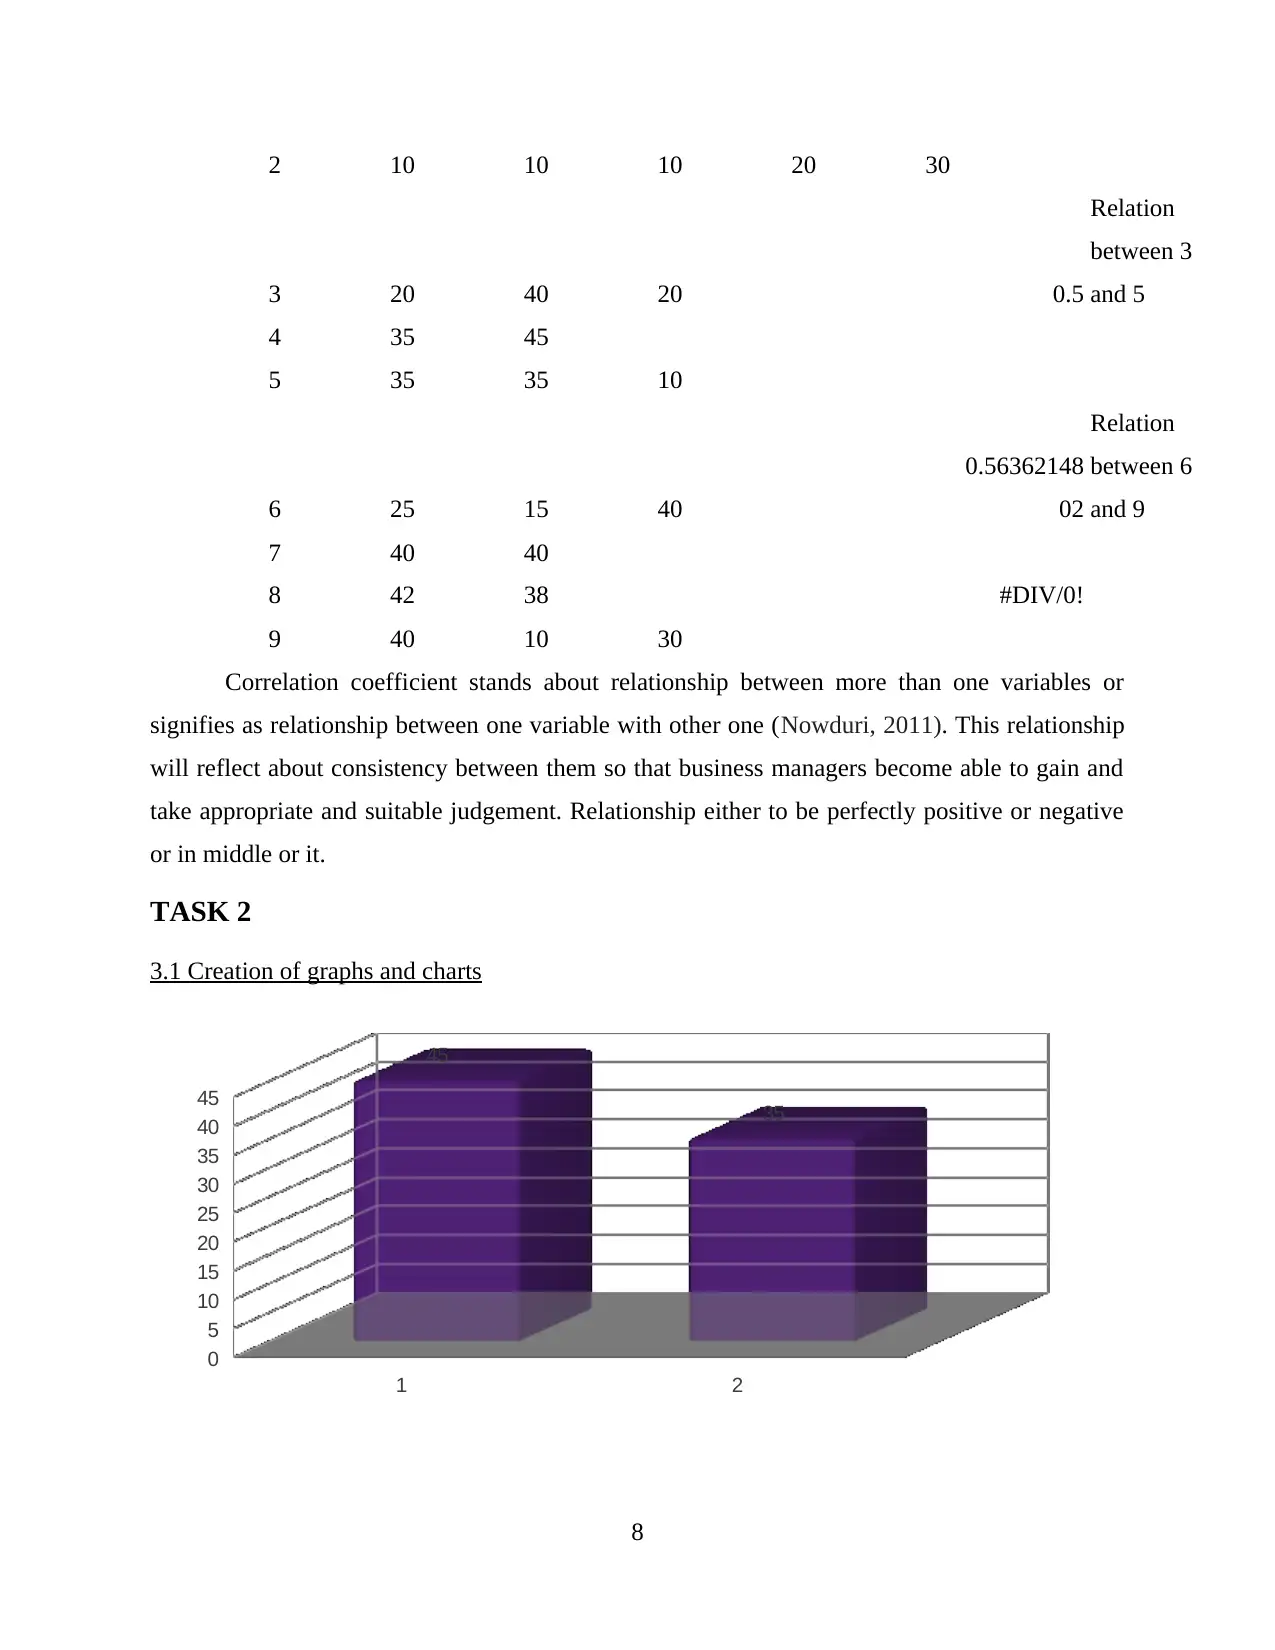
Correlation coefficient stands about relationship between more than one variables or
signifies as relationship between one variable with other one (Nowduri, 2011). This relationship
will reflect about consistency between them so that business managers become able to gain and
take appropriate and suitable judgement. Relationship either to be perfectly positive or negative
or in middle or it.
TASK 2
3.1 Creation of graphs and charts
1 2
0
5
10
15
20
25
30
35
40
45
45
35
8
3 20 40 20 0.5
Relation
between 3
and 5
4 35 45
5 35 35 10
6 25 15 40
0.56362148
02
Relation
between 6
and 9
7 40 40
8 42 38 #DIV/0!
9 40 10 30
Correlation coefficient stands about relationship between more than one variables or
signifies as relationship between one variable with other one (Nowduri, 2011). This relationship
will reflect about consistency between them so that business managers become able to gain and
take appropriate and suitable judgement. Relationship either to be perfectly positive or negative
or in middle or it.
TASK 2
3.1 Creation of graphs and charts
1 2
0
5
10
15
20
25
30
35
40
45
45
35
8
Paraphrase This Document
Need a fresh take? Get an instant paraphrase of this document with our AI Paraphraser
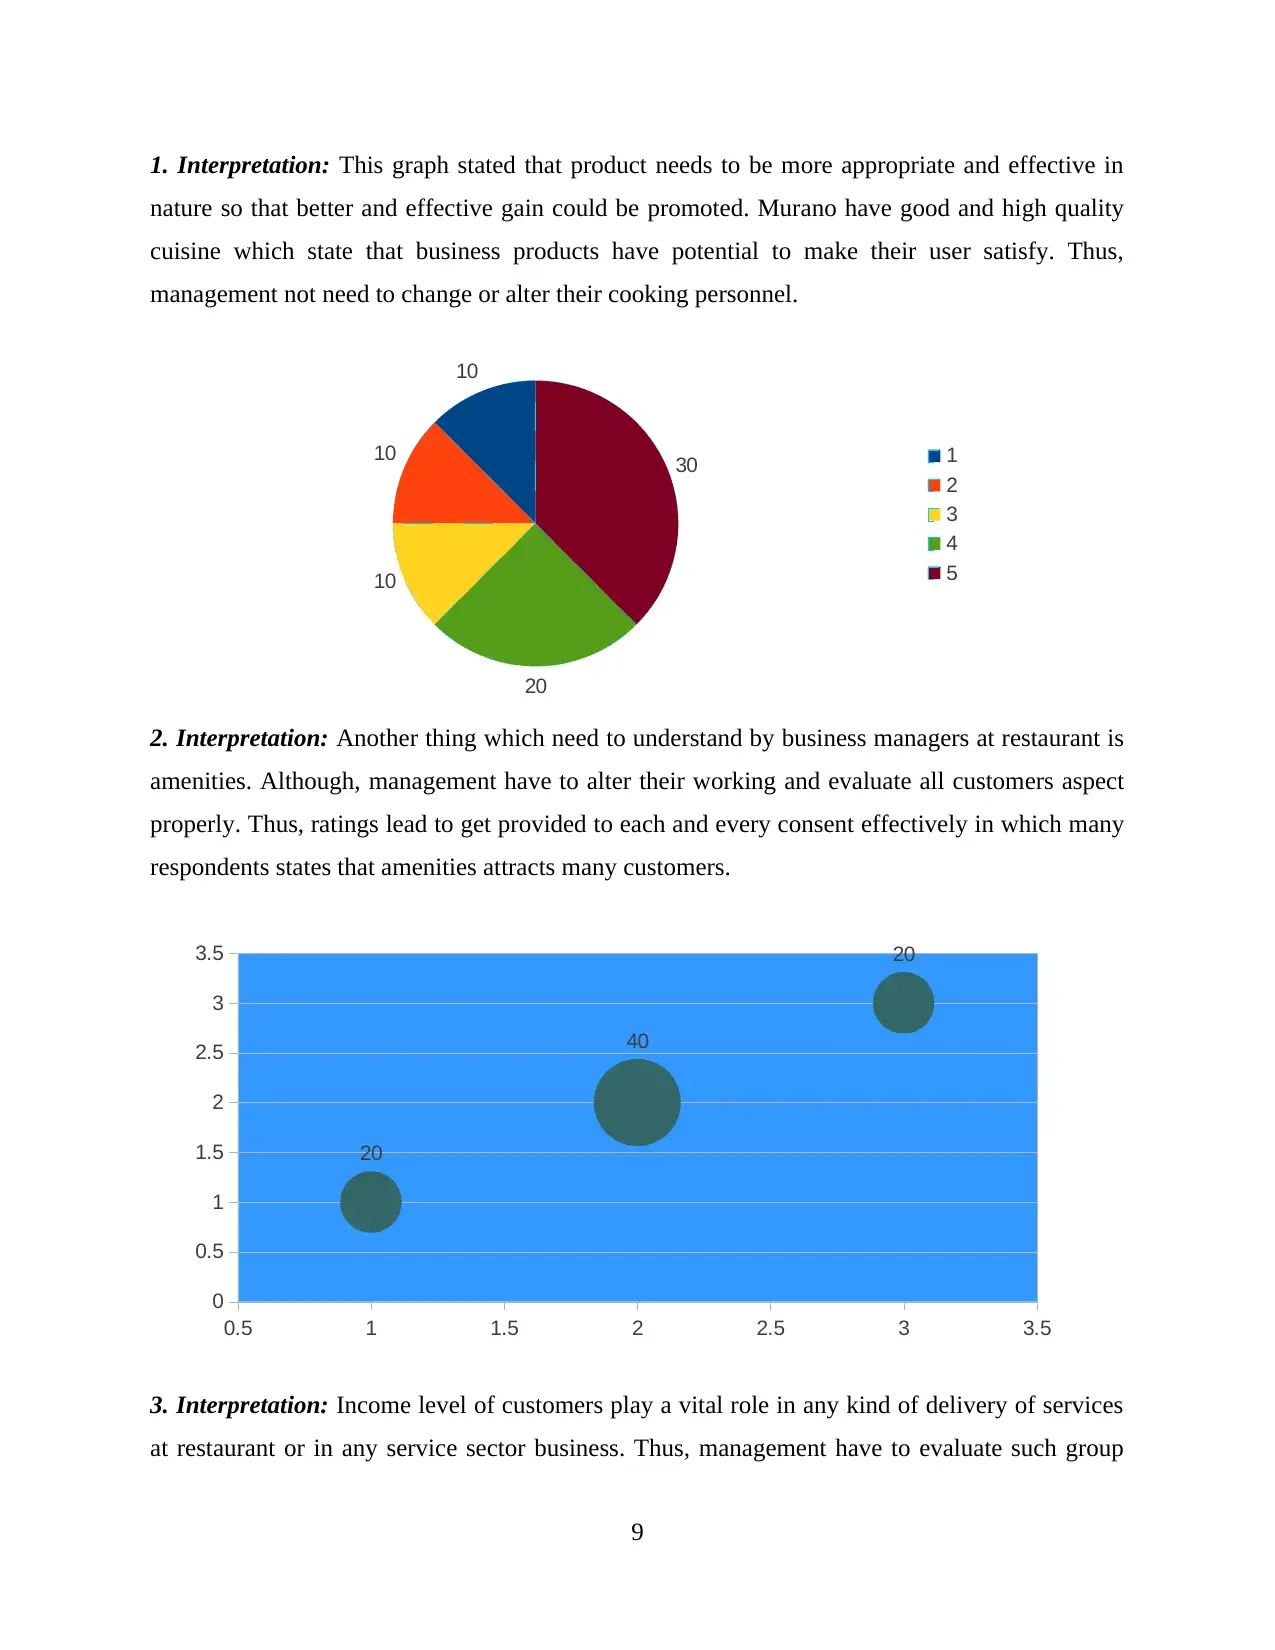
1. Interpretation: This graph stated that product needs to be more appropriate and effective in
nature so that better and effective gain could be promoted. Murano have good and high quality
cuisine which state that business products have potential to make their user satisfy. Thus,
management not need to change or alter their cooking personnel.
10
10
10
20
30 1
2
3
4
5
2. Interpretation: Another thing which need to understand by business managers at restaurant is
amenities. Although, management have to alter their working and evaluate all customers aspect
properly. Thus, ratings lead to get provided to each and every consent effectively in which many
respondents states that amenities attracts many customers.
0.5 1 1.5 2 2.5 3 3.5
0
0.5
1
1.5
2
2.5
3
3.5
20
40
20
3. Interpretation: Income level of customers play a vital role in any kind of delivery of services
at restaurant or in any service sector business. Thus, management have to evaluate such group
9
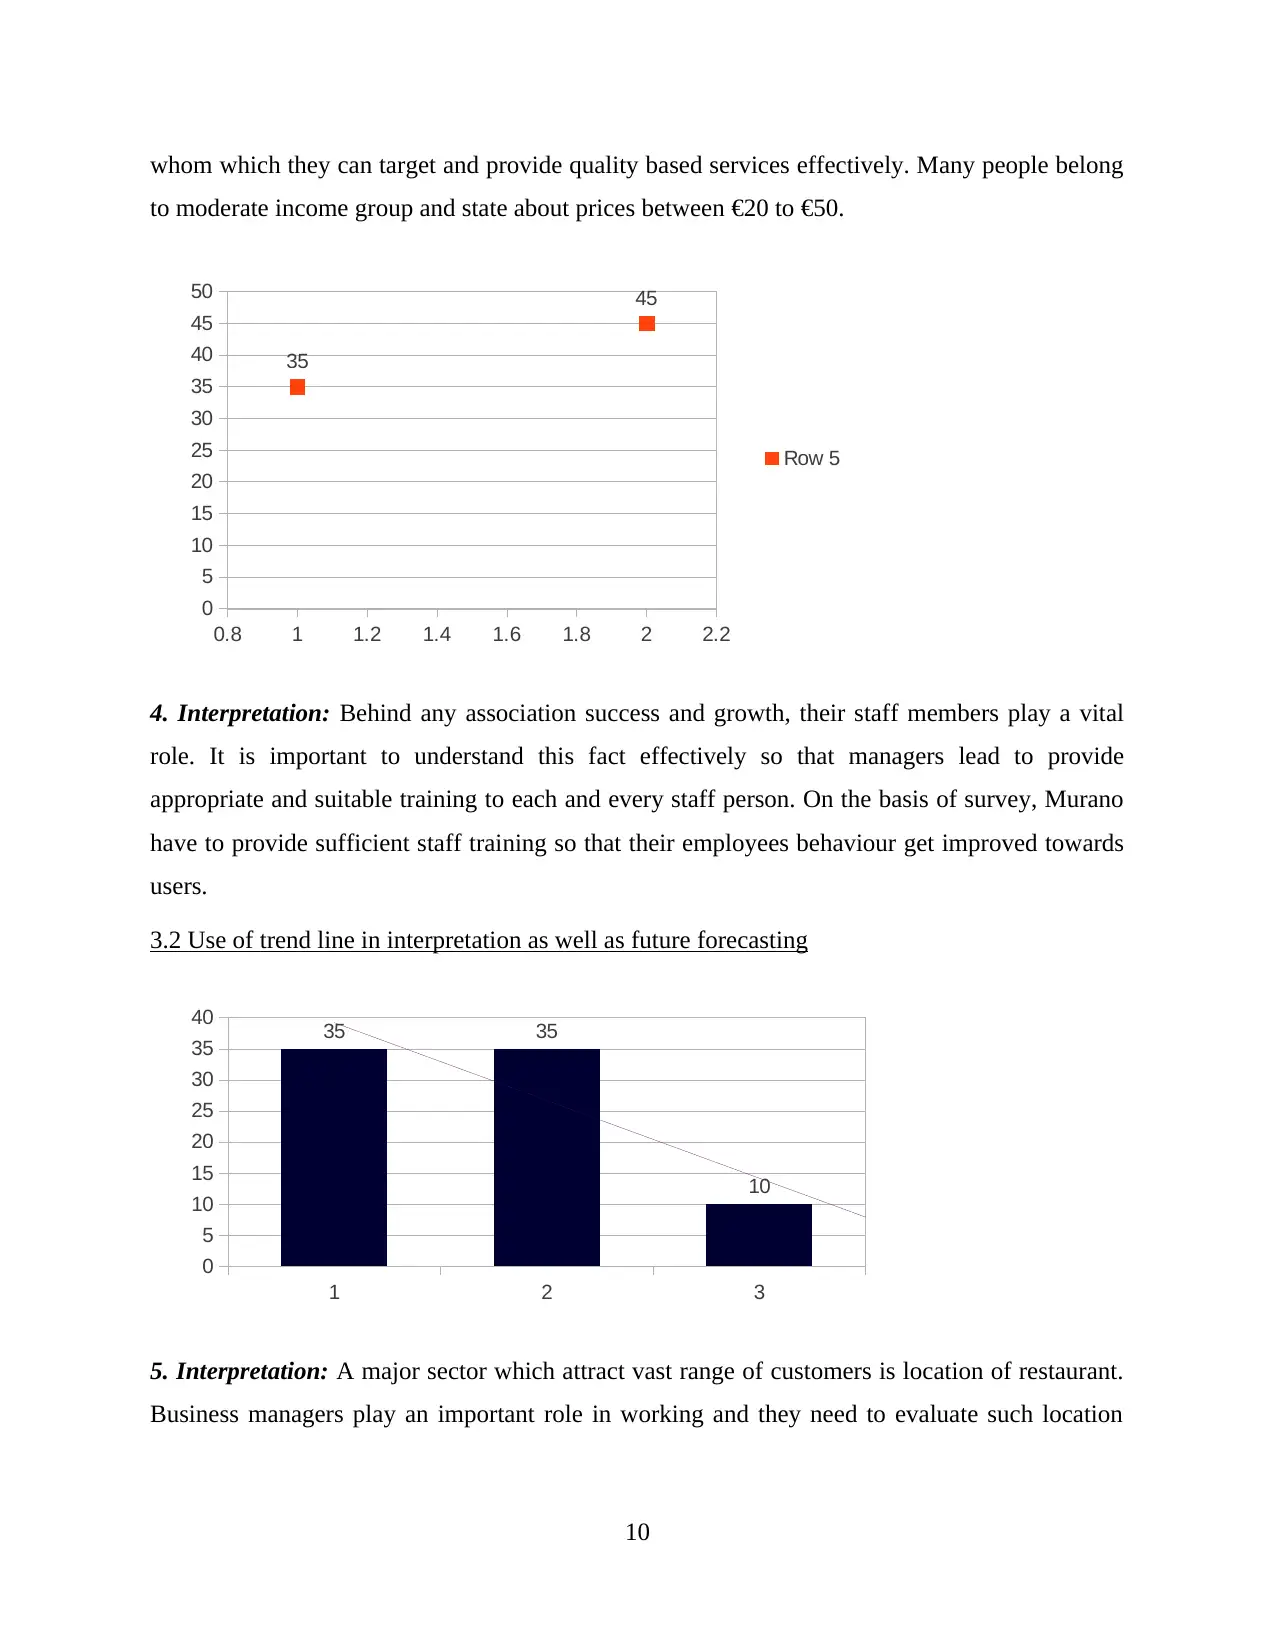
whom which they can target and provide quality based services effectively. Many people belong
to moderate income group and state about prices between €20 to €50.
0.8 1 1.2 1.4 1.6 1.8 2 2.2
0
5
10
15
20
25
30
35
40
45
50
35
45
Row 5
4. Interpretation: Behind any association success and growth, their staff members play a vital
role. It is important to understand this fact effectively so that managers lead to provide
appropriate and suitable training to each and every staff person. On the basis of survey, Murano
have to provide sufficient staff training so that their employees behaviour get improved towards
users.
3.2 Use of trend line in interpretation as well as future forecasting
1 2 3
0
5
10
15
20
25
30
35
40 35 35
10
5. Interpretation: A major sector which attract vast range of customers is location of restaurant.
Business managers play an important role in working and they need to evaluate such location
10
⊘ This is a preview!⊘
Do you want full access?
Subscribe today to unlock all pages.
Trusted by 1+ million students worldwide
1 out of 21
Related Documents


Your All-in-One AI-Powered Toolkit for Academic Success.
+13062052269
info@desklib.com
Available 24*7 on WhatsApp / Email
![[object Object]](/_next/static/media/star-bottom.7253800d.svg)
Unlock your academic potential
Copyright © 2020–2026 A2Z Services. All Rights Reserved. Developed and managed by ZUCOL.