Analyzing Market Research & Financial Data for Business Decisions

Verified

Added on  2023/04/23

|8
|476
|421
Report
AI Summary
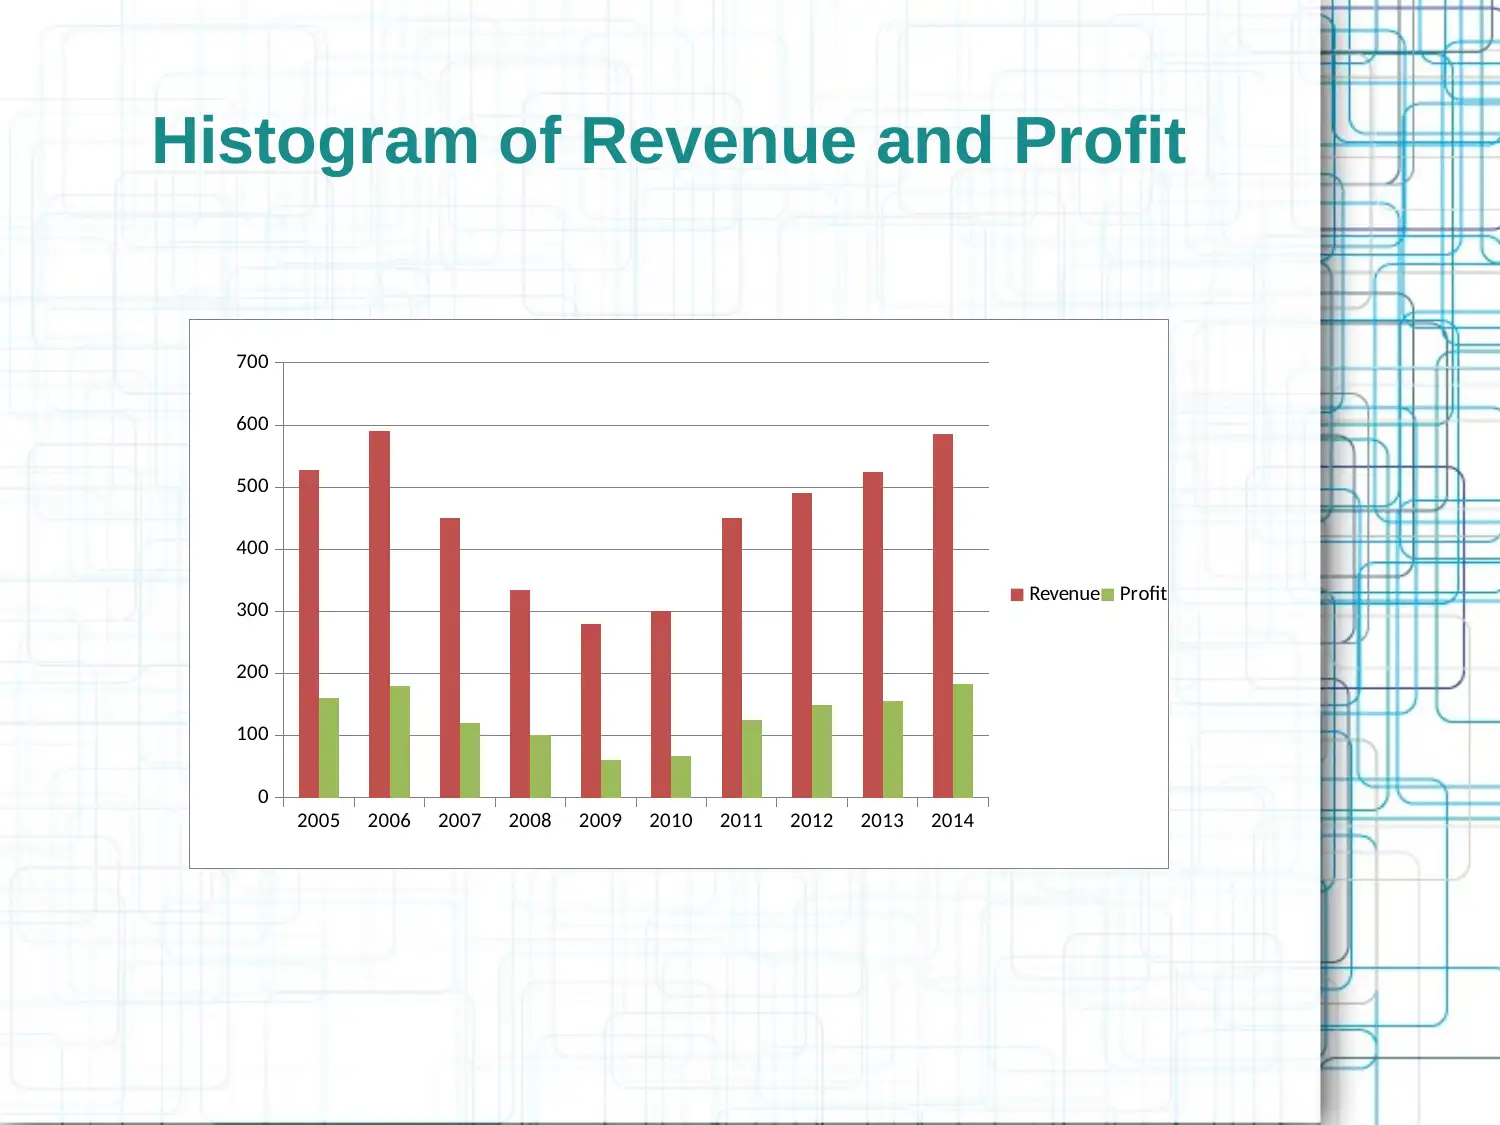
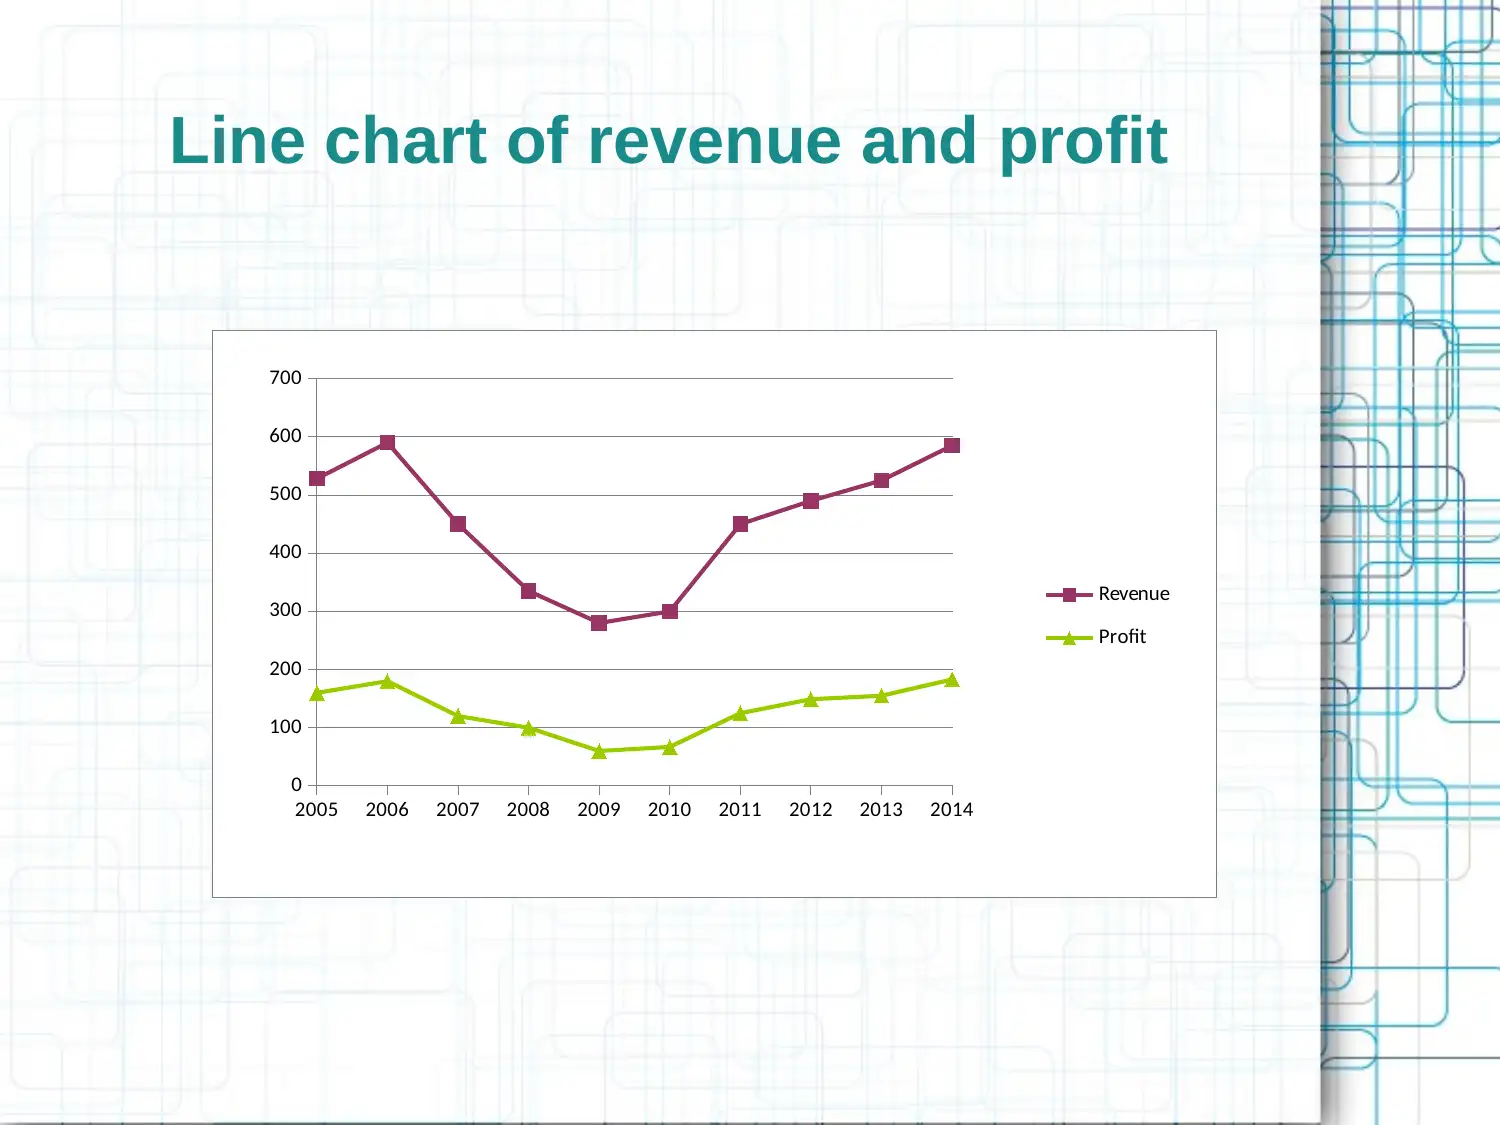
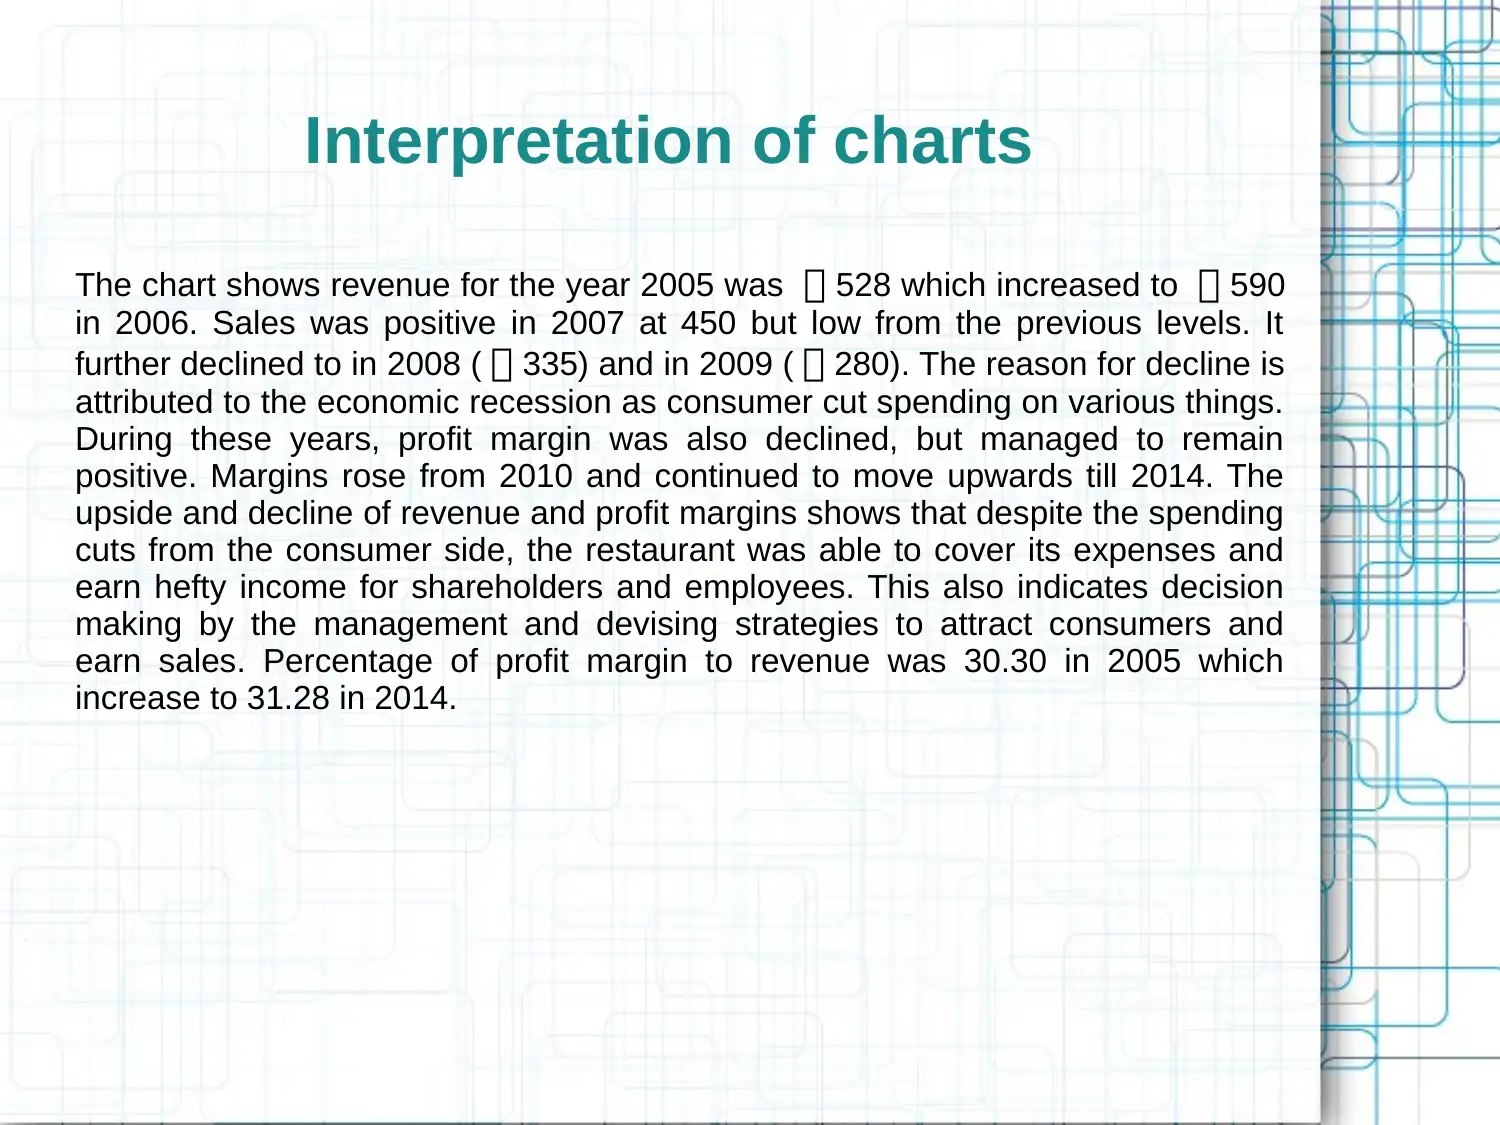
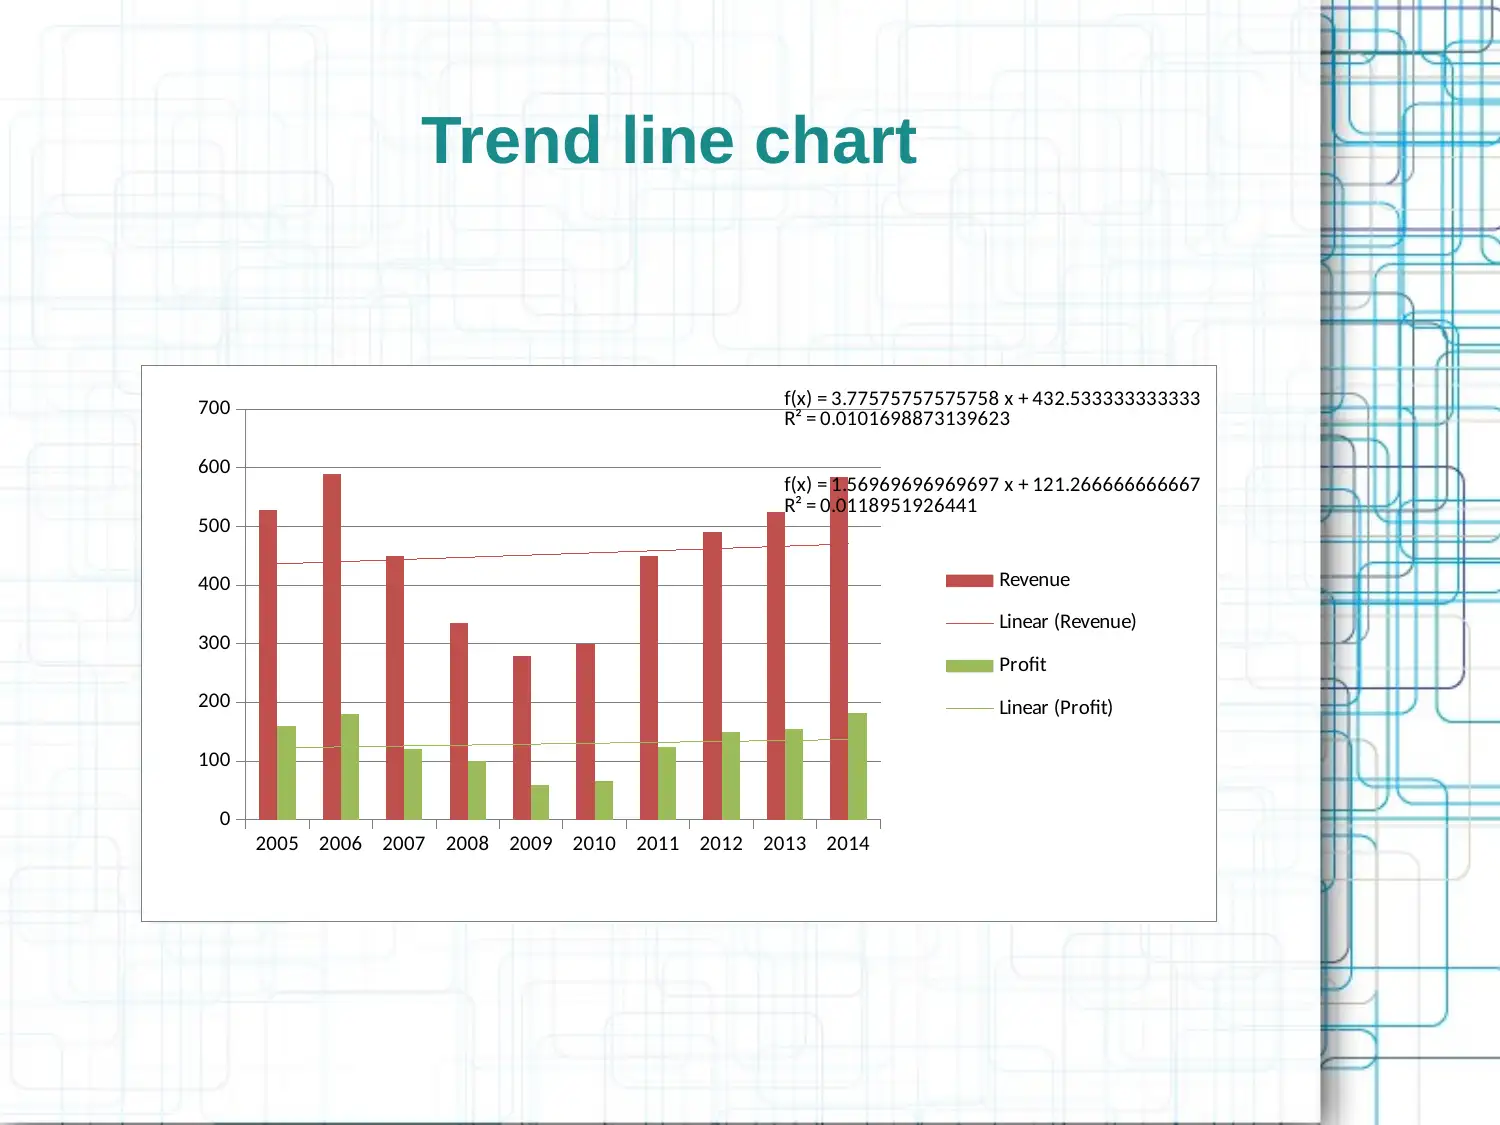
This report analyzes business decision-making through market research and financial analysis, focusing on a restaurant's performance from 2005 to 2014. It utilizes primary data from questionnaire surveys and secondary data from online sources to assess revenue and profit trends. The analysis includes histograms and line charts illustrating the restaurant's financial performance, noting fluctuations attributed to economic conditions. Despite economic challenges, the restaurant maintained positive profit margins, indicating effective management strategies. Trend line charts and R-squared values highlight revenue and profit volatility, with a forecast suggesting potential for higher margins in coming years. The report concludes that the restaurant's ability to sustain profitability underscores its resilience and strategic decision-making capabilities. Desklib provides similar solved assignments and study resources for students.
Document Page
Business Decision Making
tabler-icon-diamond-filled.svg

Paraphrase This Document

Need a fresh take? Get an instant paraphrase of this document with our AI Paraphraser
Document Page
Market research
Collection of information
Primary – questionnaire survey
Secondary – online websites, books,
journals
Analysis – Qualitative basis
Document Page
Histogram of Revenue and Profit
2005 2006 2007 2008 2009 2010 2011 2012 2013 2014
0
100
200
300
400
500
600
700
Revenue Profit
Document Page
Line chart of revenue and profit
2005 2006 2007 2008 2009 2010 2011 2012 2013 2014
0
100
200
300
400
500
600
700
Revenue
Profit
tabler-icon-diamond-filled.svg

Paraphrase This Document

Need a fresh take? Get an instant paraphrase of this document with our AI Paraphraser
Document Page
Interpretation of charts
The chart shows revenue for the year 2005 was 528 which increased to 590
in 2006. Sales was positive in 2007 at 450 but low from the previous levels. It
further declined to in 2008 ( 335) and in 2009 ( 280). The reason for decline is
attributed to the economic recession as consumer cut spending on various things.
During these years, profit margin was also declined, but managed to remain
positive. Margins rose from 2010 and continued to move upwards till 2014. The
upside and decline of revenue and profit margins shows that despite the spending
cuts from the consumer side, the restaurant was able to cover its expenses and
earn hefty income for shareholders and employees. This also indicates decision
making by the management and devising strategies to attract consumers and
earn sales. Percentage of profit margin to revenue was 30.30 in 2005 which
increase to 31.28 in 2014.
Document Page
Trend line chart
2005 2006 2007 2008 2009 2010 2011 2012 2013 2014
0
100
200
300
400
500
600
700 f(x) = 3.77575757575758 x + 432.533333333333
R² = 0.0101698873139623
f(x) = 1.56969696969697 x + 121.266666666667
R² = 0.0118951926441
Revenue
Linear (Revenue)
Profit
Linear (Profit)
Document Page
Forecasting
It can be seen from the above chart that R square value stands at 0.01 for both
the variables. This indicates extreme fluctuations in the values in the last 10
years. This fluctuation can be understood in the sense that business was able to
earn increasing revenue and profit in the first two years, then margins declined in
the next six years. With the improvements in the economic conditions, the
business was able to earn margins compared with the first year basis. An
important thing identified in the financial performance is that margins did not fell
into negative state in any of the years. Somehow the restaurant managed to earn
profits after meeting all expenses. Keeping in mind these performance levels, it
can be said that restaurant has the capability to earn higher margins in the
coming years. From the financial data, the sales and profit improved in 2010 and
continued to increase since then.
tabler-icon-diamond-filled.svg

Paraphrase This Document

Need a fresh take? Get an instant paraphrase of this document with our AI Paraphraser
Document Page
Thank You
chevron_up_icon
1 out of 8
circle_padding
hide_on_mobile
zoom_out_icon
[object Object]