Business Decision Making Report

Verified

Added on  2019/12/03

|29
|4077
|41
Report
AI Summary
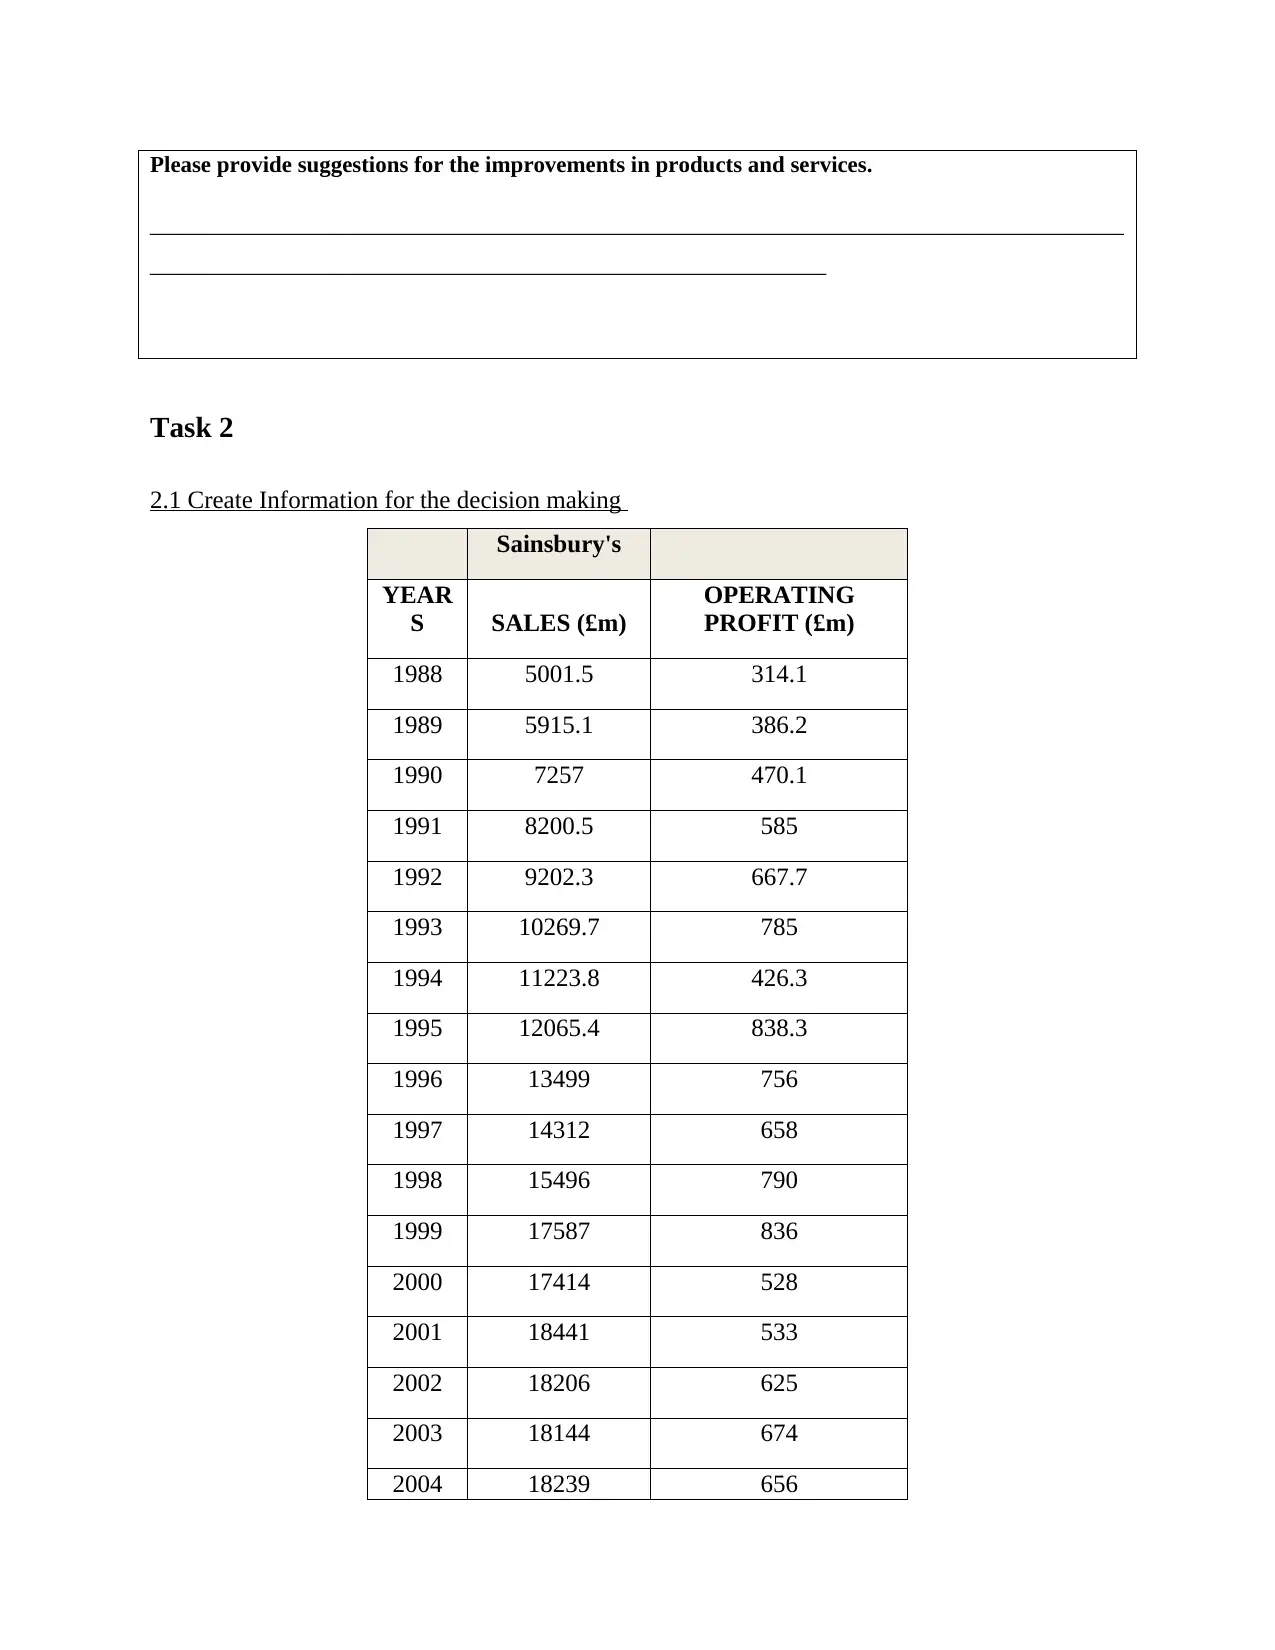
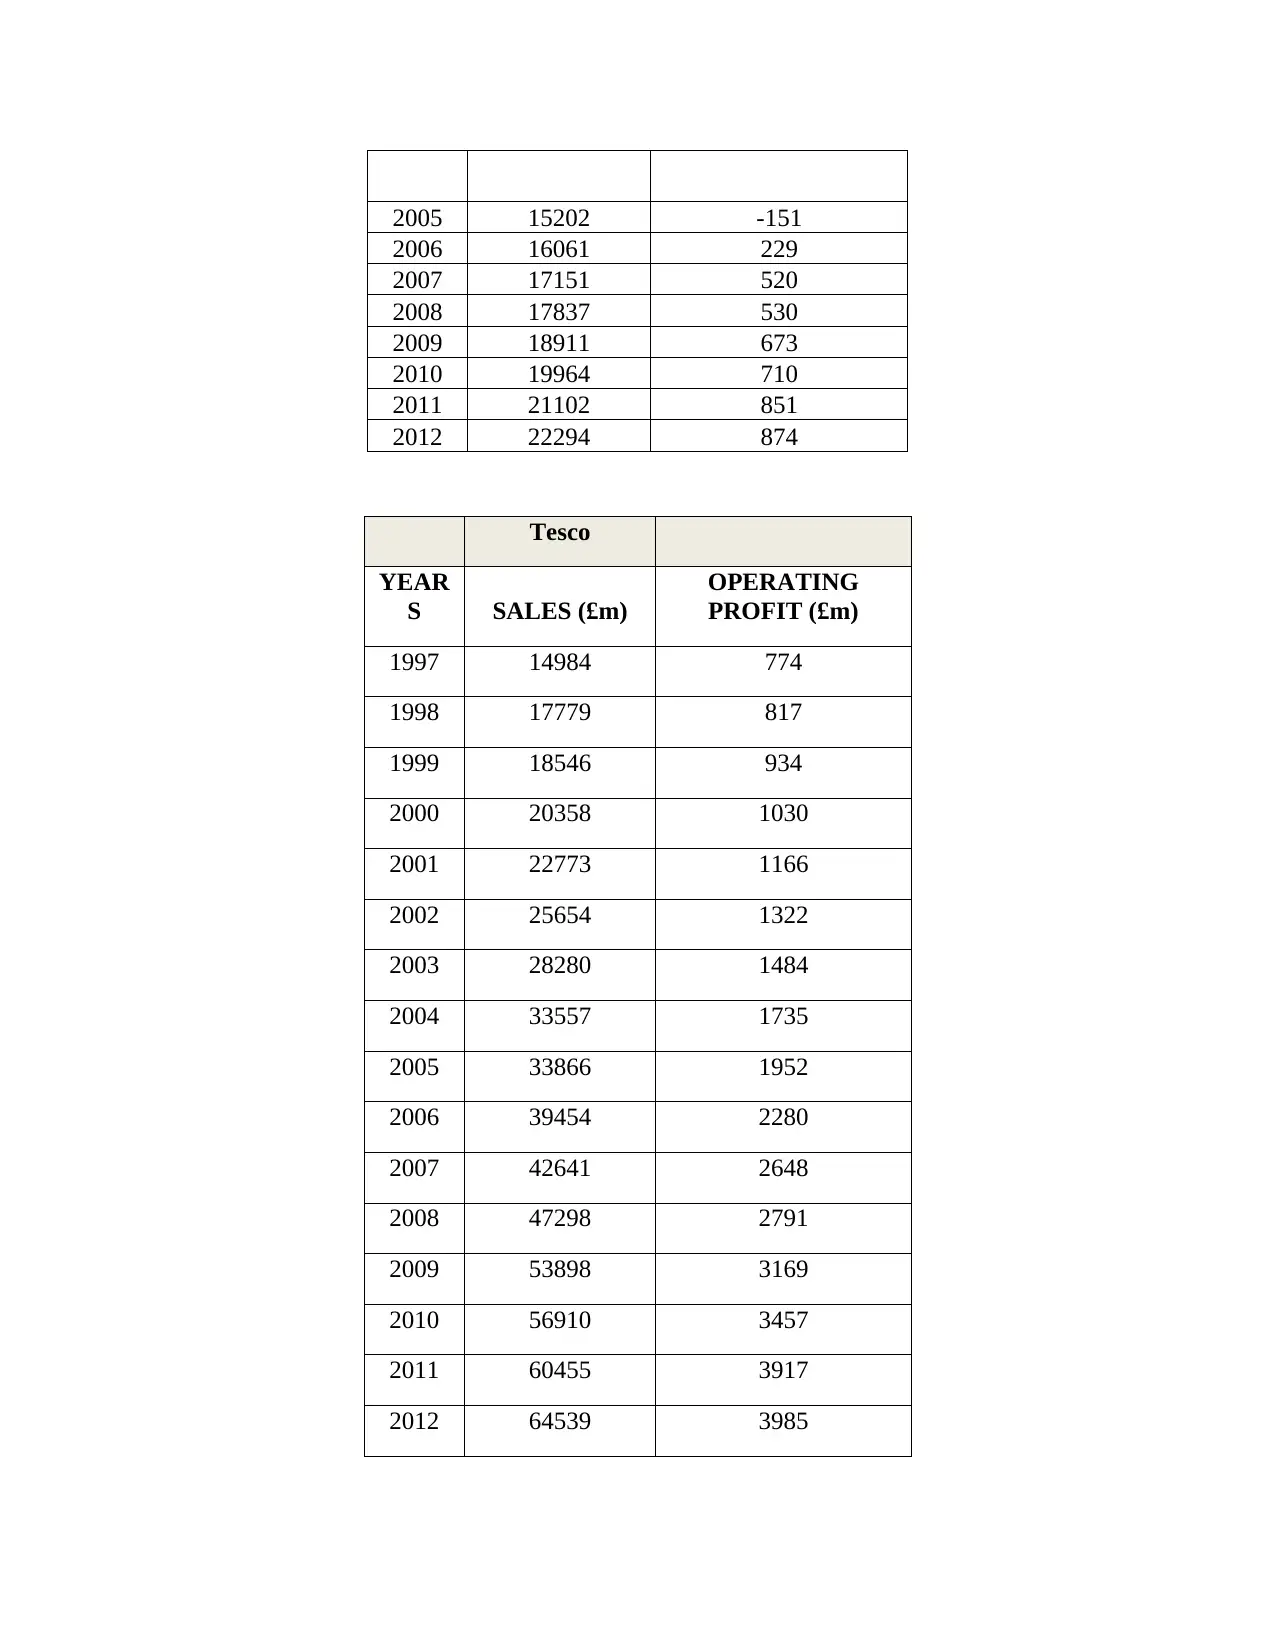
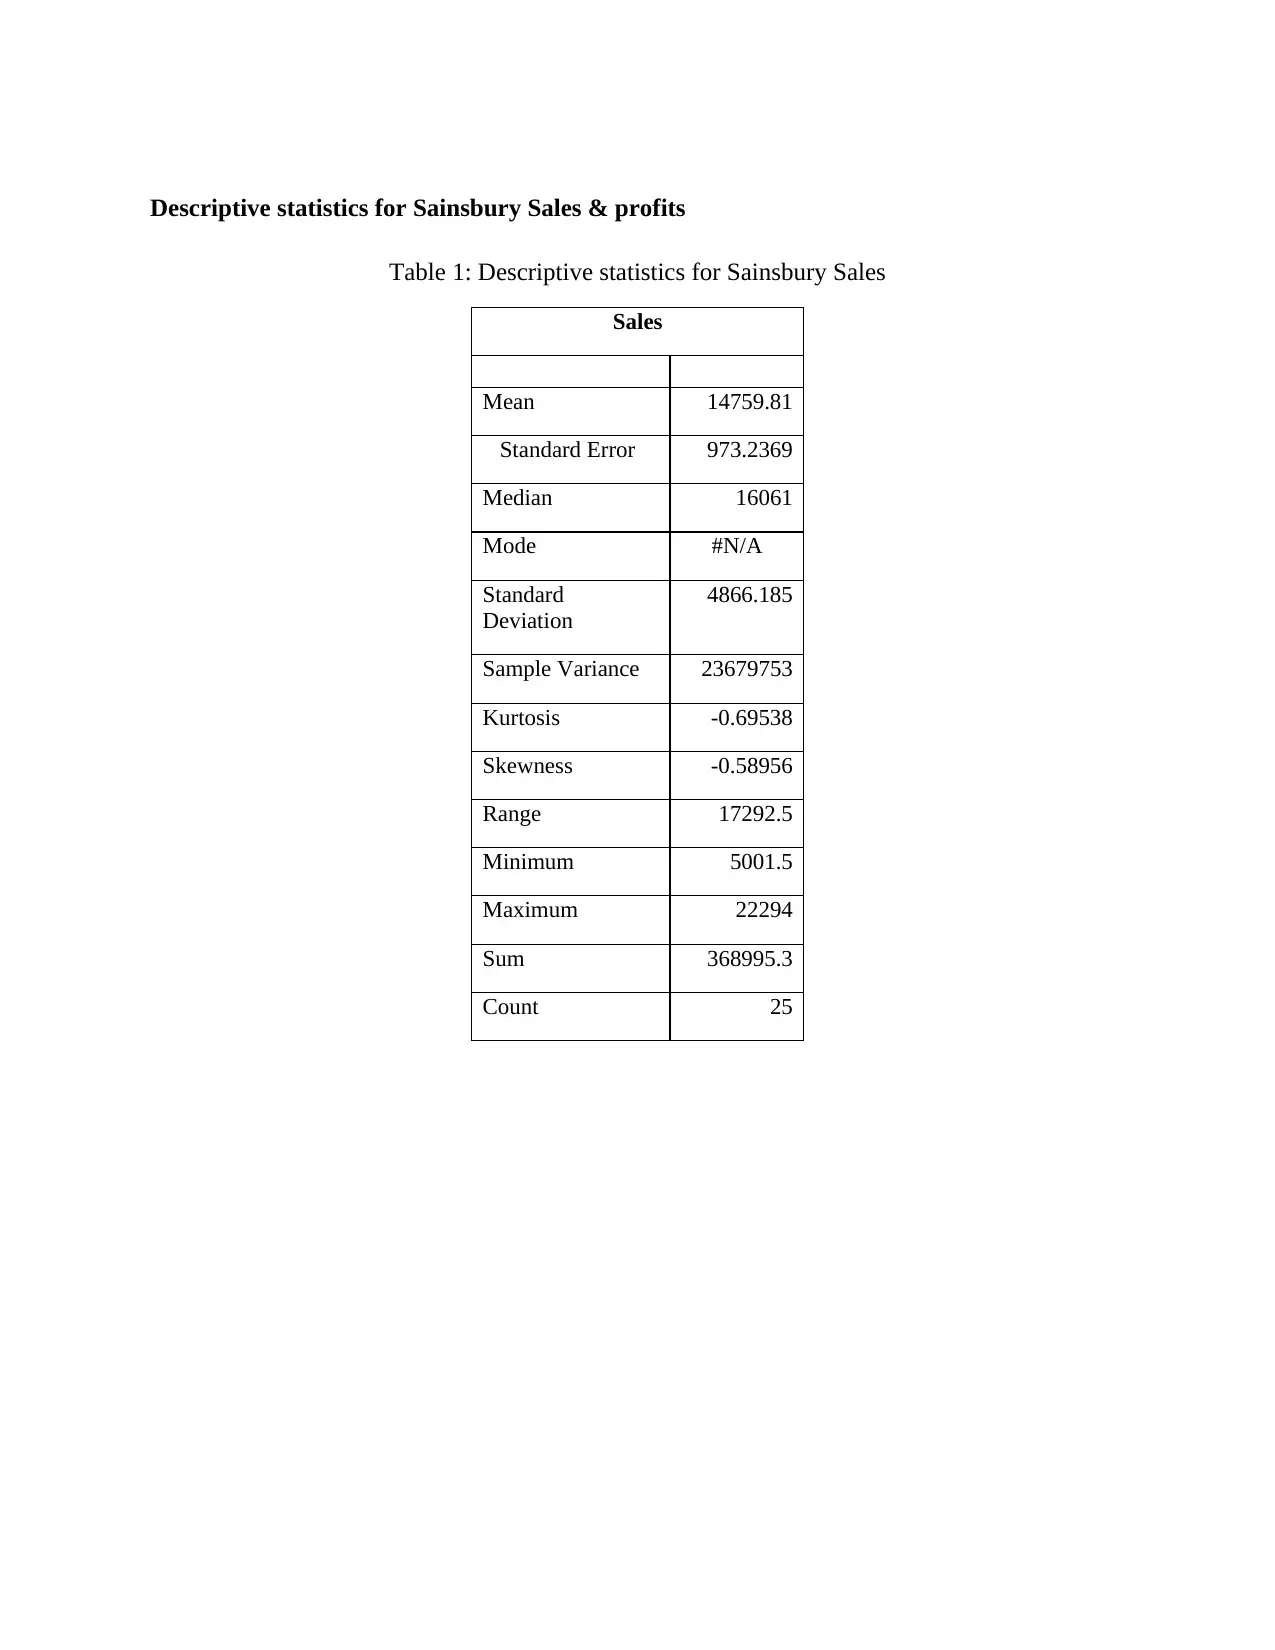
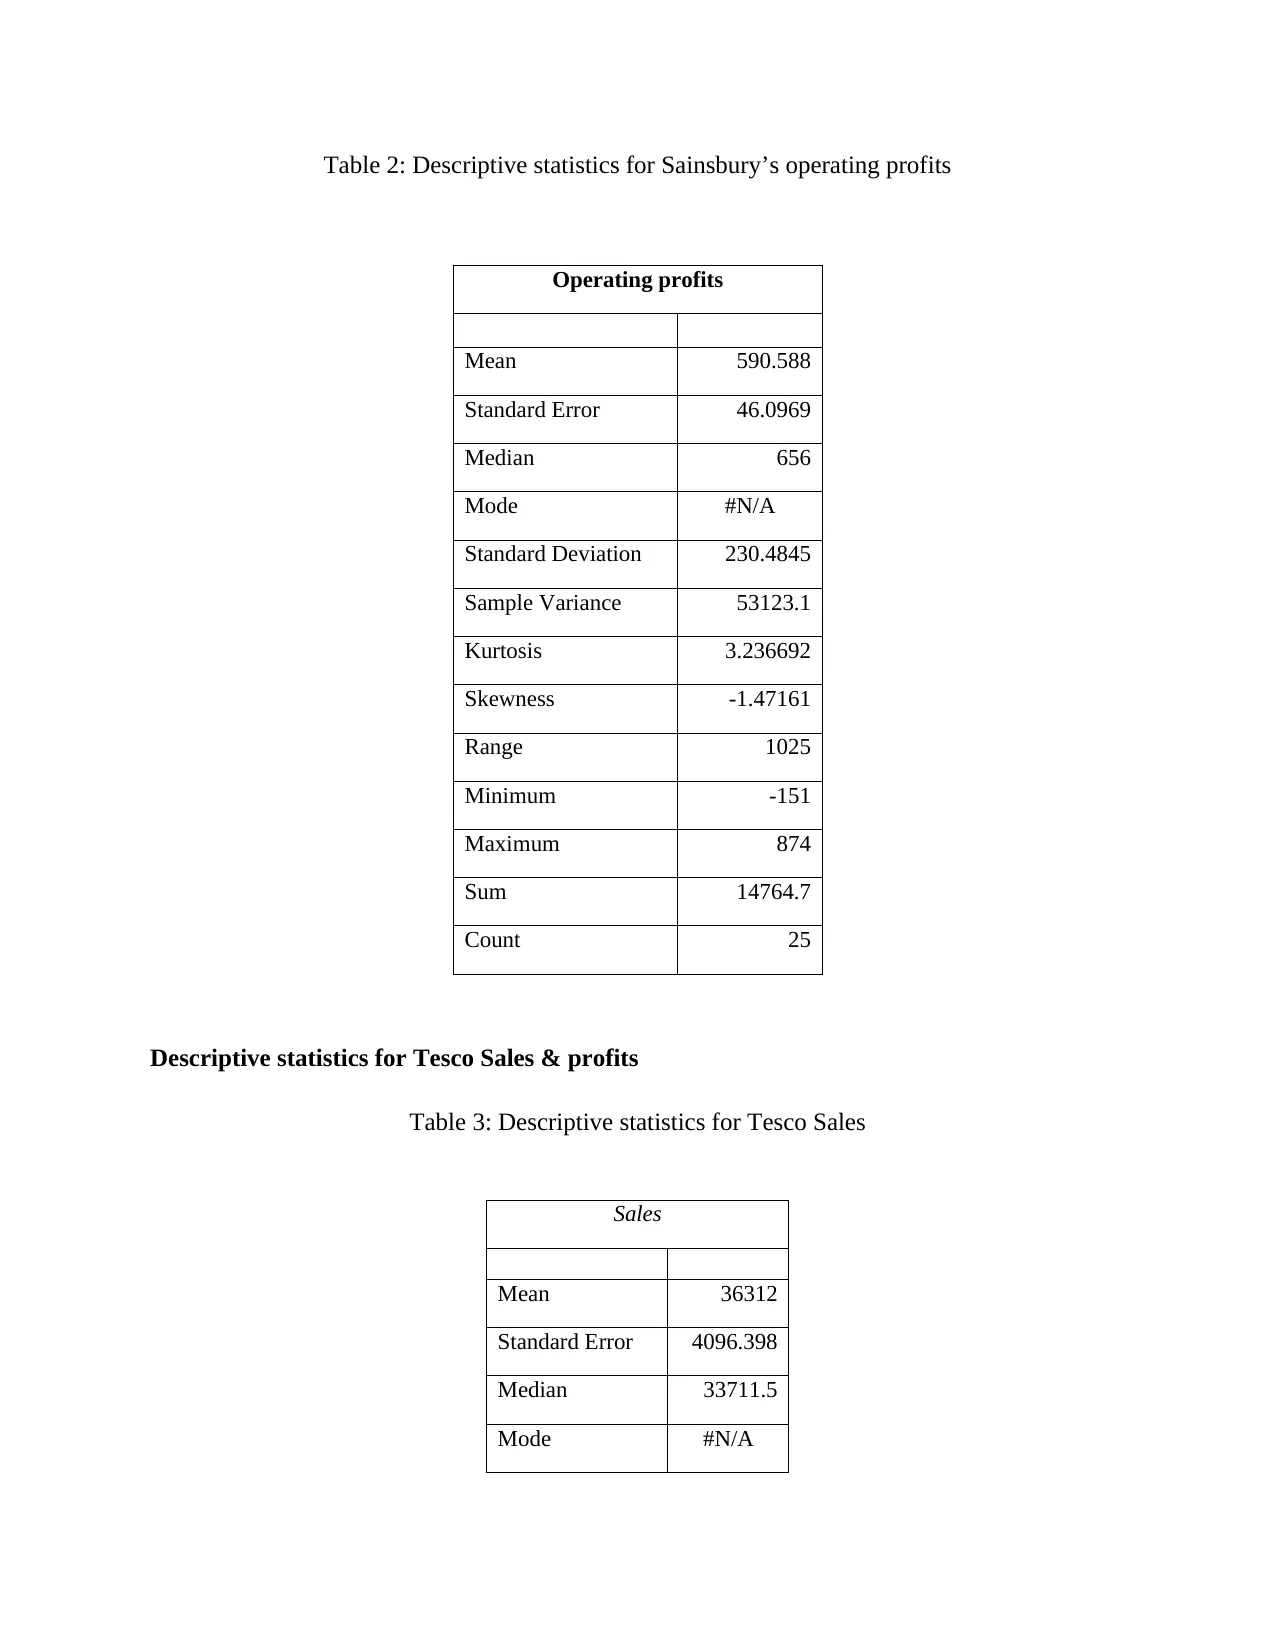
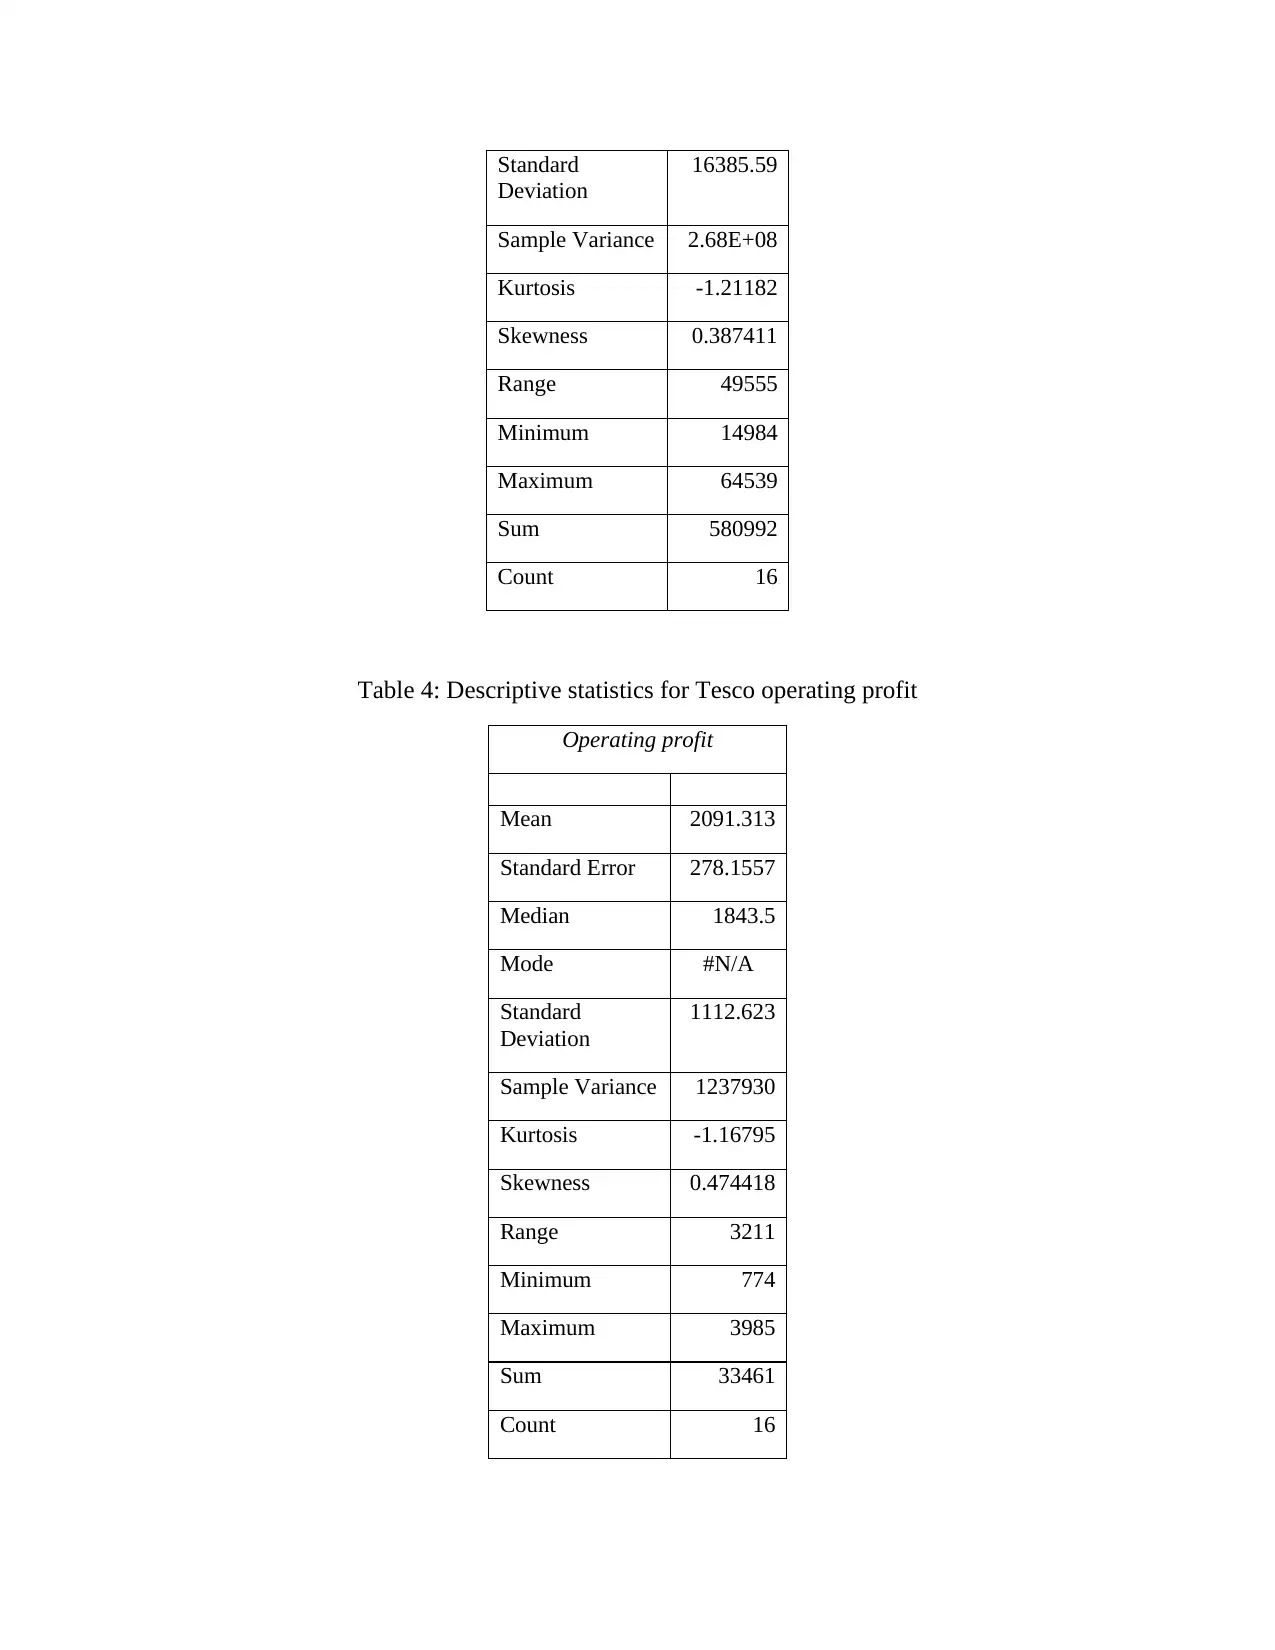
This report analyzes the business performance of Sainsbury's and Tesco using a combination of primary and secondary data. Primary data was collected through a customer survey using a questionnaire, while secondary data was obtained from financial statements. The report employs various statistical techniques, including descriptive statistics, correlation analysis, quartile calculations, and measures of dispersion, to compare the sales and operating profits of both companies. Data visualization through graphs and trend lines is also used to illustrate the findings. The analysis reveals that Tesco has a stronger financial position than Sainsbury's, exhibiting higher sales and operating profits and a stronger correlation between sales and profits. The report also includes a project plan with a network diagram and Gantt chart, and a financial analysis using Net Present Value (NPV) and Internal Rate of Return (IRR) to evaluate two hypothetical investment projects. The conclusion emphasizes the importance of proper information processing and the use of statistical tools for effective business decision-making.
Document Page
BUSINESS DECISION
MAKING
tabler-icon-diamond-filled.svg

Paraphrase This Document

Need a fresh take? Get an instant paraphrase of this document with our AI Paraphraser
Document Page
TABLE OF CONTENTS
Introduction......................................................................................................................................4
Task 1...............................................................................................................................................4
1.1 Collection of primary and secondary data.............................................................................4
1.2 Survey Methodology.............................................................................................................4
1.3 Questionnaire.........................................................................................................................5
Task 2...............................................................................................................................................7
2.1 Create Information for the decision making..........................................................................7
2.2 Analyze the results...............................................................................................................12
2.3 Measures of Dispersion.......................................................................................................13
2.4 Quartiles, percentiles and Correlation.................................................................................13
Task 3.............................................................................................................................................14
3.1 Graphs through spreadsheets...............................................................................................14
3.2 Trend line through spread sheet...........................................................................................20
3.4 Formal Business Report.......................................................................................................22
Task 4.............................................................................................................................................23
4.1 Use of appropriate information processing tools.................................................................23
4.2 Preparation of project Plan..................................................................................................23
4.3 Use of financial tools...........................................................................................................25
Conclusion.....................................................................................................................................28
References......................................................................................................................................29
Document Page
LIST OF TABLES
Table 1: Descriptive statistics for Sainsbury Sales..........................................................................9
Table 2: Descriptive statistics for Sainsbury’s operating profits...................................................10
Table 3: Descriptive statistics for Tesco Sales..............................................................................11
Table 4: Descriptive statistics for Tesco operating profit..............................................................11
Table 5: Computation of quartile and percentile of Sainsbury......................................................13
Table 6: Table 4: Computation of quartile and percentile of Tesco..............................................13
Table 7: Correlation Coefficient for Sales- Sainsbury..................................................................14
Table 8: Correlation Coefficient for Sales- Tesco.........................................................................14
Table 9: Frequency distribution of sales - Sainsbury....................................................................16
Table 10: Frequency distribution of operating profit Sainsbury...................................................17
Table 11: Frequency distribution table for sales Tesco.................................................................19
Table 12: Frequency distribution table for operating profit..........................................................19
Table 13: Activities of Network Diagram.....................................................................................23
Table 14: Time Schedule...............................................................................................................23
Table 15: NPV for project A.........................................................................................................26
Table 16: NPV for project B..........................................................................................................26
Table 17: IRR calculation of project A and B...............................................................................28
LIST OF FIGURES
Figure 1 Network Diagram............................................................................................................24
Figure 2: Gantt chart......................................................................................................................25
Document Page
Introduction
Business decision making is a complex process. The purpose of this research report is to
understand a range of techniques for the purpose of analyzing the data effectively. It will shows
how software generated information can be used to make decisions.
Task 1
1.1 Collection of primary and secondary data
Primary Data – Primary data is the first hand information that is available for use. The
data related to Sainsbury will be collected from customers by using the approach of
questionnaire. It is fresh and raw in nature. A semi-structured questionnaire will be
prepared which will be consist of open ended and close ended questions (Aksoy, Ozturk
and Sucky, 2012). This technique is appropriate because it helps in collecting the relevant
and accurate information.
Secondary Data – It is the second hand information that is available from sources such as
books, journals, newspapers etc. For this research, secondary data will be compiled from
financial statements of Sainsbury and Tesco. All sources of information will be valid and
authentic (Freedman, Pisani and Purves, 2007).
Following research questions have been addressed:
What is the level of satisfaction amongst Sainsbury’s customers?
What has been the relationship between operating profit and sales for Sainsbury over the
last 25 years?
Series of logical steps for data collection
Preparing questionnaire
Applying sampling technique
Collecting responses
Filtering the information
Selecting the right questionnaires
Data evaluation
tabler-icon-diamond-filled.svg

Paraphrase This Document

Need a fresh take? Get an instant paraphrase of this document with our AI Paraphraser
Document Page
Quantitative data
In order to evaluate the quantitative data, sales and operating profits of the Sainsbury
have been collected (Hedgebeth, 2007). For the purpose of evaluation descriptive statistics have
been used. Measures like correlation, quartile and range have been used for quantitative analysis.
Sampling
Sampling is performed to identify the representative sample from which the primary data
can be collected. For this study, data will be collected by applying the combination of purposive
and convenience sampling (Freedman, Pisani and Purves, 2007). These are appropriate because
they help in selecting the sample on the basis of the requirements and judgment.
Population and Sample size
A sample size of 50 respondents have been kept for this research. It is appropriate
because the research is of descriptive nature.
1.2 Survey Methodology
Survey methodology defines the framework under which the research is to be carried out.
Under survey methodology, questionnaire approach will be used. A set of questionnaire will be
distributed among the customers of Sainsbury. This will help in understanding their perception
towards company’s goods and services (Jaisankar, 2009). It will consist of open ended and close
ended questions. The approach will help in collecting a large volume of data from the mass
population.
Sampling is an activity which is designed to identify the representative sample of
population from which the desired information is to be collected. The data collection task
becomes simpler and easier because of sampling. There are two types of sampling methods
which includes probability and non- probability techniques (Newbold and et. al., 2009). For this
research, respondents will be selected through random sampling outside the stores of Sainsbury.
It is appropriate for the study because it selects the sample by avoiding personal biasness.
There are some ethical issues which are to be considered while course of research. The
goals and objectives of study will be properly communicated to the participants before starting
the survey process (Hedgebeth, 2007). Their identity will not be disclosed without their prior
Document Page
approval. The entire secondary data will be collected from valid and authentic sources. Complete
information will be kept in a private and confidential manner.
1.3 Questionnaire
Questionnaire for Sainsbury
The purpose of this questionnaire is to know your opinion about company’s products and services
Name:
Address:
Email address :
Contact number:
Age
14 – 22years
22– 28years
28 – 35 years
35 years and above
Gender
Male
Female
From how many years you have been purchasing the products from Sainsbury?
Less than 1year
1 to 5years
5 to 10 years
More than 10 years
Are you satisfied with the products and services of Sainsbury?
Strongly dissatisfied
Dissatisfied
Satisfied
Strongly satisfied
Document Page
Which of the factors influence you the most while buying products from Sainsbury?
Price
Quality
Packaging
Discount
Promotion
Staff behaviour
Location of stores
How do you rate the behaviour of staff at Sainsbury?
Poor
Bad
Average
Good
Excellent
Do you agree that Sainsbury’s products and services are better than other retailers?
Strongly agree
Agree
Neutral
Strongly Agree
Strongly Disagree
Do you agree that prices of Sainsbury’s products matches with your level of income?
Strongly agree
Agree
Neutral
Strongly Agree
Strongly Disagree
Do you think improvements are needed in the services of Sainsbury?
Yes
No
tabler-icon-diamond-filled.svg

Paraphrase This Document

Need a fresh take? Get an instant paraphrase of this document with our AI Paraphraser
Document Page
Please provide suggestions for the improvements in products and services.
_____________________________________________________________________________________
___________________________________________________________
Task 2
2.1 Create Information for the decision making
Sainsbury's
YEAR
S SALES (£m)
OPERATING
PROFIT (£m)
1988 5001.5 314.1
1989 5915.1 386.2
1990 7257 470.1
1991 8200.5 585
1992 9202.3 667.7
1993 10269.7 785
1994 11223.8 426.3
1995 12065.4 838.3
1996 13499 756
1997 14312 658
1998 15496 790
1999 17587 836
2000 17414 528
2001 18441 533
2002 18206 625
2003 18144 674
2004 18239 656
Document Page
2005 15202 -151
2006 16061 229
2007 17151 520
2008 17837 530
2009 18911 673
2010 19964 710
2011 21102 851
2012 22294 874
Tesco
YEAR
S SALES (£m)
OPERATING
PROFIT (£m)
1997 14984 774
1998 17779 817
1999 18546 934
2000 20358 1030
2001 22773 1166
2002 25654 1322
2003 28280 1484
2004 33557 1735
2005 33866 1952
2006 39454 2280
2007 42641 2648
2008 47298 2791
2009 53898 3169
2010 56910 3457
2011 60455 3917
2012 64539 3985
Document Page
Descriptive statistics for Sainsbury Sales & profits
Table 1: Descriptive statistics for Sainsbury Sales
Sales
Mean 14759.81
Standard Error 973.2369
Median 16061
Mode #N/A
Standard
Deviation
4866.185
Sample Variance 23679753
Kurtosis -0.69538
Skewness -0.58956
Range 17292.5
Minimum 5001.5
Maximum 22294
Sum 368995.3
Count 25
tabler-icon-diamond-filled.svg

Paraphrase This Document

Need a fresh take? Get an instant paraphrase of this document with our AI Paraphraser
Document Page
Table 2: Descriptive statistics for Sainsbury’s operating profits
Descriptive statistics for Tesco Sales & profits
Table 3: Descriptive statistics for Tesco Sales
Sales
Mean 36312
Standard Error 4096.398
Median 33711.5
Mode #N/A
Operating profits
Mean 590.588
Standard Error 46.0969
Median 656
Mode #N/A
Standard Deviation 230.4845
Sample Variance 53123.1
Kurtosis 3.236692
Skewness -1.47161
Range 1025
Minimum -151
Maximum 874
Sum 14764.7
Count 25
Document Page
Standard
Deviation
16385.59
Sample Variance 2.68E+08
Kurtosis -1.21182
Skewness 0.387411
Range 49555
Minimum 14984
Maximum 64539
Sum 580992
Count 16
Table 4: Descriptive statistics for Tesco operating profit
Operating profit
Mean 2091.313
Standard Error 278.1557
Median 1843.5
Mode #N/A
Standard
Deviation
1112.623
Sample Variance 1237930
Kurtosis -1.16795
Skewness 0.474418
Range 3211
Minimum 774
Maximum 3985
Sum 33461
Count 16
chevron_up_icon
1 out of 29
circle_padding
hide_on_mobile
zoom_out_icon
[object Object]