Business Decision Making: NPV, Payback Period Analysis for S&P plc

Verified

Added on  2023/06/07

|9
|1434
|129
Report
AI Summary
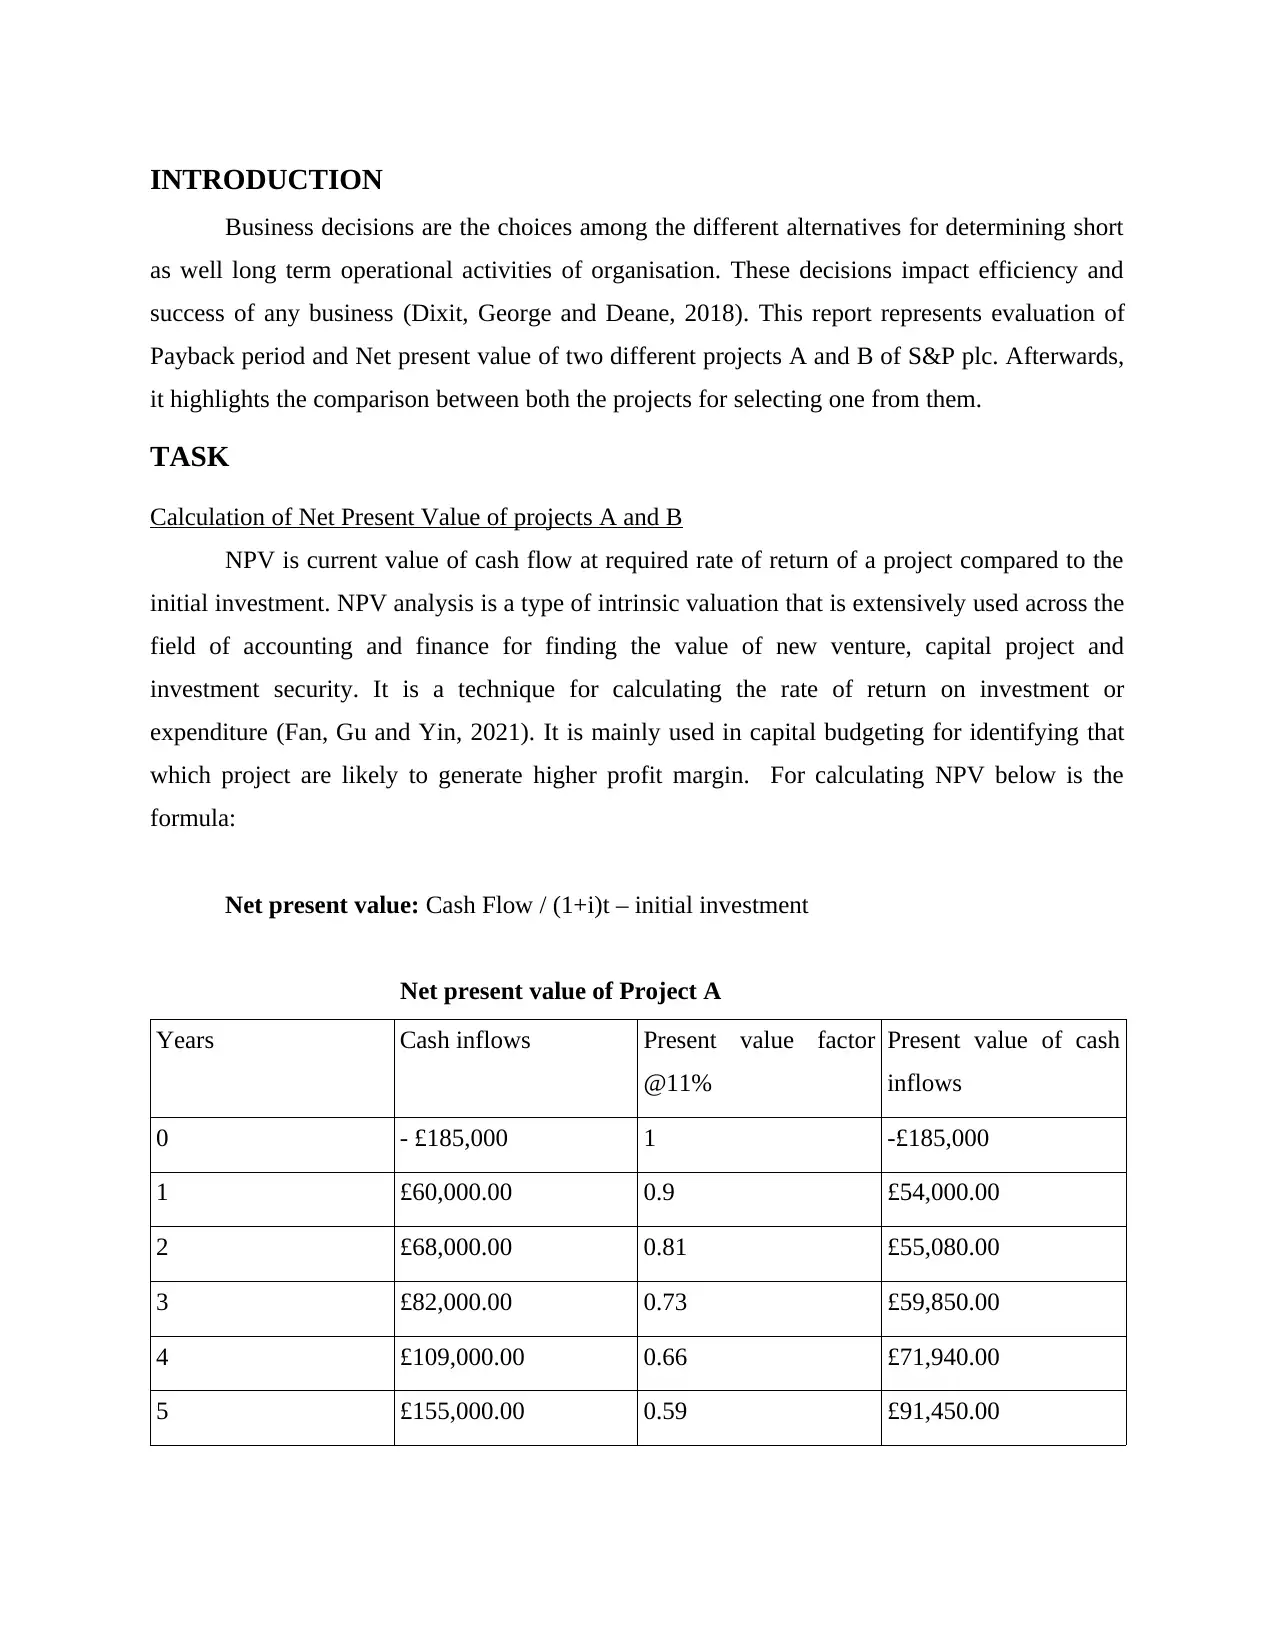
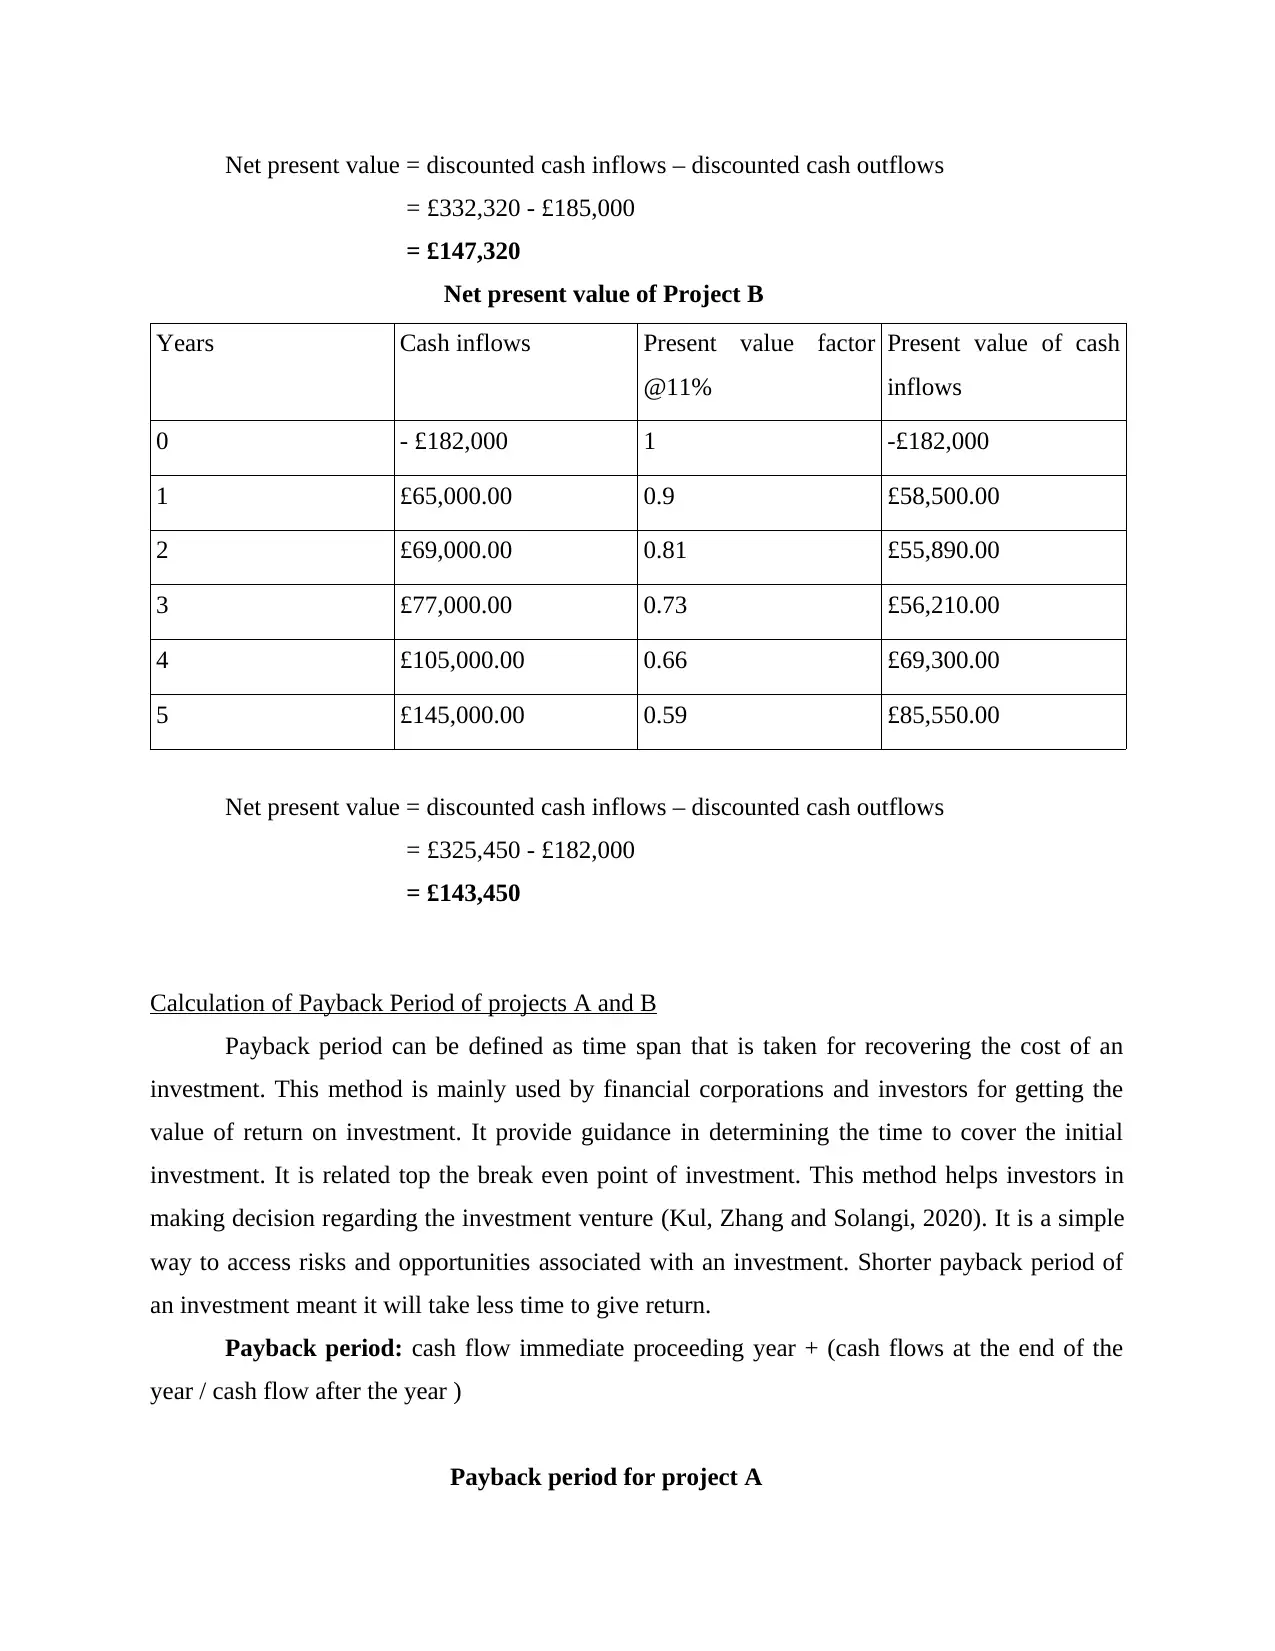
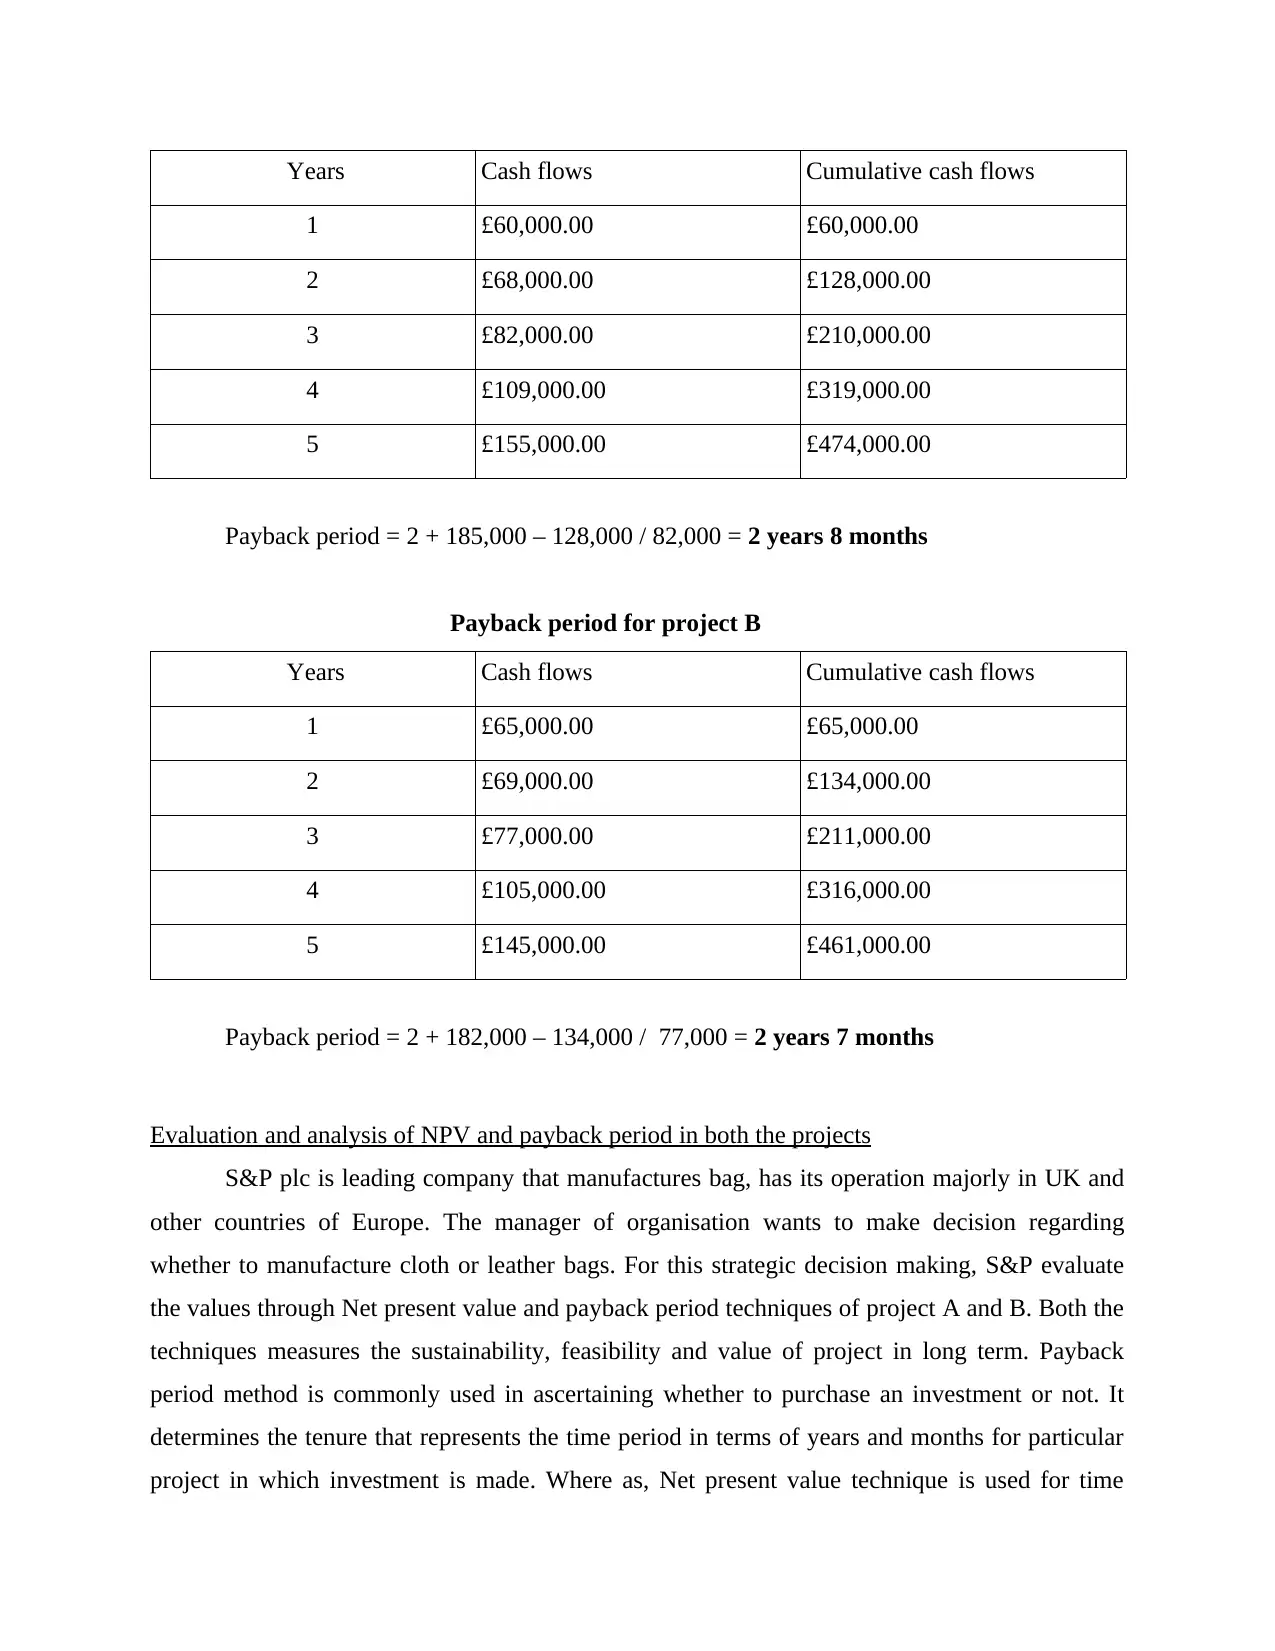
This report provides an evaluation of Net Present Value (NPV) and Payback Period for two projects, A and B, within S&P plc, to inform a strategic decision regarding manufacturing cloth or leather bags. It includes detailed calculations of NPV and payback periods for both projects, followed by a comparative analysis of these methods, advocating for NPV as the more accurate and reliable tool. The report concludes that Project A, with a higher NPV, is the more financially viable option. Additionally, it discusses the importance of both financial and non-financial components in investment decision-making, emphasizing their impact on an organization's overall success and sustainability. Desklib provides a platform for students to access this and similar solved assignments.
Document Page
Business Decision
Making
tabler-icon-diamond-filled.svg

Paraphrase This Document

Need a fresh take? Get an instant paraphrase of this document with our AI Paraphraser
Document Page
Table of Contents
INTRODUCTION ..........................................................................................................................3
TASK...............................................................................................................................................3
Calculation of Net Present Value of projects A and B................................................................3
Calculation of Payback Period of projects A and B....................................................................4
Evaluation and analysis of NPV and payback period in both the projects.................................5
Financial and non-financial components while making investment decision.............................6
CONCLUSION ...............................................................................................................................7
REFERENCES................................................................................................................................8
Document Page
INTRODUCTION
Business decisions are the choices among the different alternatives for determining short
as well long term operational activities of organisation. These decisions impact efficiency and
success of any business (Dixit, George and Deane, 2018). This report represents evaluation of
Payback period and Net present value of two different projects A and B of S&P plc. Afterwards,
it highlights the comparison between both the projects for selecting one from them.
TASK
Calculation of Net Present Value of projects A and B
NPV is current value of cash flow at required rate of return of a project compared to the
initial investment. NPV analysis is a type of intrinsic valuation that is extensively used across the
field of accounting and finance for finding the value of new venture, capital project and
investment security. It is a technique for calculating the rate of return on investment or
expenditure (Fan, Gu and Yin, 2021). It is mainly used in capital budgeting for identifying that
which project are likely to generate higher profit margin. For calculating NPV below is the
formula:
Net present value: Cash Flow / (1+i)t – initial investment
Net present value of Project A
Years Cash inflows Present value factor
@11%
Present value of cash
inflows
0 - £185,000 1 -£185,000
1 £60,000.00 0.9 £54,000.00
2 £68,000.00 0.81 £55,080.00
3 £82,000.00 0.73 £59,850.00
4 £109,000.00 0.66 £71,940.00
5 £155,000.00 0.59 £91,450.00
Document Page
Net present value = discounted cash inflows – discounted cash outflows
= £332,320 - £185,000
= £147,320
Net present value of Project B
Years Cash inflows Present value factor
@11%
Present value of cash
inflows
0 - £182,000 1 -£182,000
1 £65,000.00 0.9 £58,500.00
2 £69,000.00 0.81 £55,890.00
3 £77,000.00 0.73 £56,210.00
4 £105,000.00 0.66 £69,300.00
5 £145,000.00 0.59 £85,550.00
Net present value = discounted cash inflows – discounted cash outflows
= £325,450 - £182,000
= £143,450
Calculation of Payback Period of projects A and B
Payback period can be defined as time span that is taken for recovering the cost of an
investment. This method is mainly used by financial corporations and investors for getting the
value of return on investment. It provide guidance in determining the time to cover the initial
investment. It is related top the break even point of investment. This method helps investors in
making decision regarding the investment venture (Kul, Zhang and Solangi, 2020). It is a simple
way to access risks and opportunities associated with an investment. Shorter payback period of
an investment meant it will take less time to give return.
Payback period: cash flow immediate proceeding year + (cash flows at the end of the
year / cash flow after the year )
Payback period for project A
tabler-icon-diamond-filled.svg

Paraphrase This Document

Need a fresh take? Get an instant paraphrase of this document with our AI Paraphraser
Document Page
Years Cash flows Cumulative cash flows
1 £60,000.00 £60,000.00
2 £68,000.00 £128,000.00
3 £82,000.00 £210,000.00
4 £109,000.00 £319,000.00
5 £155,000.00 £474,000.00
Payback period = 2 + 185,000 – 128,000 / 82,000 = 2 years 8 months
Payback period for project B
Years Cash flows Cumulative cash flows
1 £65,000.00 £65,000.00
2 £69,000.00 £134,000.00
3 £77,000.00 £211,000.00
4 £105,000.00 £316,000.00
5 £145,000.00 £461,000.00
Payback period = 2 + 182,000 – 134,000 / 77,000 = 2 years 7 months
Evaluation and analysis of NPV and payback period in both the projects
S&P plc is leading company that manufactures bag, has its operation majorly in UK and
other countries of Europe. The manager of organisation wants to make decision regarding
whether to manufacture cloth or leather bags. For this strategic decision making, S&P evaluate
the values through Net present value and payback period techniques of project A and B. Both the
techniques measures the sustainability, feasibility and value of project in long term. Payback
period method is commonly used in ascertaining whether to purchase an investment or not. It
determines the tenure that represents the time period in terms of years and months for particular
project in which investment is made. Where as, Net present value technique is used for time
Document Page
worth of money that is considered as a standard method for evaluating value of an investment. It
does not include elements of tenure or period while making choice between project but, payback
period focuses on tenure that is required for return on project (Song, Li and Hong, 2020). NPV is
more accurate and reliable method as it uses net profit and cash flows that results in determining
the better investment decision. Payback period technique is easier as compared to NPV. In case
of S&P plc, for making an optimal financial decision, they must use net present value technique
over payback period method as it more efficient and appropriate tool. Project A has NPV of
£147,320 and project B has NPV of £143,450, which shows that managers of S&P should select
project A that is about manufacturing synthetic leather bags.
Financial and non-financial components while making investment decision
Financial components reflects the effect on investment decisions regarding the cash flow
within organisation. It affects functioning of organisation in comparison between cost of
investment and cost of equity. Financial factors are essential for every business as it consists of
increased flexibility in manufacturing units and their quality as well. It also have some indirect
effects on business investment decisions. Financial elements can accelerates money market and
raise profit margin along with share in market. These factors have the ability to improve
goodwill of the business with facilitating motivation and dedication among employees towards
their job that leads in increasing their efficiency and productivity. Furthermost, it is crucial to
analyse return on investment in monetary term (Sulik-Górecka, 2019).
Non financial elements are also essential in the process of making investment decision, as
they fulfils the present and future legal and other requirements that may affect decisions further.
It also includes standards that are set for best and legal practices in the industry. It boost morale
of employees and facilitate the process of recruitment with retention of individuals in workplace.
Enhances coordination among different departments, consumers, suppliers which improves
reputation of business. These components also determines future threats or competition in market
and provide ways to overcome from these obstacles such as protection of organisation from
intellectual property rights from potential competitors in the market.
Document Page
CONCLUSION
The purpose of the report is to determine which project is best suitable for S&P plc that is
done through techniques such as NPV and Payback Period for evaluating the feasibility of both
projects. Hence, the conclusion can be drawn that S&P plc should use NPV method and
according to this techniques the beneficial project is A that has higher NPV then project B.
Further, it describes financial and non financial elements that have strong impact on decision
making regarding investments.
tabler-icon-diamond-filled.svg

Paraphrase This Document

Need a fresh take? Get an instant paraphrase of this document with our AI Paraphraser
Document Page
REFERENCES
Books and Journals
Dixit, L.P., George, K. and Deane, S., 2018. Investing in non-communicable diseases: an
estimation of the return on investment for prevention and treatment services. The
Lancet, 391(10134), pp.2071-2078.
Fan, L., Gu, B. and Yin, J., 2021. Investment incentive analysis for second-hand
vessels. Transport Policy, 106, pp.215-225.
Kul, C., Zhang, L. and Solangi, Y.A., 2020. Assessing the renewable energy investment risk
factors for sustainable development in Turkey. Journal of Cleaner Production, 276,
p.124164.
Song, Y., Li, X.Y. and Hong, X., 2020. Risk investment decisions within the deterministic
equivalent income model. Kybernetes.
Sulik-Górecka, A., 2019. The Importance of Investment Fund Reporting. Scientific
Publications/University of Economics in Katowice, pp.73-86.
Document Page
chevron_up_icon
1 out of 9
circle_padding
hide_on_mobile
zoom_out_icon
[object Object]