Business Decision Making Task 3.3 Report for HND Business Students

Verified

Added on  2023/03/21

|18
|646
|44
Report
AI Summary
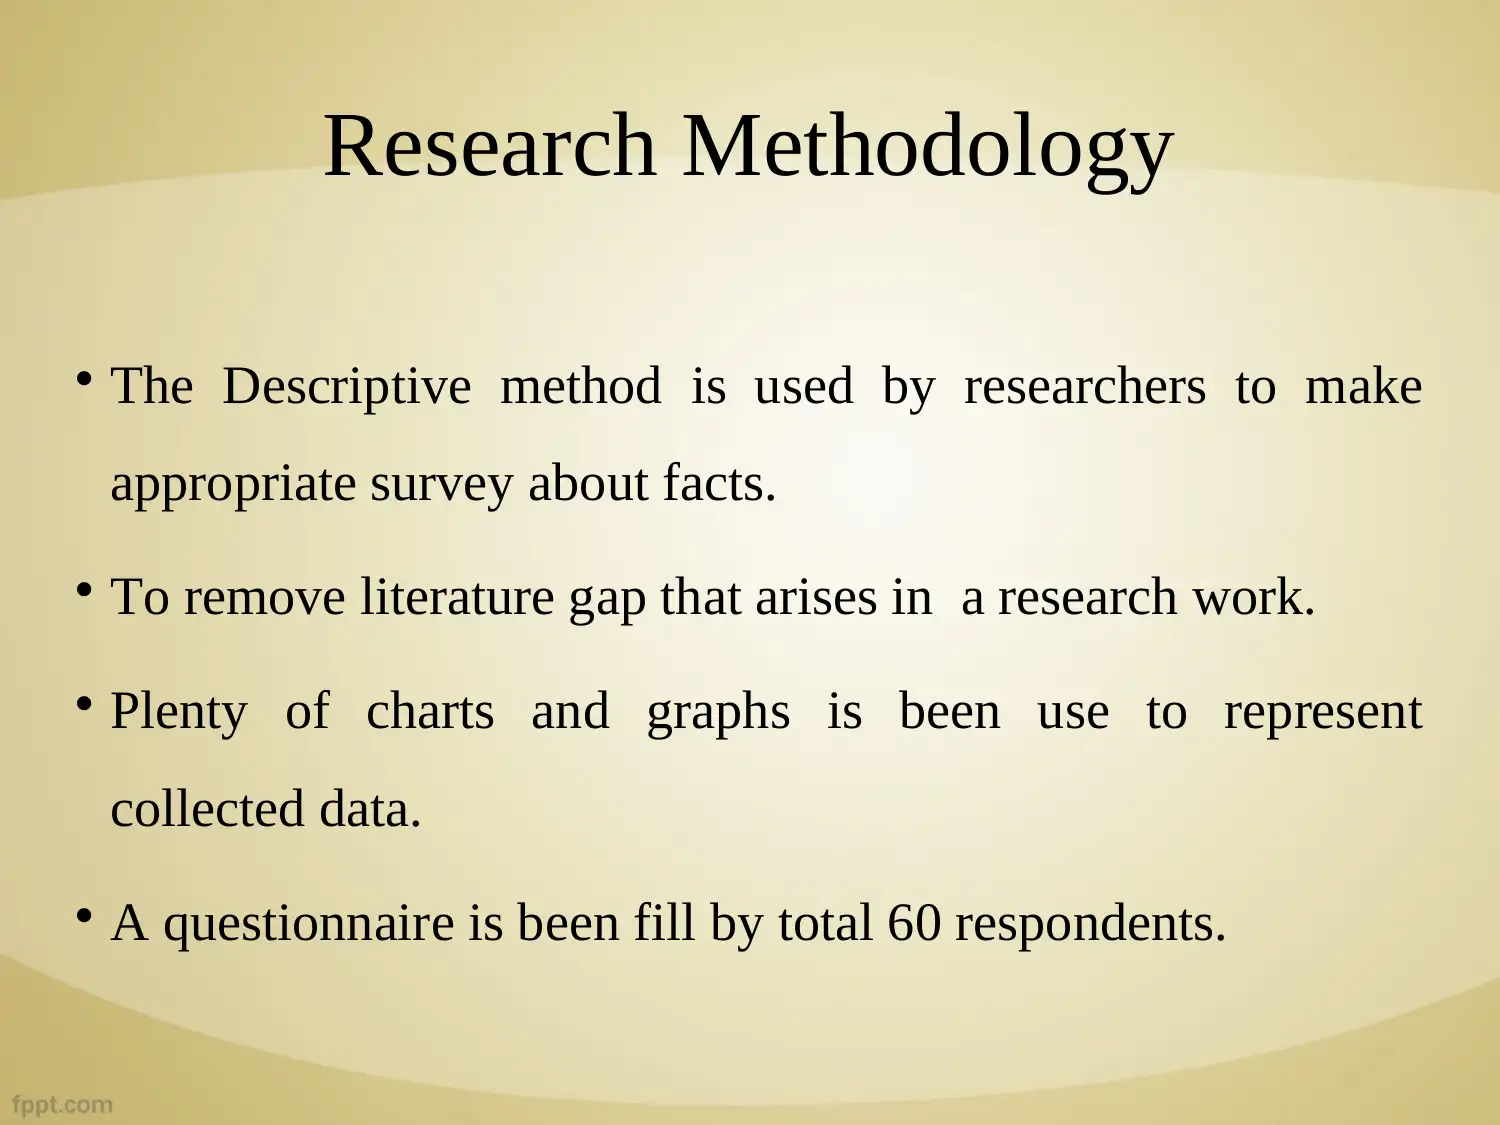
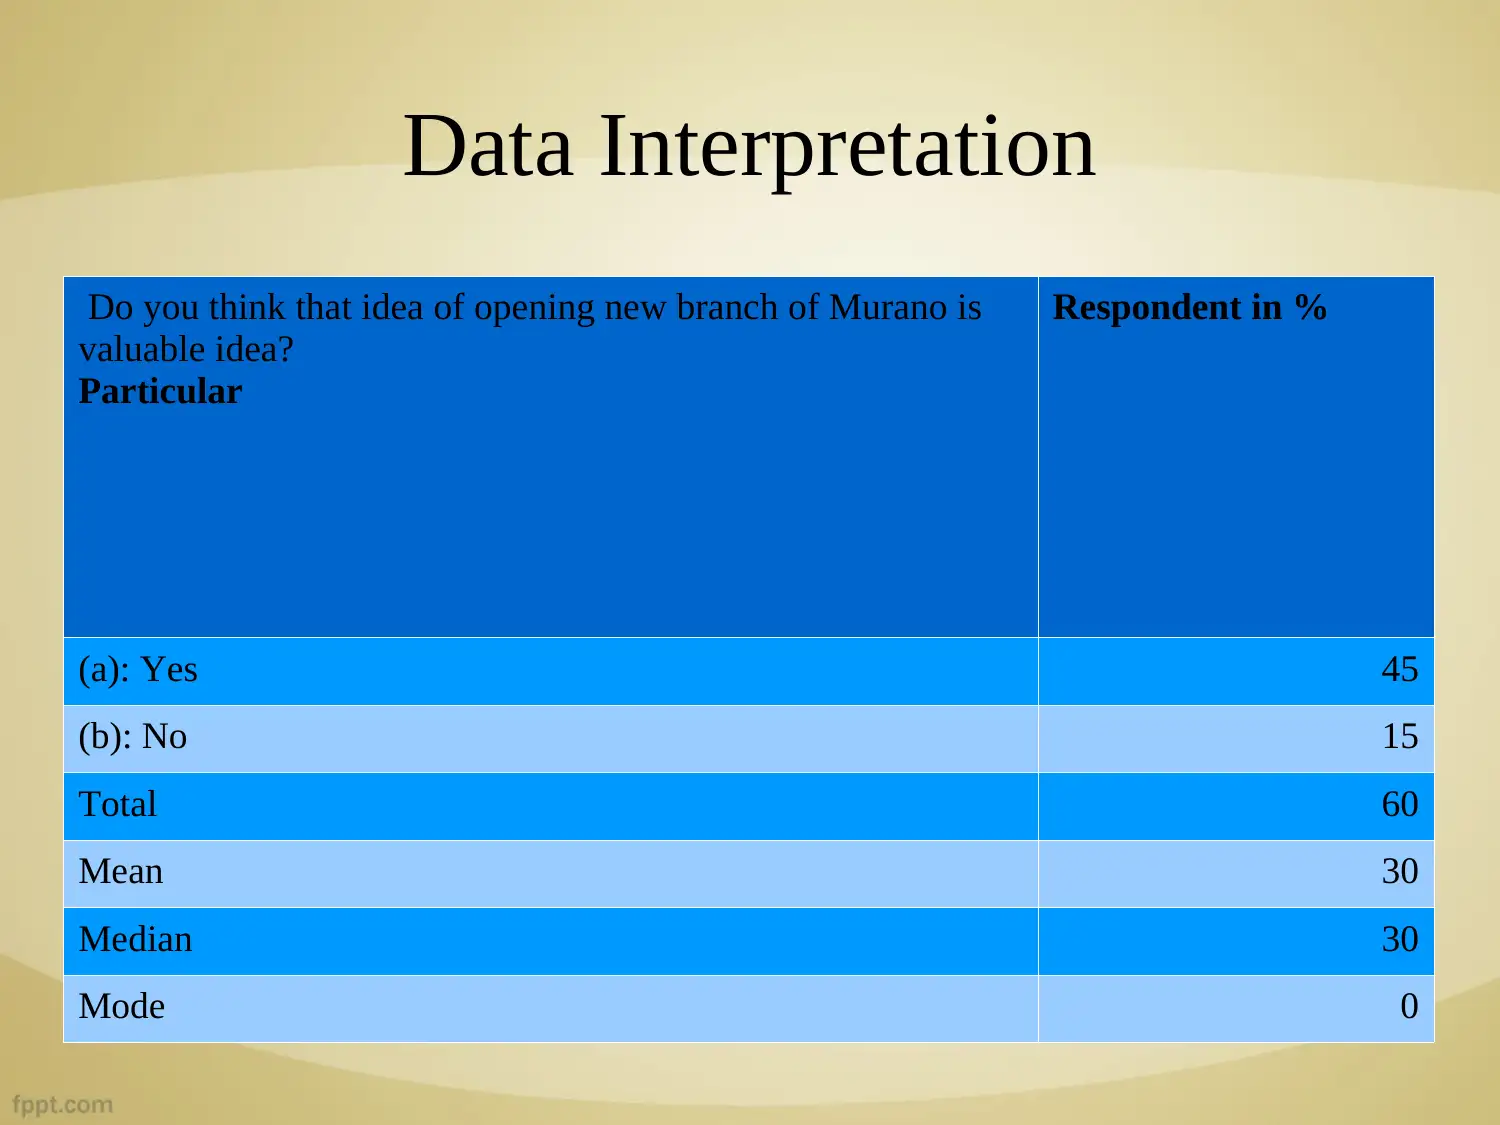
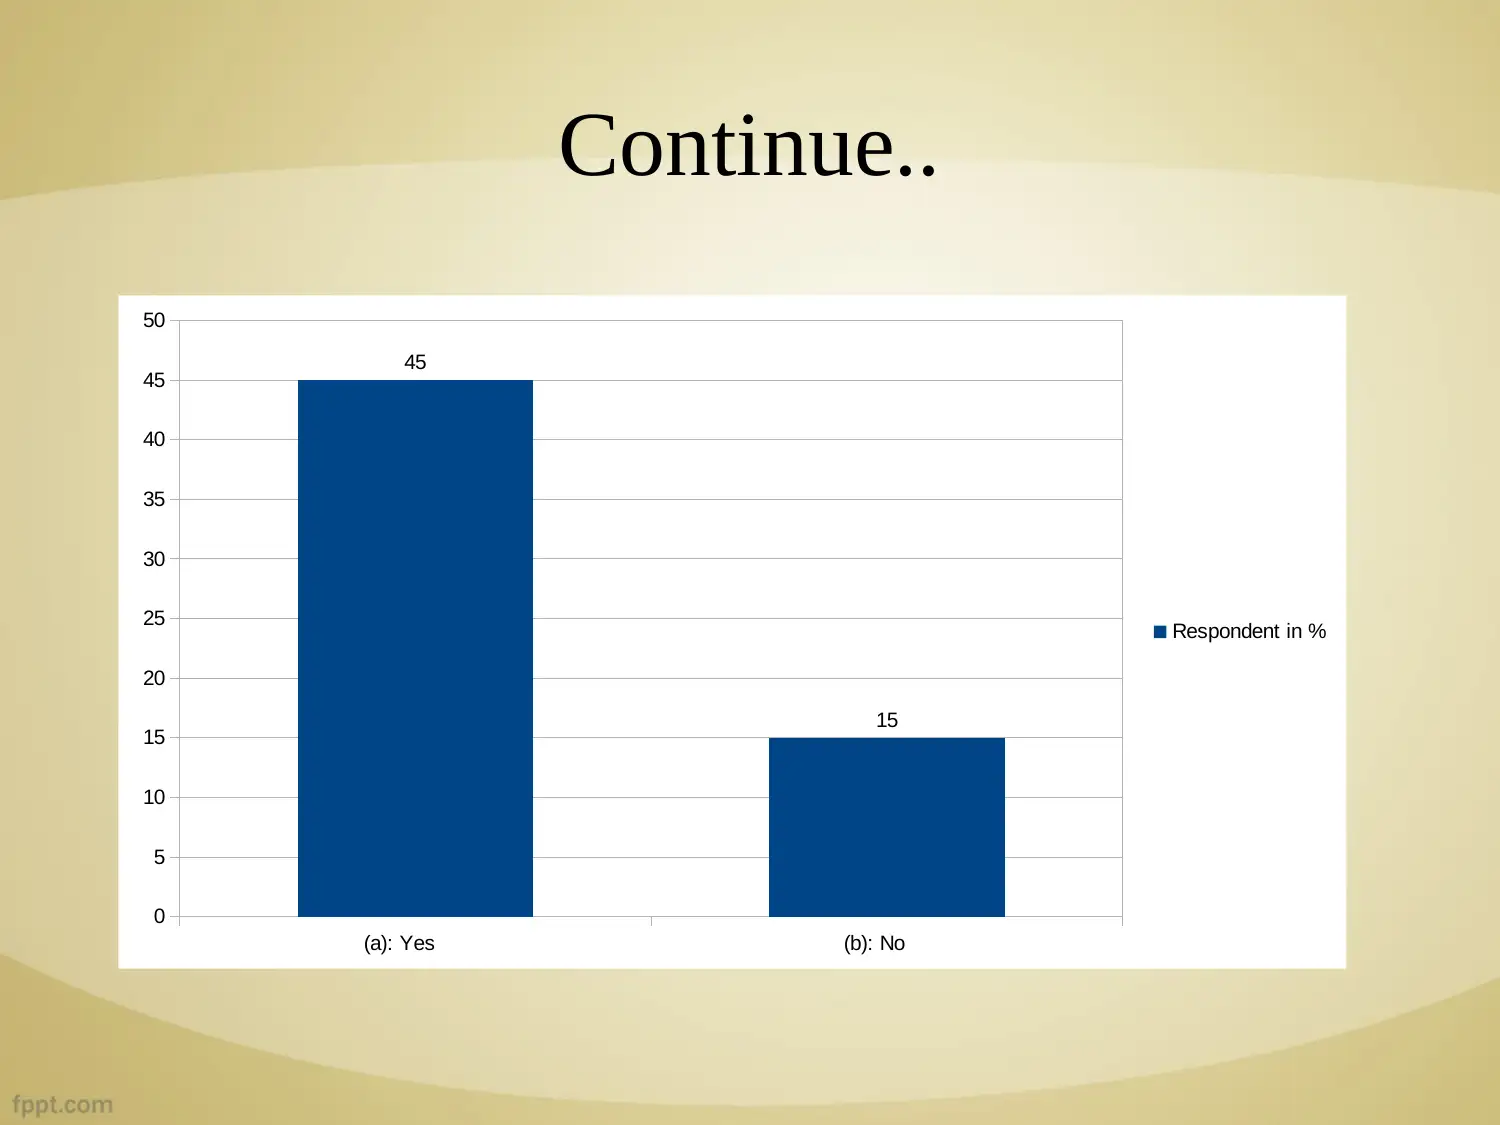
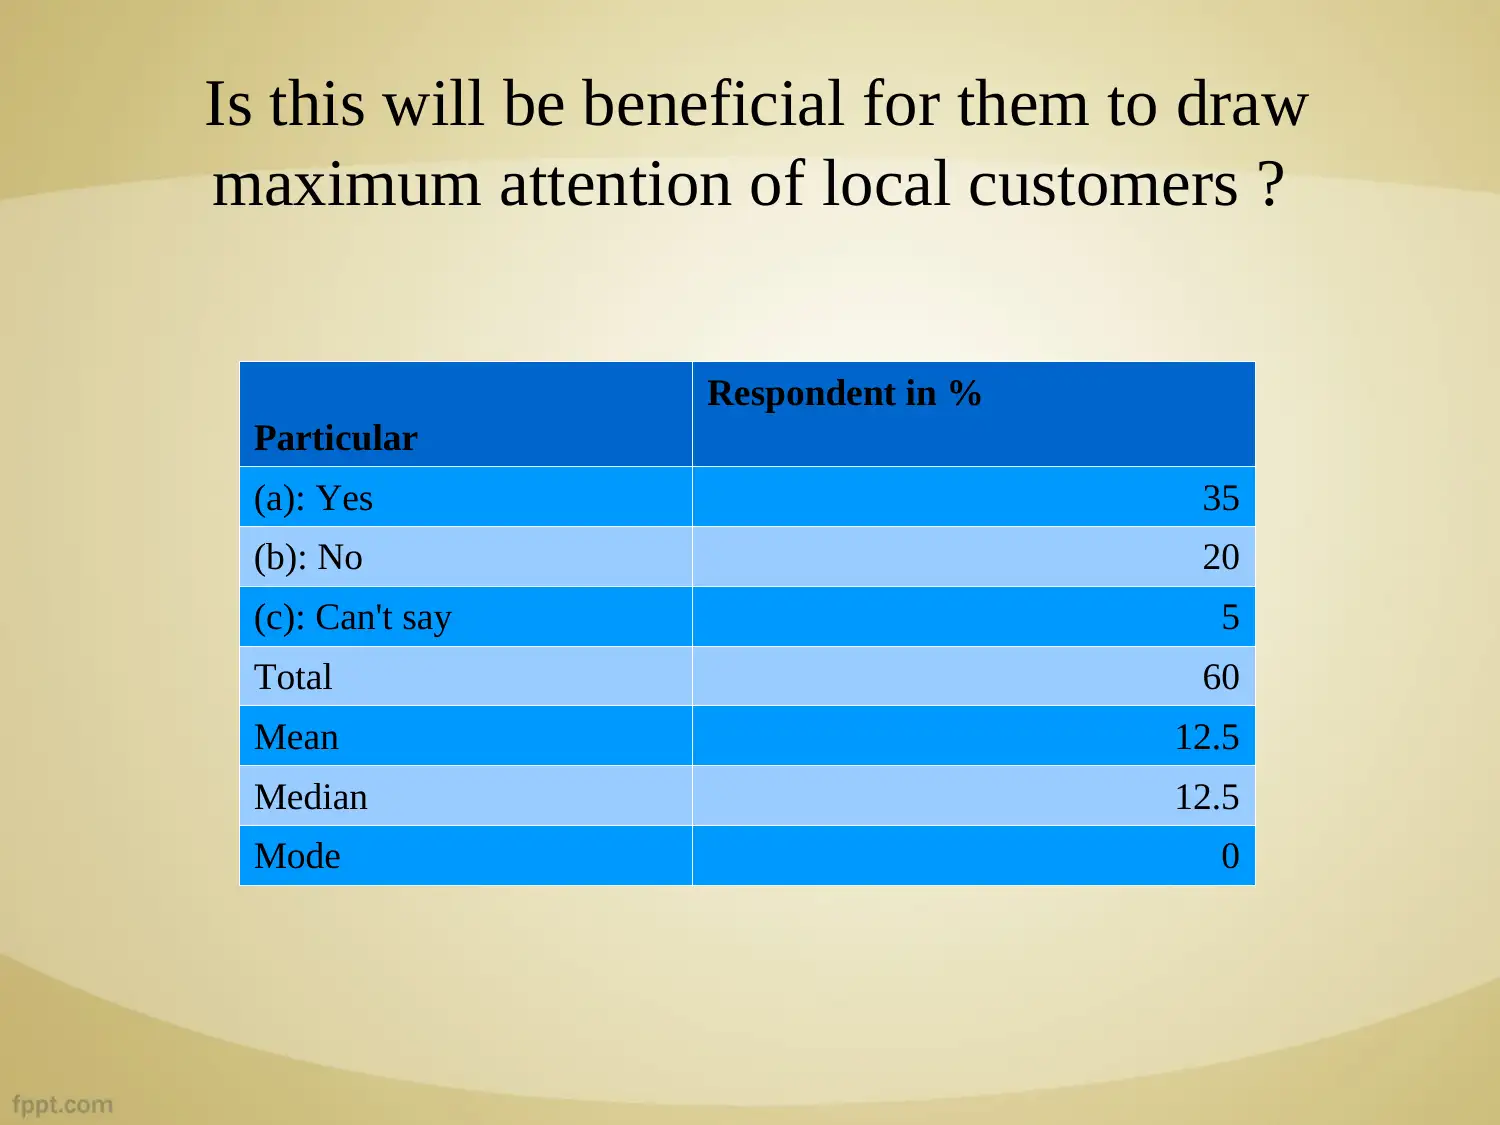
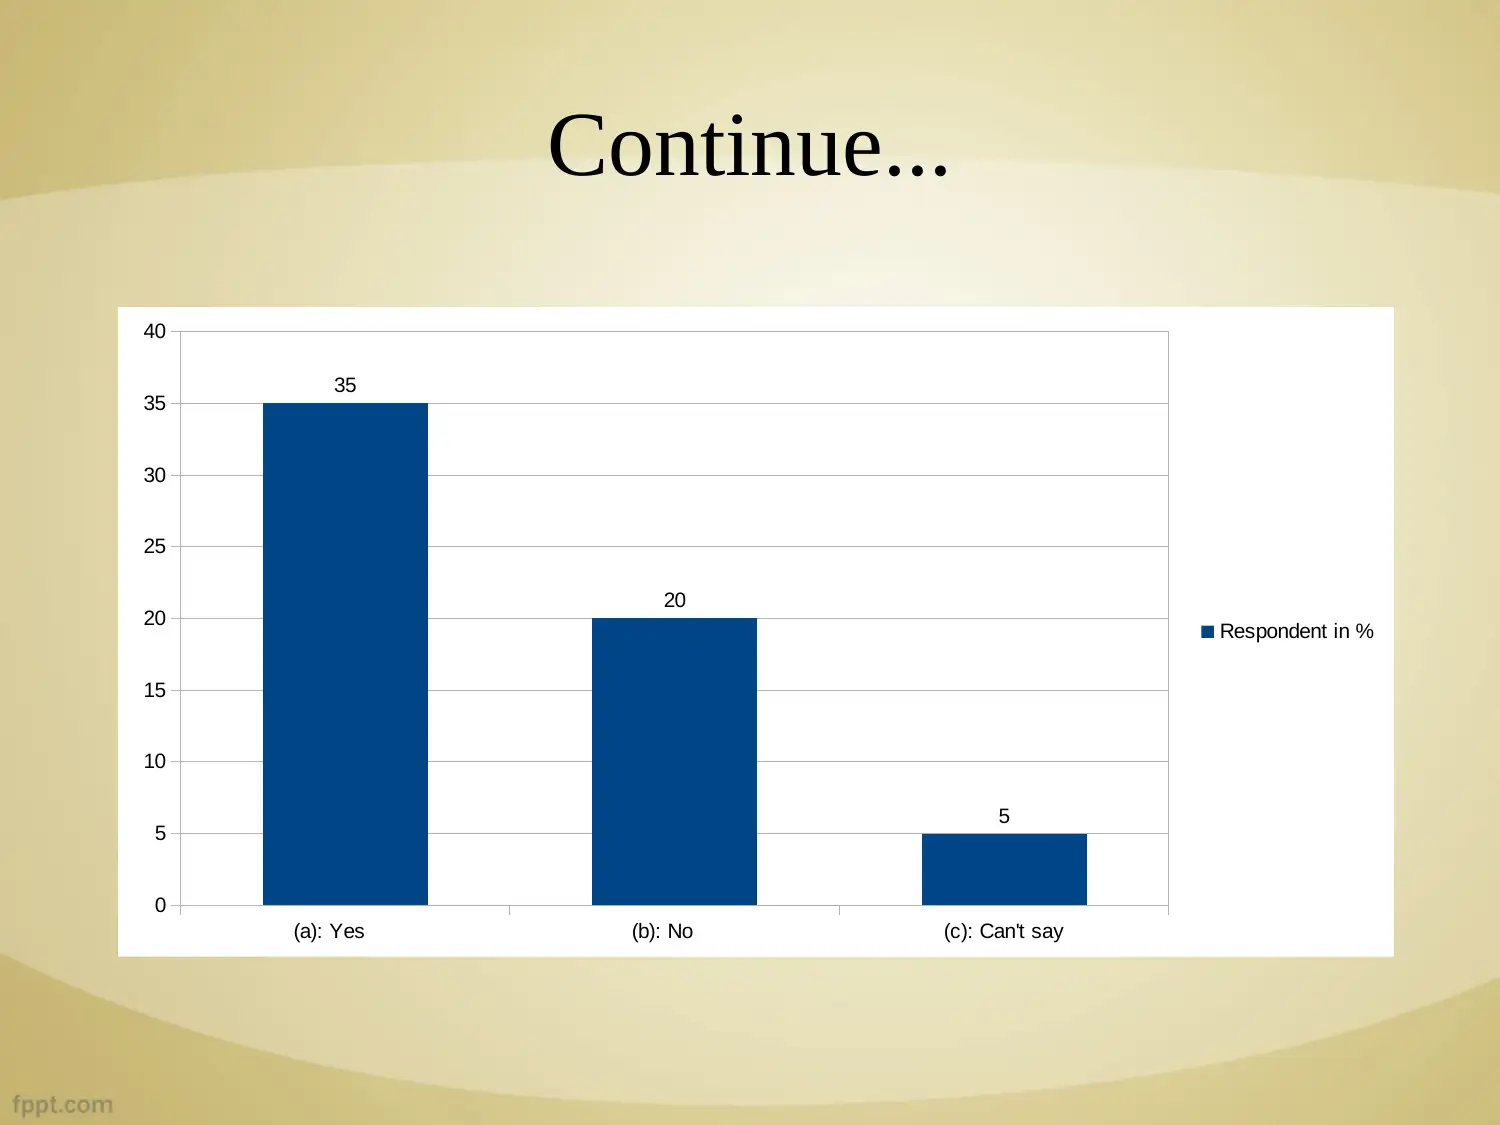
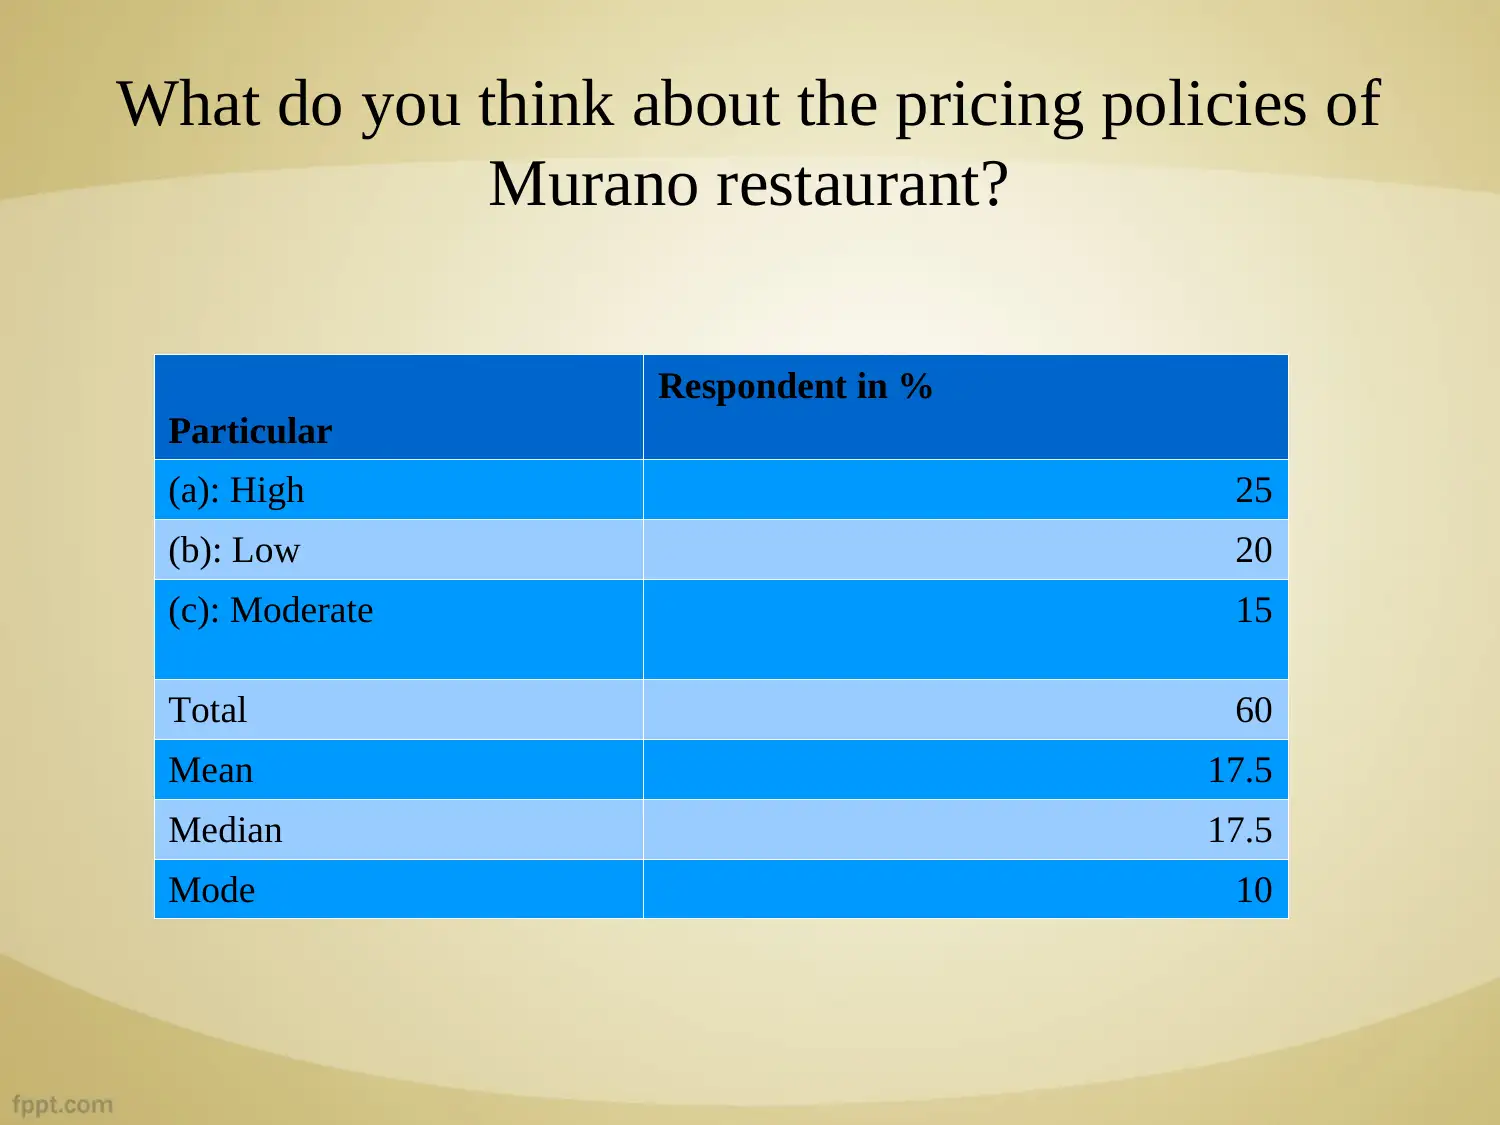
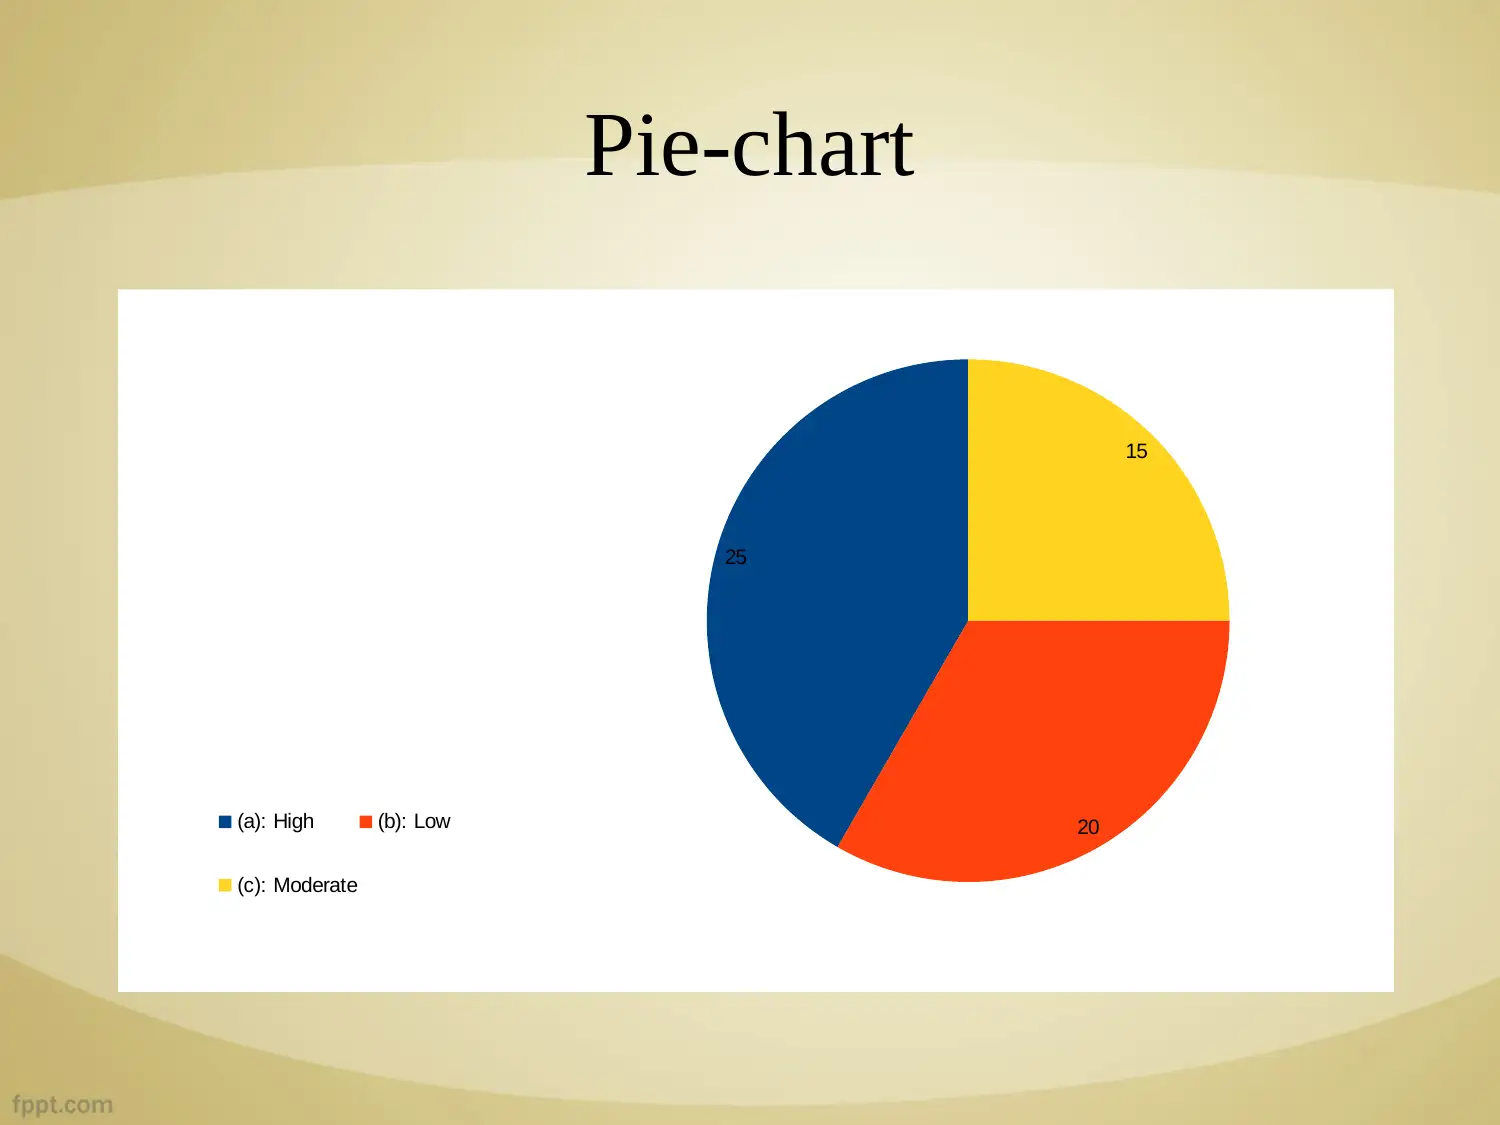
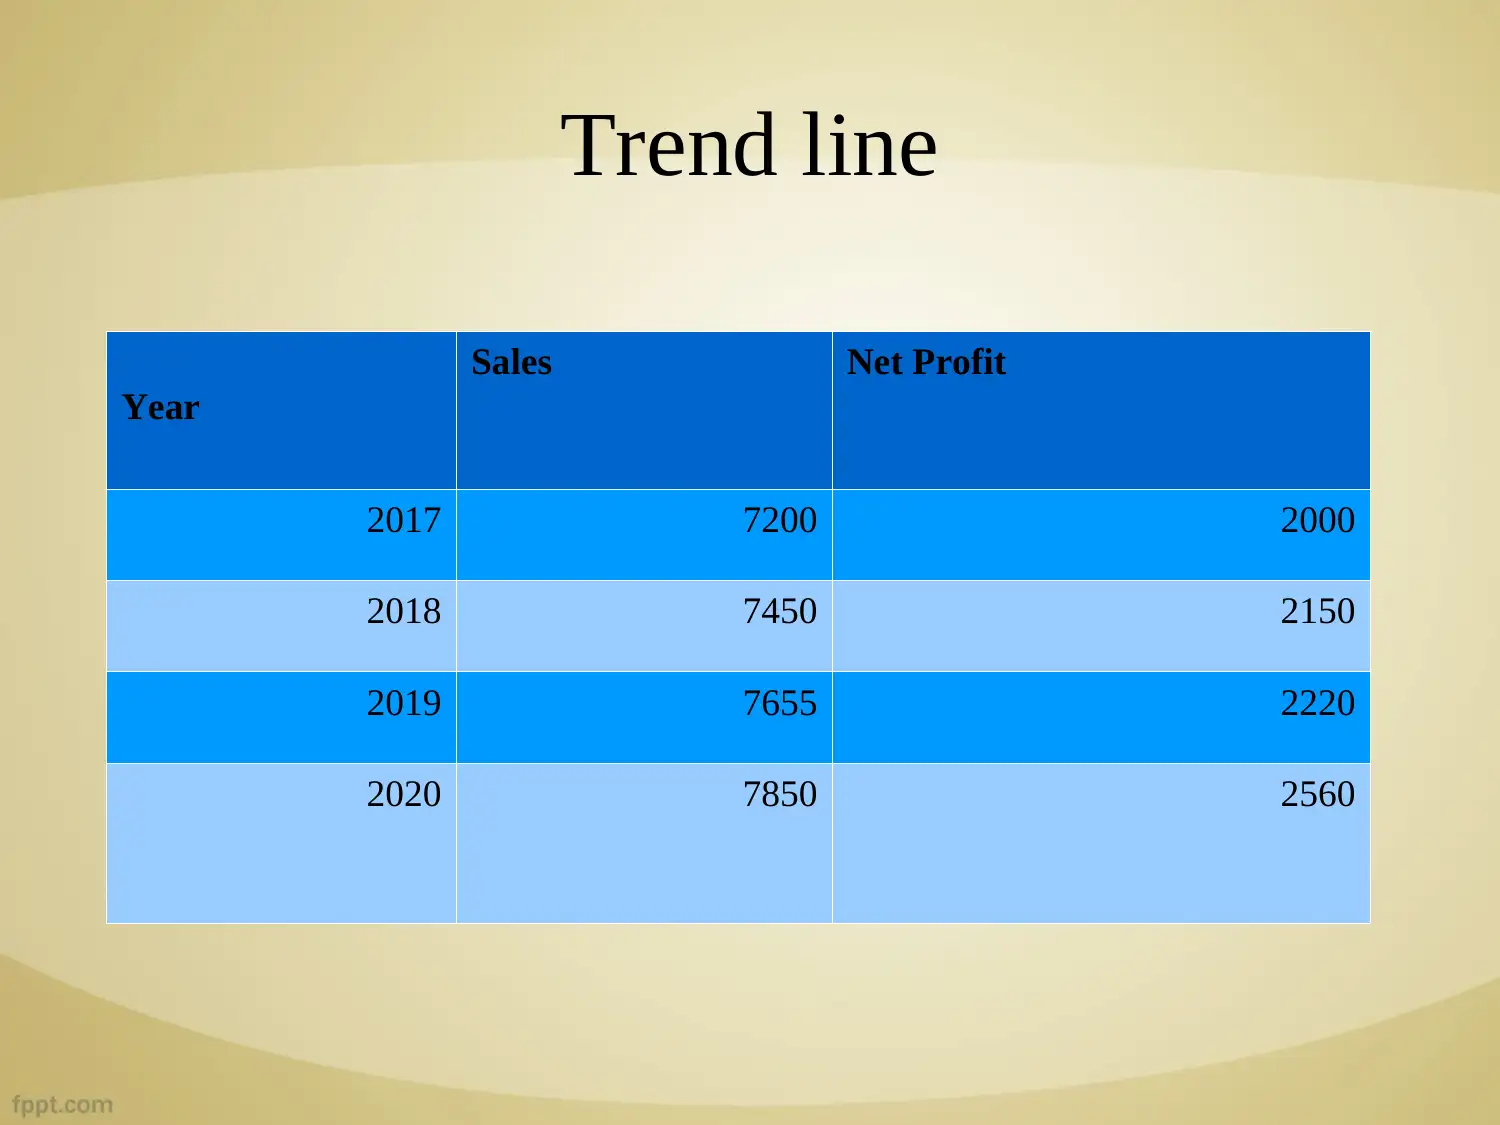
This report analyzes business decision-making, focusing on the potential expansion of a restaurant. The research employs descriptive methods, including questionnaires completed by 60 respondents, to gather customer feedback. Data interpretation involves analyzing responses to questions about the new branch's value, customer attraction, and pricing policies, presented using percentages, means, medians, modes, and charts. Findings indicate strong customer support for the new branch and consistent sales and profit growth. The report suggests incorporating entertainment facilities, prioritizing online bookings, and introducing new cuisines. Overall, the study highlights the importance of effective decision-making, data-driven analysis, and customer perception in driving organizational profitability and expansion, concluding with a positive outlook for the restaurant's new branch.
Document Page
Business Decision Making
Task 3.3
tabler-icon-diamond-filled.svg

Paraphrase This Document

Need a fresh take? Get an instant paraphrase of this document with our AI Paraphraser
Document Page
Covered content
Introduction
Objective
Research methodology
Data interpretation
Finding
Suggestion
Conclusion
References
Document Page
Introduction
Business decision making is a vital element of small
business growth. The researcher used to make various data
analysis by using appropriate decision. This would be
primary base for making proper expansion of any new
venture.
Document Page
Objective
It is essential for the researchers to collect valuable
information from customers about opening of new
restaurant.
The reviews and feedbacks would be gather to analyse
customer perception.
tabler-icon-diamond-filled.svg

Paraphrase This Document

Need a fresh take? Get an instant paraphrase of this document with our AI Paraphraser
Document Page
Research Methodology
The Descriptive method is used by researchers to make
appropriate survey about facts.
To remove literature gap that arises in a research work.
Plenty of charts and graphs is been use to represent
collected data.
A questionnaire is been fill by total 60 respondents.
Document Page
Data Interpretation
Do you think that idea of opening new branch of Murano is
valuable idea?
Particular
Respondent in %
(a): Yes 45
(b): No 15
Total 60
Mean 30
Median 30
Mode 0
Document Page
Continue..
(a): Yes (b): No
0
5
10
15
20
25
30
35
40
45
50
45
15
Respondent in %
tabler-icon-diamond-filled.svg

Paraphrase This Document

Need a fresh take? Get an instant paraphrase of this document with our AI Paraphraser
Document Page
Is this will be beneficial for them to draw
maximum attention of local customers ?
Particular
Respondent in %
(a): Yes 35
(b): No 20
(c): Can't say 5
Total 60
Mean 12.5
Median 12.5
Mode 0
Document Page
Continue...
(a): Yes (b): No (c): Can't say
0
5
10
15
20
25
30
35
40
35
20
5
Respondent in %
Document Page
What do you think about the pricing policies of
Murano restaurant?
Particular
Respondent in %
(a): High 25
(b): Low 20
(c): Moderate 15
Total 60
Mean 17.5
Median 17.5
Mode 10
tabler-icon-diamond-filled.svg

Paraphrase This Document

Need a fresh take? Get an instant paraphrase of this document with our AI Paraphraser
Document Page
Pie-chart
25
20
15
(a): High (b): Low
(c): Moderate
Document Page
Trend line
Year
Sales Net Profit
2017 7200 2000
2018 7450 2150
2019 7655 2220
2020 7850 2560
chevron_up_icon
1 out of 18
circle_padding
hide_on_mobile
zoom_out_icon
[object Object]