UKCBC Business Decision Making Report on Student Satisfaction
VerifiedAdded on 2019/12/18
|22
|4620
|28
Report
AI Summary
This report presents a comprehensive analysis of a student survey conducted at UKCBC, focusing on student experience and satisfaction. The research encompasses a detailed plan for collecting both primary and secondary data, including the design of a survey methodology, sampling frame, and a structured questionnaire. The study utilizes various statistical tools to analyze the collected data, such as calculating mean, median, and mode, along with measures of dispersion, correlation, and percentile. The report includes graphical representations of the data, trend analysis, and a formal business report. Furthermore, the report explores information processing tools, network diagrams, and project evaluation methods to provide a holistic view of the research findings. The analysis culminates in a discussion of the results and their implications for UKCBC, incorporating financial calculations like Net Present Value and Internal Rate of Return, and concludes with a network diagram and Gantt chart for project evaluation.

BUSINESS DECISION MAKING
Paraphrase This Document
Need a fresh take? Get an instant paraphrase of this document with our AI Paraphraser
TABLE OF CONTENTS
INTRODUCTION...........................................................................................................................3
TASK 1............................................................................................................................................3
1.1. Creating a plan for the collection of primary and secondary data........................................3
1.2. Designing survey methodology and sampling frame...........................................................4
1.3. Presenting a questionnaire for the collection of primary data..............................................4
TASK 2............................................................................................................................................6
2.1 Calculation of mean, median and mode................................................................................6
2.2 Interpretation of results..........................................................................................................7
2.3 Measures of dispersion..........................................................................................................8
2.4 Computation of correlation and percentile............................................................................9
TASK 3..........................................................................................................................................10
3.1 Graphical representation of data..........................................................................................10
3.2 Trend analysis chart.............................................................................................................12
3.3 Power point presentation.....................................................................................................12
3.4 Formal business report.........................................................................................................12
TASK 4..........................................................................................................................................13
4.1 Information processing tools...............................................................................................13
4.2 Network diagram.................................................................................................................14
4.3 Project evaluation method...................................................................................................15
CONCLUSUION...........................................................................................................................15
REFERENCES..............................................................................................................................17
Figure 1People response on statement do you agree that grades attained in the examination have
high level of impact on satisfaction level......................................................................................11
Figure 2Respondents response on question you is satisfied with modules, supporting note and
revision exercise conducted by UK CBC?....................................................................................12
Figure 3Trend analysis chart.........................................................................................................13
Figure 4GANTT chart...................................................................................................................15
Figure 5Network diagram..............................................................................................................15
Figure 6Calculation of Net present value......................................................................................16
Figure 7Calculation of IRR...........................................................................................................16
Table 1Calcualtion of mean, median and mode..............................................................................7
Table 2Calculation of standard deviation........................................................................................9
Table 3Calcualtion of quartile and percentile................................................................................10
⊘ This is a preview!⊘
Do you want full access?
Subscribe today to unlock all pages.
Trusted by 1+ million students worldwide
INTRODUCTION
Statistics is the area in which many developments happened in the recent time period. There
are number of statistical tools that can be used to analyze the data. Hence, it is very important to
select appropriate statistical method in order to make business decisions. In the current report
research is carried out on the UKCBC and thinking that students have about same in terms of
education. In this regard primary research is conducted and data is analyzed by using descriptive
analysis tools. Along with this, in the report, trend analysis is done and accordingly prediction is
made. At end of the report, network diagram is prepared and comments are done on same. Along
with this, in the report project evaluation method is applied on cash flow and viability of project
is measured.
TASK 1
a. Creating a plan for the collection of primary and secondary data
In order to evaluate the mindset of students regarding the educational services of UK
CBC college data has been gathered through the means of both primary and secondary sources.
Primary data is the one that is obtained by the researcher through the means of new investigation.
Survey, observation and focus group etc. are the most effectual methods which in turn help in
collecting highly suitable information according to the research issue (Laing, Ross and Joubert,
2014). In reduces the possibility of business to a great extent. On the other side, secondary data
may be served as those that have already been evaluated by some other authority. Books,
journals and research articles help in making collection of suitable secondary data. Researcher
has visited the all branches of CBC College that are located on the several locations during the
14 days of duration. We have surveyed with the various questions in the questionnaire and the
personal interviews with maximum students to fetch their ideas and it reduces the perplexity in
implementing changes. Budget of £15000 has been considered by the researcher to conduct
investigation more effectually. The colleges are:
Wentworth House- Gants Hills (Main Campus- East London)
Lords House- Gants Hill (East London)
Windermere House- Park Royal (West London)
Paraphrase This Document
Need a fresh take? Get an instant paraphrase of this document with our AI Paraphraser
Victory Park- Cricklewood (North West London)
Plan for the collection of primary data
With the motive to evaluate the preferences, attitude and satisfaction level of student’s
primary data has been collected by the researcher via survey. This is the most effectual methods
which in turn help in collecting suitable information in accordance to the research issue (Nutt
and Wilson, 2010). Hence, for conducting survey in an effectual way researcher has selected
sample of 20 students by using purposive sampling technique. Thereafter, researcher has
designed questionnaire by including both close as well as open ended questions in the
questionnaire. In this way, by designing questionnaire in an appropriate manner and sending the
same to the students researcher will collect primary data.
Secondary data collection plan
To assess the factors that place high level of impact on the satisfaction, experience and
grades level of researcher has made evaluation of books, journals and other related articles. In
this, by using internet and accessing the related articles scholar will collect secondary data. In
this, by preparing brief thesis scholar would become able to analyze data in the best possible
way.
Quantitative data collection plan
The quantitative data is the collection of all the numerical data, they are recorded with the
system record in books in the computer database. This is an adequate and correct method of
collection of data. It helps in fetching the competency and the confidence of the person. It is a
logical way that helps the scholars apart from the theoretical knowledge.
Qualitative data collection plan
The quality collection of data in which the representative talks to the individual student
and takes notes, everyone has the different thoughts so with the help of this data collection
process we analyses the innovative ideas, opinions and beliefs.
b. Designing survey methodology and sampling frame
Survey methodology
The surveys can be categorized broadly into two area like the time and the
instrumentation. Here, we create the various selection processes like questionnaires, sampling
interviews, cross- selection and the longitudinal survey. Selection of suitable tools and
techniques are the prior requirements which in turn help in conducting survey in an effectual
manner. Moreover, researcher can analyze data and would become able to present suitable
solution only when survey is conducted within the suitable time frame (Robert, 2010). Hence,
with the motive to conduct study within the less duration online survey methodology has been
selected by the scholar. On the basis of this aspect, researcher will approach to the administration
department of UK CBC and thereby gather information regarding the mail id of students. Once
mail–id’s of the students have been acquired thereafter scholar will send questionnaire to the
potential respondents. In this way, by sending questionnaire and getting quick responses of
students researcher can present the fair view of study. Hence, by following online survey
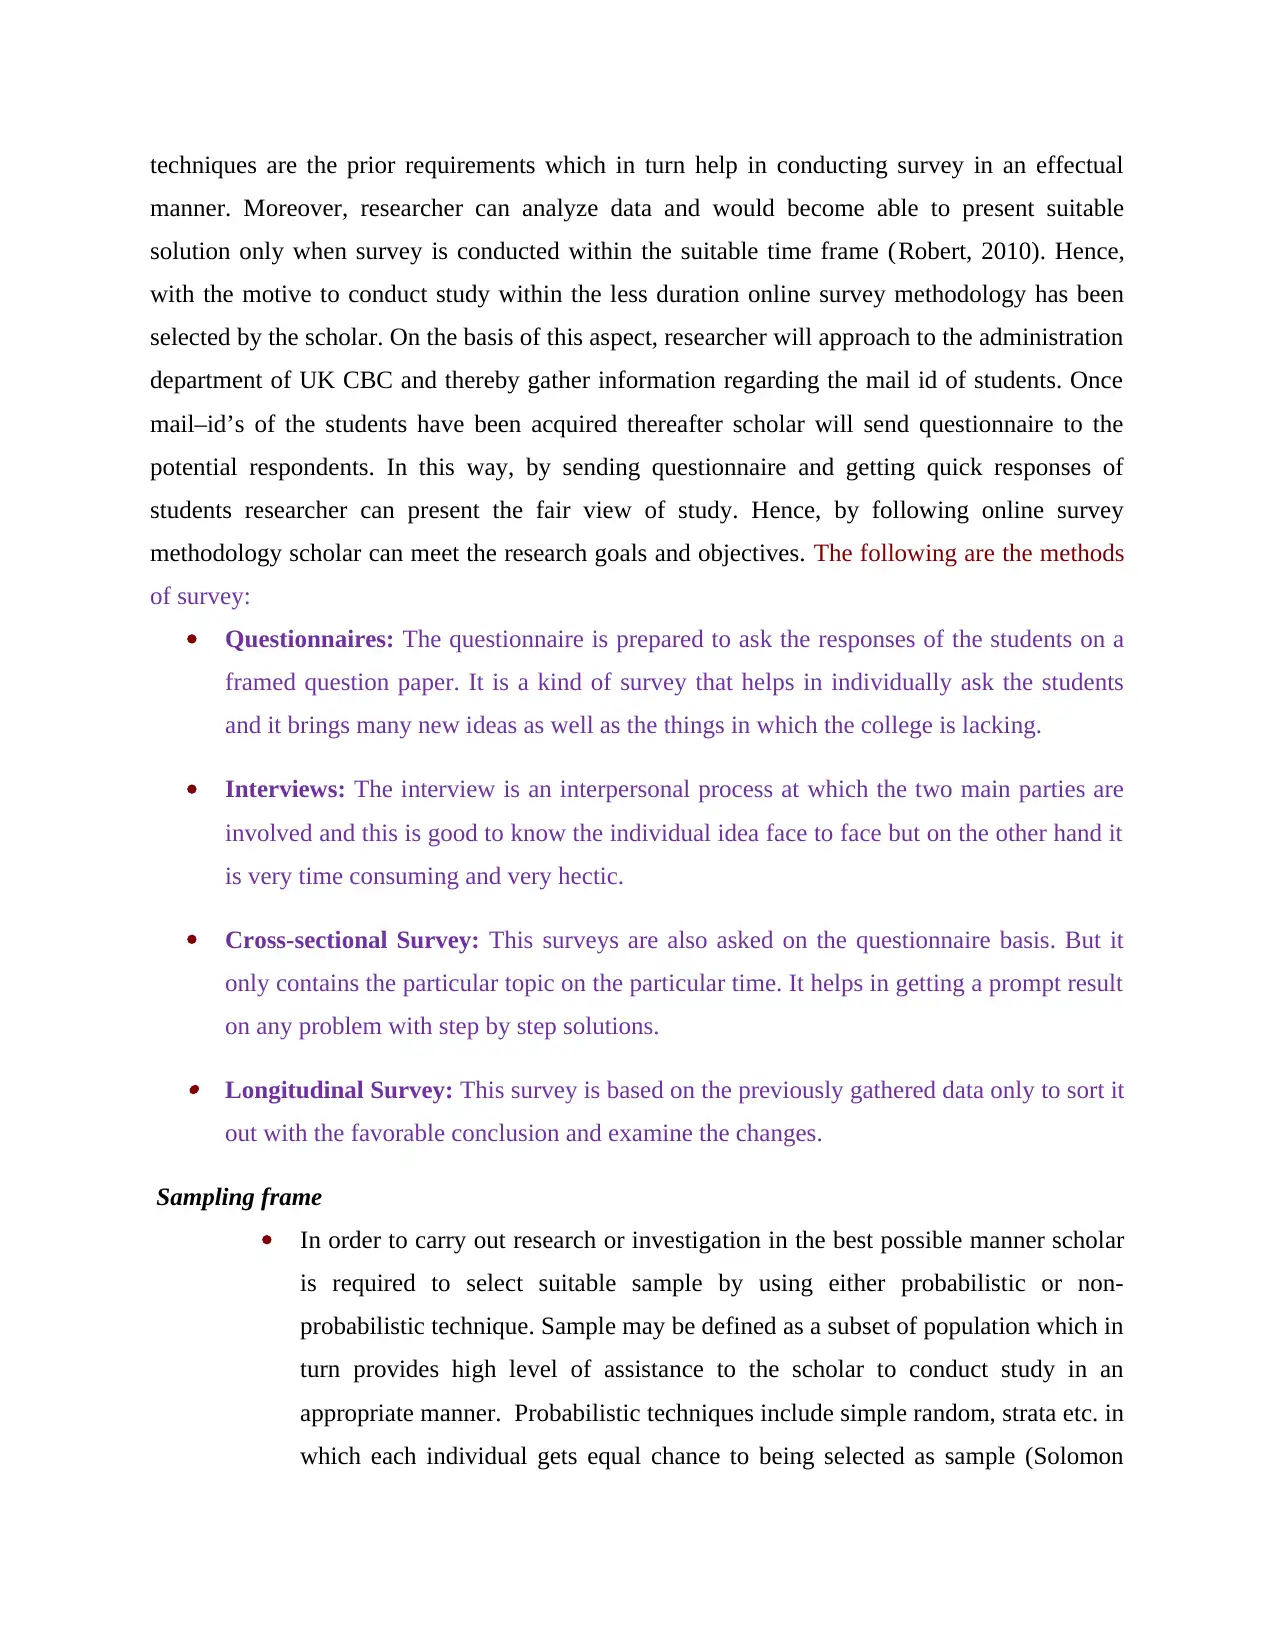
methodology scholar can meet the research goals and objectives. The following are the methods
of survey:
Questionnaires: The questionnaire is prepared to ask the responses of the students on a
framed question paper. It is a kind of survey that helps in individually ask the students
and it brings many new ideas as well as the things in which the college is lacking.
Interviews: The interview is an interpersonal process at which the two main parties are
involved and this is good to know the individual idea face to face but on the other hand it
is very time consuming and very hectic.
Cross-sectional Survey: This surveys are also asked on the questionnaire basis. But it
only contains the particular topic on the particular time. It helps in getting a prompt result
on any problem with step by step solutions.
Longitudinal Survey: This survey is based on the previously gathered data only to sort it
out with the favorable conclusion and examine the changes.
Sampling frame
In order to carry out research or investigation in the best possible manner scholar
is required to select suitable sample by using either probabilistic or non-
probabilistic technique. Sample may be defined as a subset of population which in
turn provides high level of assistance to the scholar to conduct study in an
appropriate manner. Probabilistic techniques include simple random, strata etc. in
which each individual gets equal chance to being selected as sample (Solomon
manner. Moreover, researcher can analyze data and would become able to present suitable
solution only when survey is conducted within the suitable time frame (Robert, 2010). Hence,
with the motive to conduct study within the less duration online survey methodology has been
selected by the scholar. On the basis of this aspect, researcher will approach to the administration
department of UK CBC and thereby gather information regarding the mail id of students. Once
mail–id’s of the students have been acquired thereafter scholar will send questionnaire to the
potential respondents. In this way, by sending questionnaire and getting quick responses of
students researcher can present the fair view of study. Hence, by following online survey
methodology scholar can meet the research goals and objectives. The following are the methods
of survey:
Questionnaires: The questionnaire is prepared to ask the responses of the students on a
framed question paper. It is a kind of survey that helps in individually ask the students
and it brings many new ideas as well as the things in which the college is lacking.
Interviews: The interview is an interpersonal process at which the two main parties are
involved and this is good to know the individual idea face to face but on the other hand it
is very time consuming and very hectic.
Cross-sectional Survey: This surveys are also asked on the questionnaire basis. But it
only contains the particular topic on the particular time. It helps in getting a prompt result
on any problem with step by step solutions.
Longitudinal Survey: This survey is based on the previously gathered data only to sort it
out with the favorable conclusion and examine the changes.
Sampling frame
In order to carry out research or investigation in the best possible manner scholar
is required to select suitable sample by using either probabilistic or non-
probabilistic technique. Sample may be defined as a subset of population which in
turn provides high level of assistance to the scholar to conduct study in an
appropriate manner. Probabilistic techniques include simple random, strata etc. in
which each individual gets equal chance to being selected as sample (Solomon
⊘ This is a preview!⊘
Do you want full access?
Subscribe today to unlock all pages.
Trusted by 1+ million students worldwide
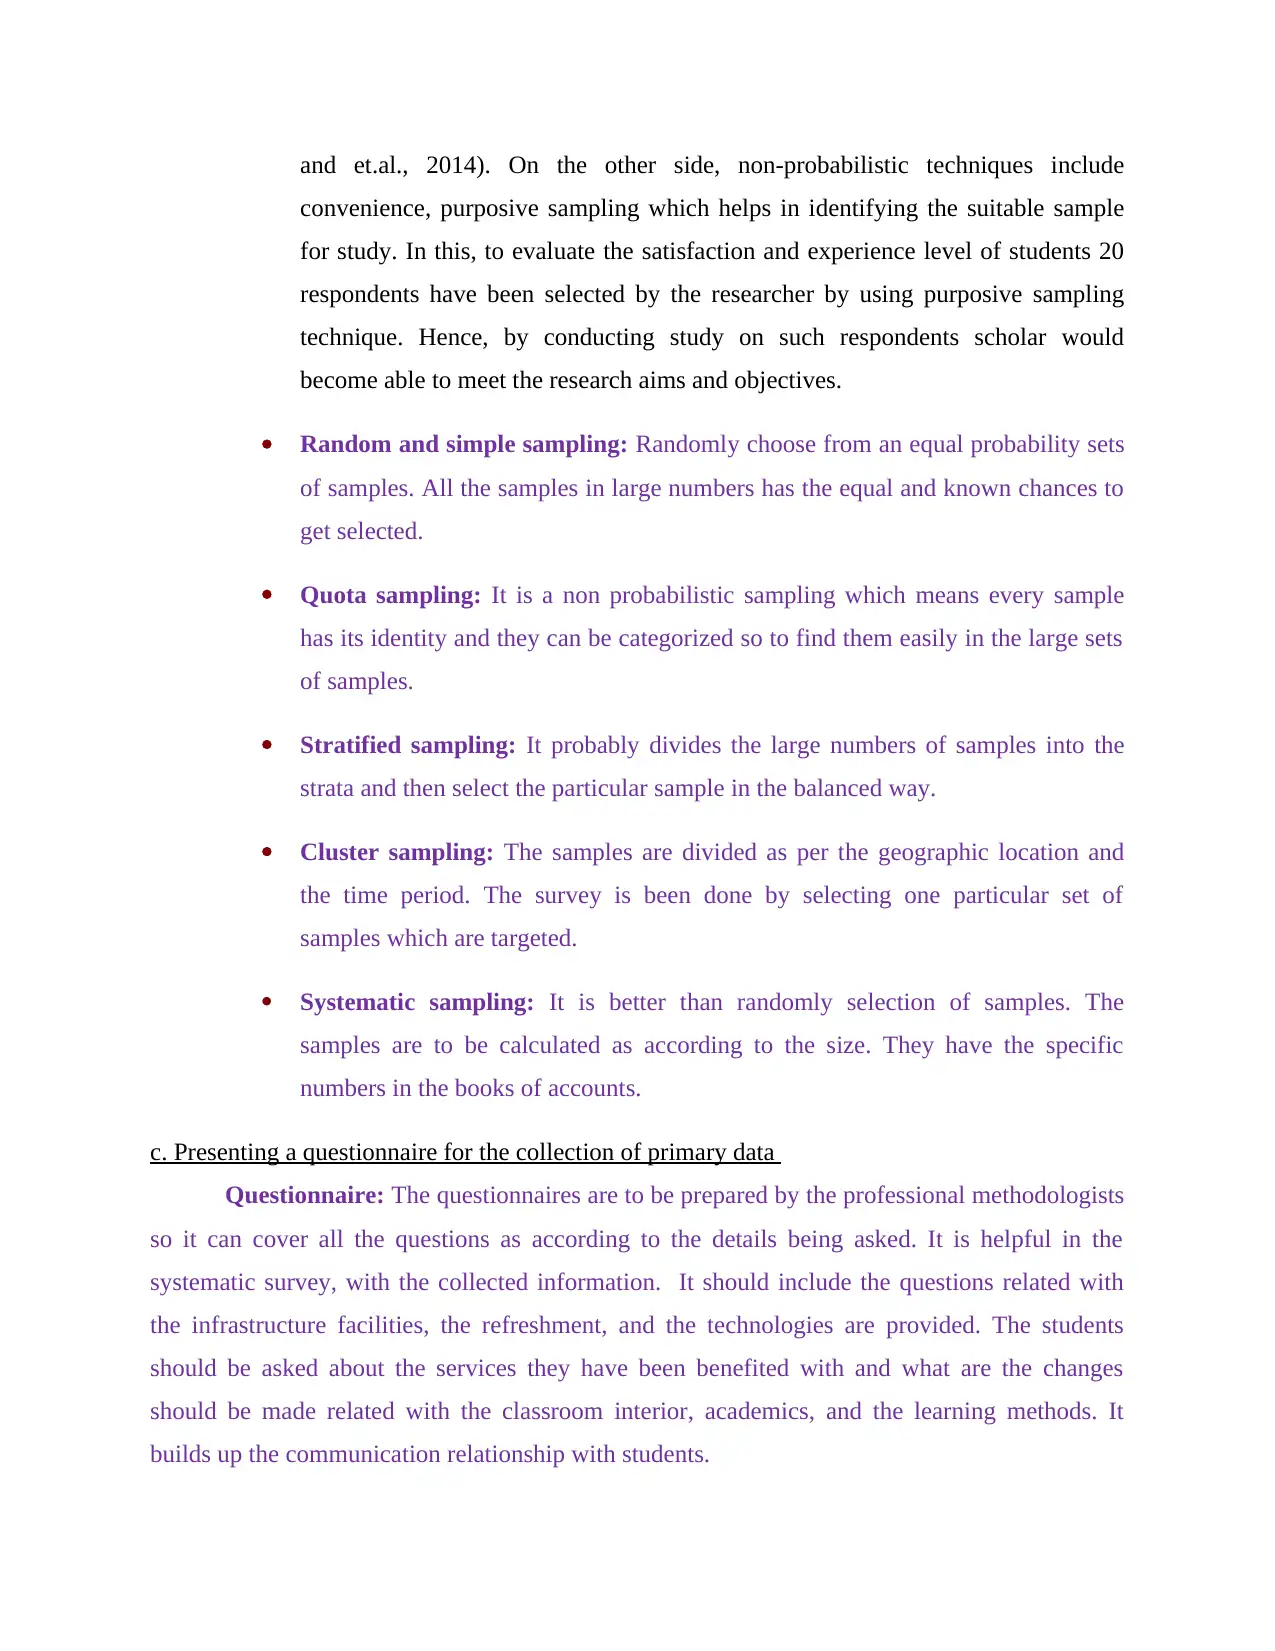
and et.al., 2014). On the other side, non-probabilistic techniques include
convenience, purposive sampling which helps in identifying the suitable sample
for study. In this, to evaluate the satisfaction and experience level of students 20
respondents have been selected by the researcher by using purposive sampling
technique. Hence, by conducting study on such respondents scholar would
become able to meet the research aims and objectives.
Random and simple sampling: Randomly choose from an equal probability sets
of samples. All the samples in large numbers has the equal and known chances to
get selected.
Quota sampling: It is a non probabilistic sampling which means every sample
has its identity and they can be categorized so to find them easily in the large sets
of samples.
Stratified sampling: It probably divides the large numbers of samples into the
strata and then select the particular sample in the balanced way.
Cluster sampling: The samples are divided as per the geographic location and
the time period. The survey is been done by selecting one particular set of
samples which are targeted.
Systematic sampling: It is better than randomly selection of samples. The
samples are to be calculated as according to the size. They have the specific
numbers in the books of accounts.
c. Presenting a questionnaire for the collection of primary data
Questionnaire: The questionnaires are to be prepared by the professional methodologists
so it can cover all the questions as according to the details being asked. It is helpful in the
systematic survey, with the collected information. It should include the questions related with
the infrastructure facilities, the refreshment, and the technologies are provided. The students
should be asked about the services they have been benefited with and what are the changes
should be made related with the classroom interior, academics, and the learning methods. It
builds up the communication relationship with students.
Paraphrase This Document
Need a fresh take? Get an instant paraphrase of this document with our AI Paraphraser
Name…..
Age……
Gender…..
Type of course…….
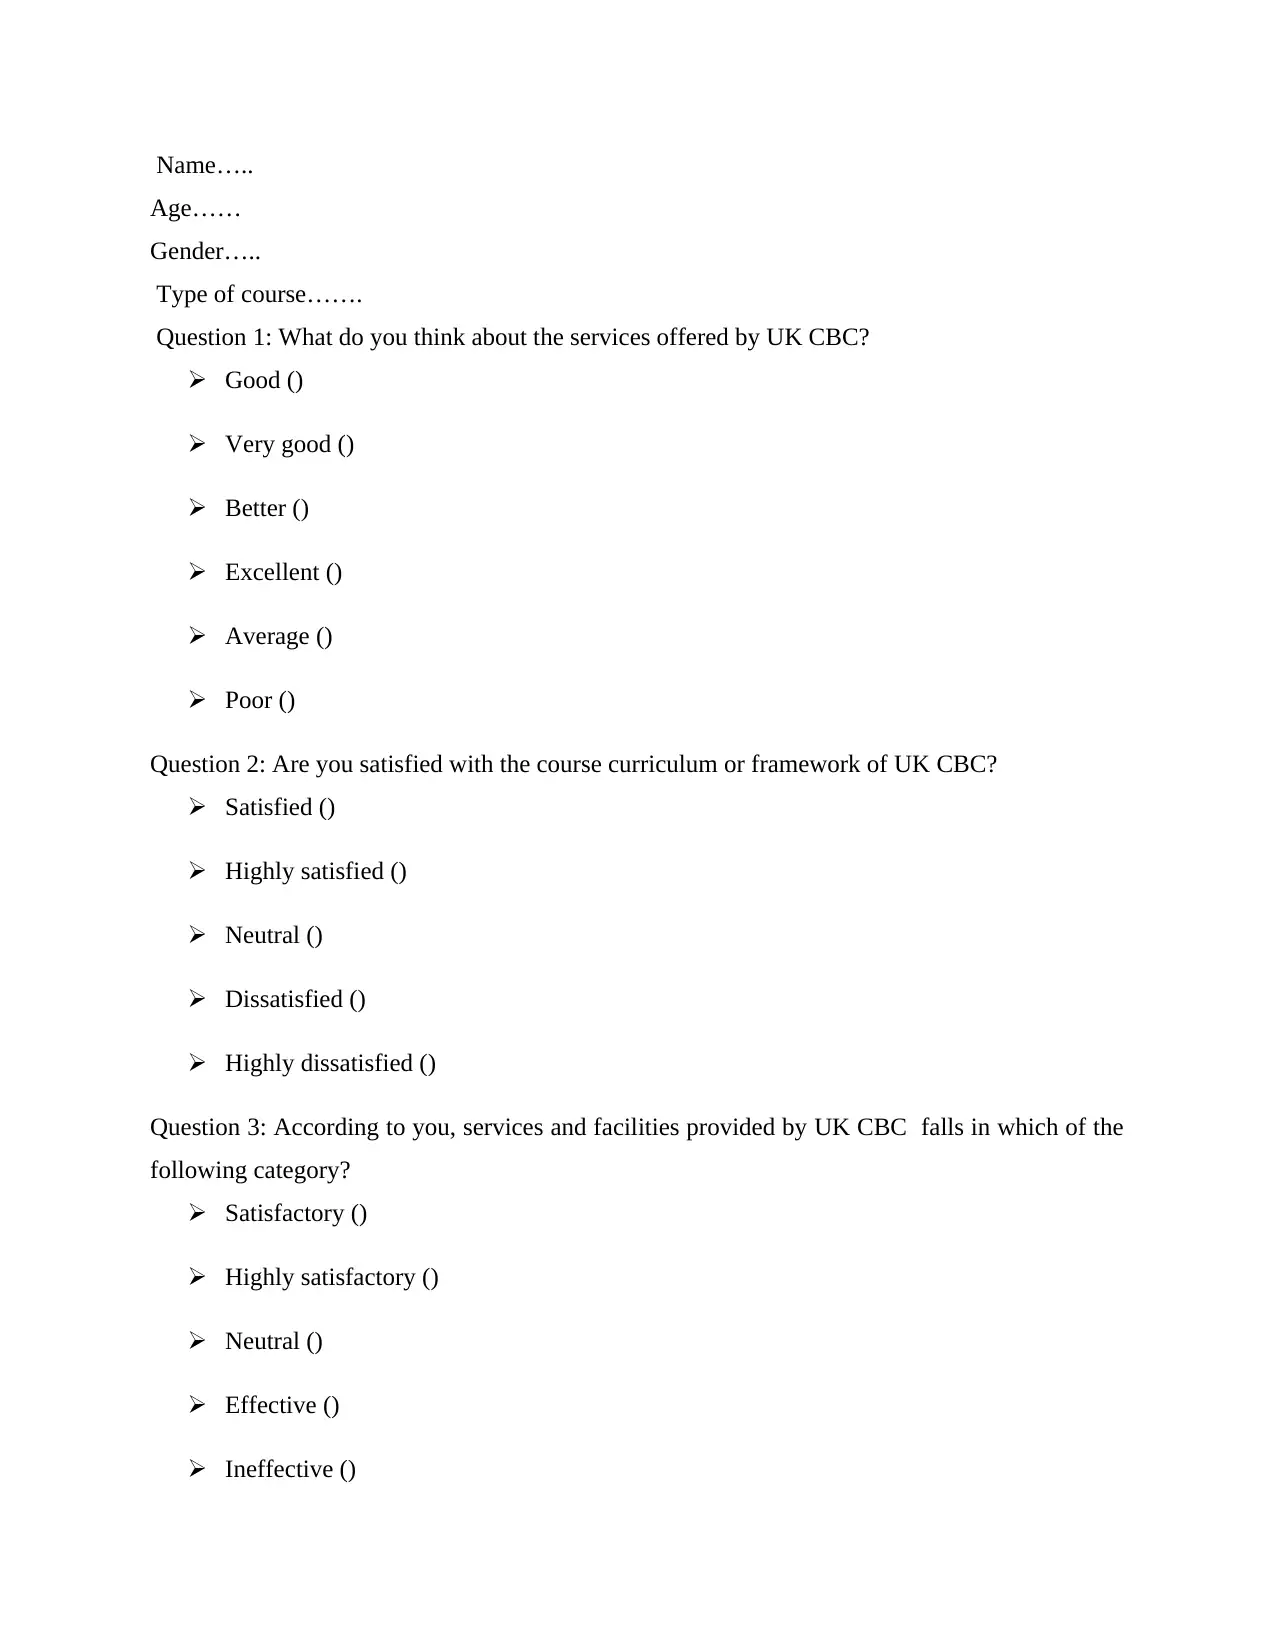
Question 1: What do you think about the services offered by UK CBC?
Good ()
Very good ()
Better ()
Excellent ()
Average ()
Poor ()
Question 2: Are you satisfied with the course curriculum or framework of UK CBC?
Satisfied ()
Highly satisfied ()
Neutral ()
Dissatisfied ()
Highly dissatisfied ()
Question 3: According to you, services and facilities provided by UK CBC falls in which of the
following category?
Satisfactory ()
Highly satisfactory ()
Neutral ()
Effective ()
Ineffective ()
Age……
Gender…..
Type of course…….
Question 1: What do you think about the services offered by UK CBC?
Good ()
Very good ()
Better ()
Excellent ()
Average ()
Poor ()
Question 2: Are you satisfied with the course curriculum or framework of UK CBC?
Satisfied ()
Highly satisfied ()
Neutral ()
Dissatisfied ()
Highly dissatisfied ()
Question 3: According to you, services and facilities provided by UK CBC falls in which of the
following category?
Satisfactory ()
Highly satisfactory ()
Neutral ()
Effective ()
Ineffective ()
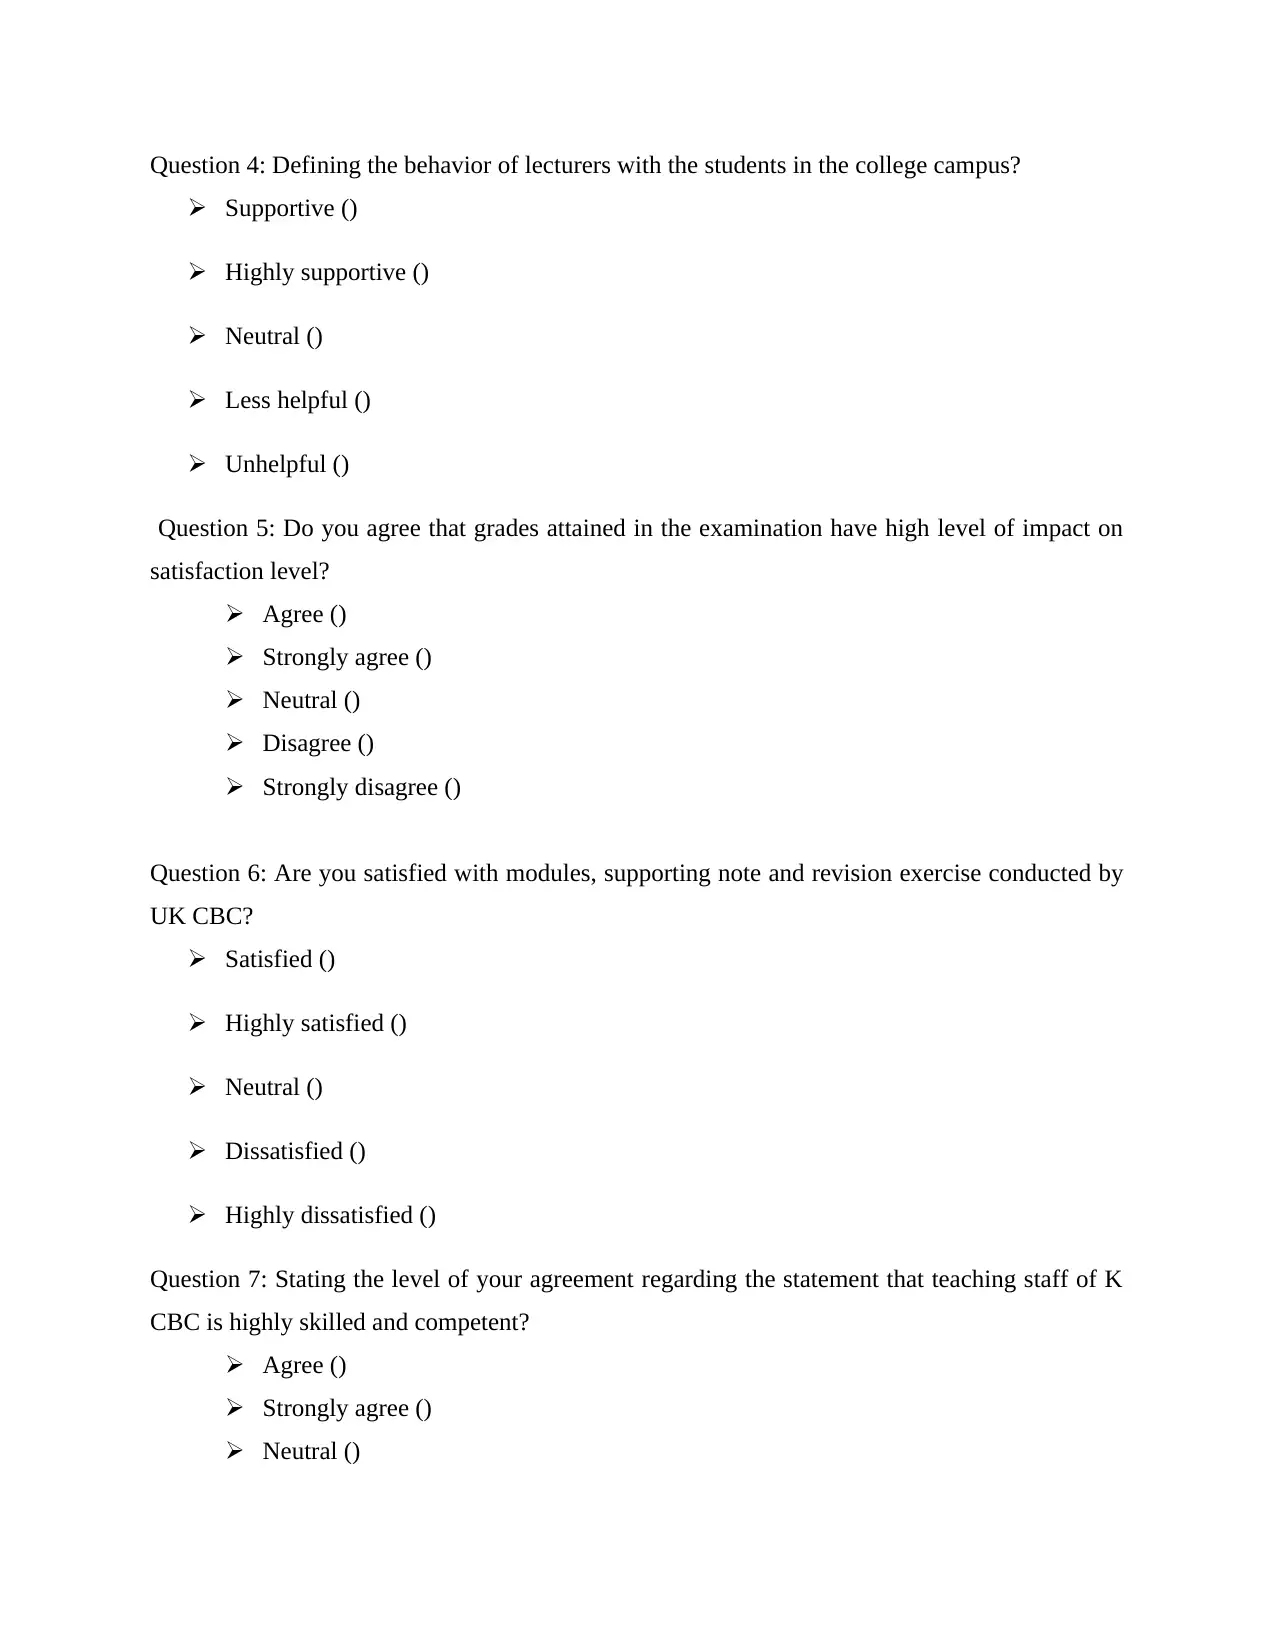
Question 4: Defining the behavior of lecturers with the students in the college campus?
Supportive ()
Highly supportive ()
Neutral ()
Less helpful ()
Unhelpful ()
Question 5: Do you agree that grades attained in the examination have high level of impact on
satisfaction level?
Agree ()
Strongly agree ()
Neutral ()
Disagree ()
Strongly disagree ()
Question 6: Are you satisfied with modules, supporting note and revision exercise conducted by
UK CBC?
Satisfied ()
Highly satisfied ()
Neutral ()
Dissatisfied ()
Highly dissatisfied ()
Question 7: Stating the level of your agreement regarding the statement that teaching staff of K
CBC is highly skilled and competent?
Agree ()
Strongly agree ()
Neutral ()
⊘ This is a preview!⊘
Do you want full access?
Subscribe today to unlock all pages.
Trusted by 1+ million students worldwide
Disagree ()
Strongly disagree ()
Question 8: Recommendation section ……
TASK 2
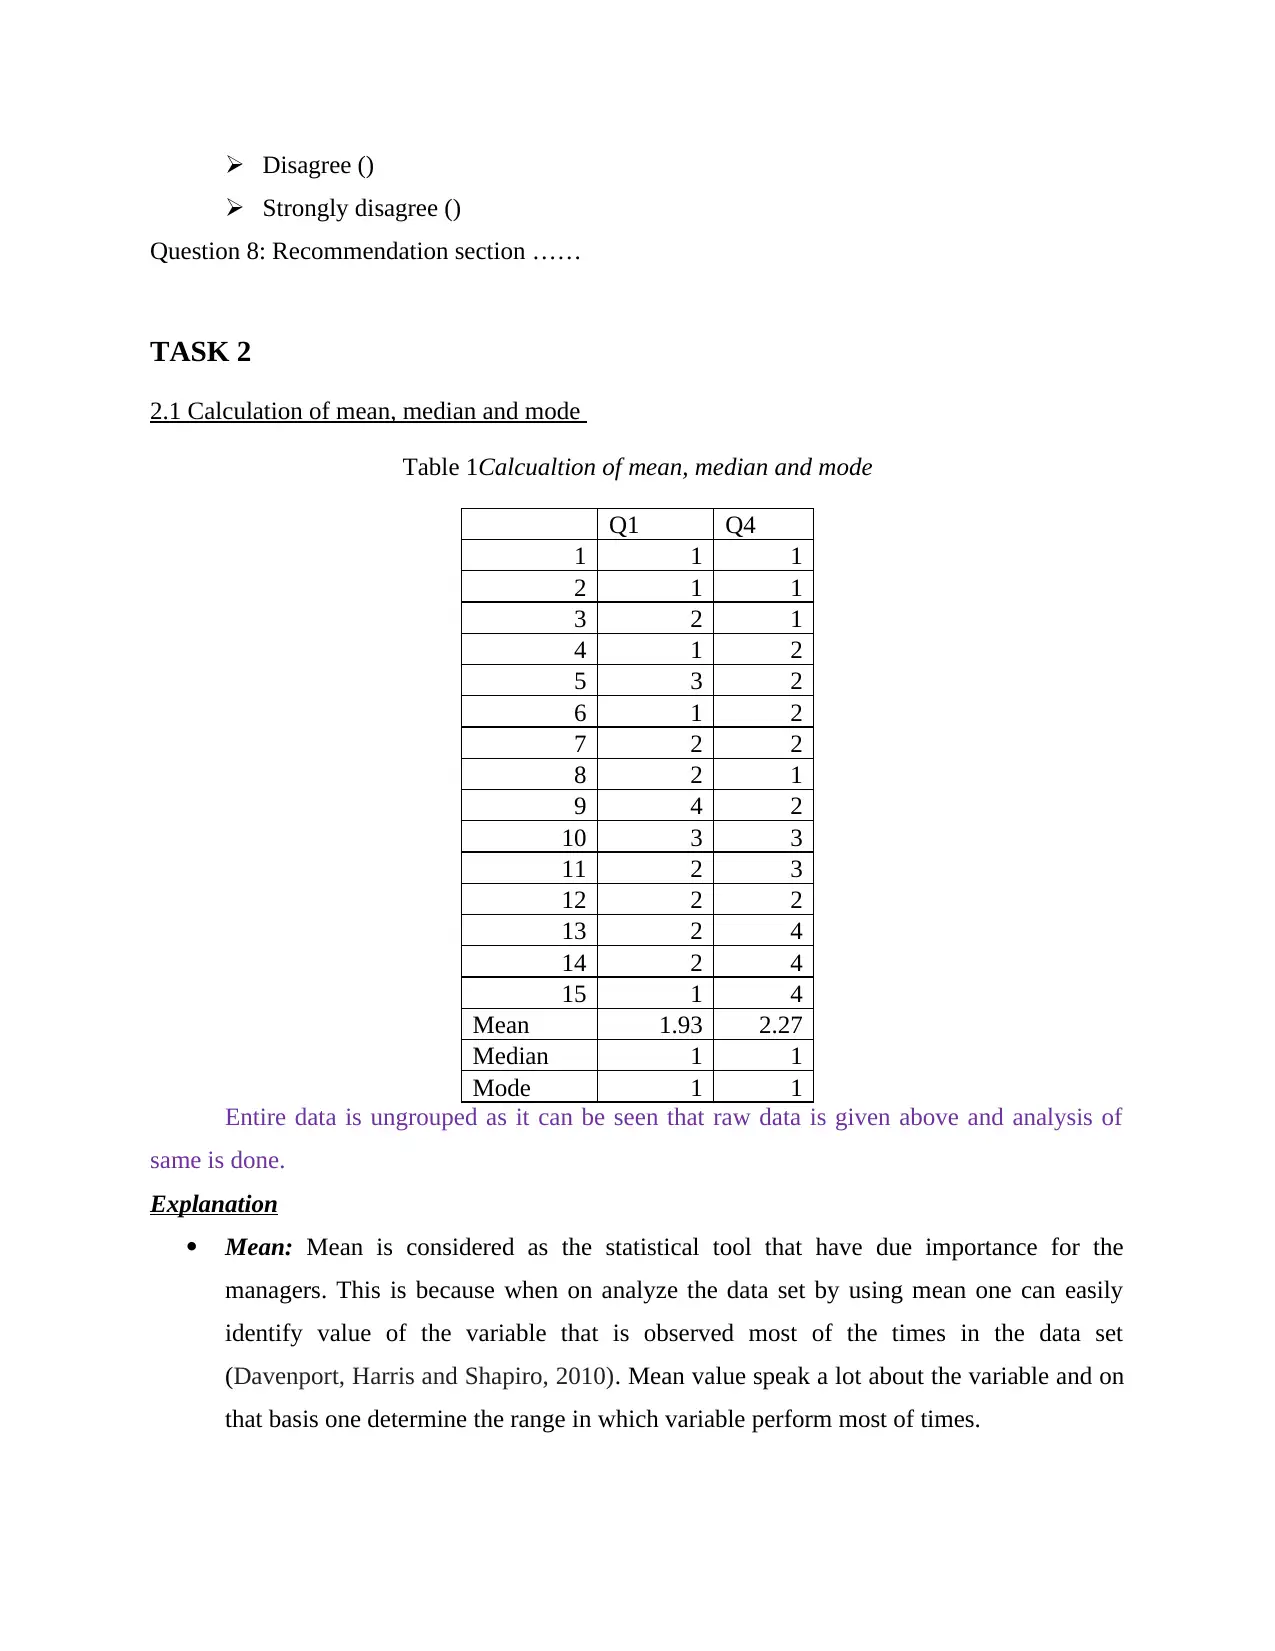
2.1 Calculation of mean, median and mode
Table 1Calcualtion of mean, median and mode
Q1 Q4
1 1 1
2 1 1
3 2 1
4 1 2
5 3 2
6 1 2
7 2 2
8 2 1
9 4 2
10 3 3
11 2 3
12 2 2
13 2 4
14 2 4
15 1 4
Mean 1.93 2.27
Median 1 1
Mode 1 1
Entire data is ungrouped as it can be seen that raw data is given above and analysis of
same is done.
Explanation
Mean: Mean is considered as the statistical tool that have due importance for the
managers. This is because when on analyze the data set by using mean one can easily
identify value of the variable that is observed most of the times in the data set
(Davenport, Harris and Shapiro, 2010). Mean value speak a lot about the variable and on
that basis one determine the range in which variable perform most of times.
Strongly disagree ()
Question 8: Recommendation section ……
TASK 2
2.1 Calculation of mean, median and mode
Table 1Calcualtion of mean, median and mode
Q1 Q4
1 1 1
2 1 1
3 2 1
4 1 2
5 3 2
6 1 2
7 2 2
8 2 1
9 4 2
10 3 3
11 2 3
12 2 2
13 2 4
14 2 4
15 1 4
Mean 1.93 2.27
Median 1 1
Mode 1 1
Entire data is ungrouped as it can be seen that raw data is given above and analysis of
same is done.
Explanation
Mean: Mean is considered as the statistical tool that have due importance for the
managers. This is because when on analyze the data set by using mean one can easily
identify value of the variable that is observed most of the times in the data set
(Davenport, Harris and Shapiro, 2010). Mean value speak a lot about the variable and on
that basis one determine the range in which variable perform most of times.
Paraphrase This Document
Need a fresh take? Get an instant paraphrase of this document with our AI Paraphraser
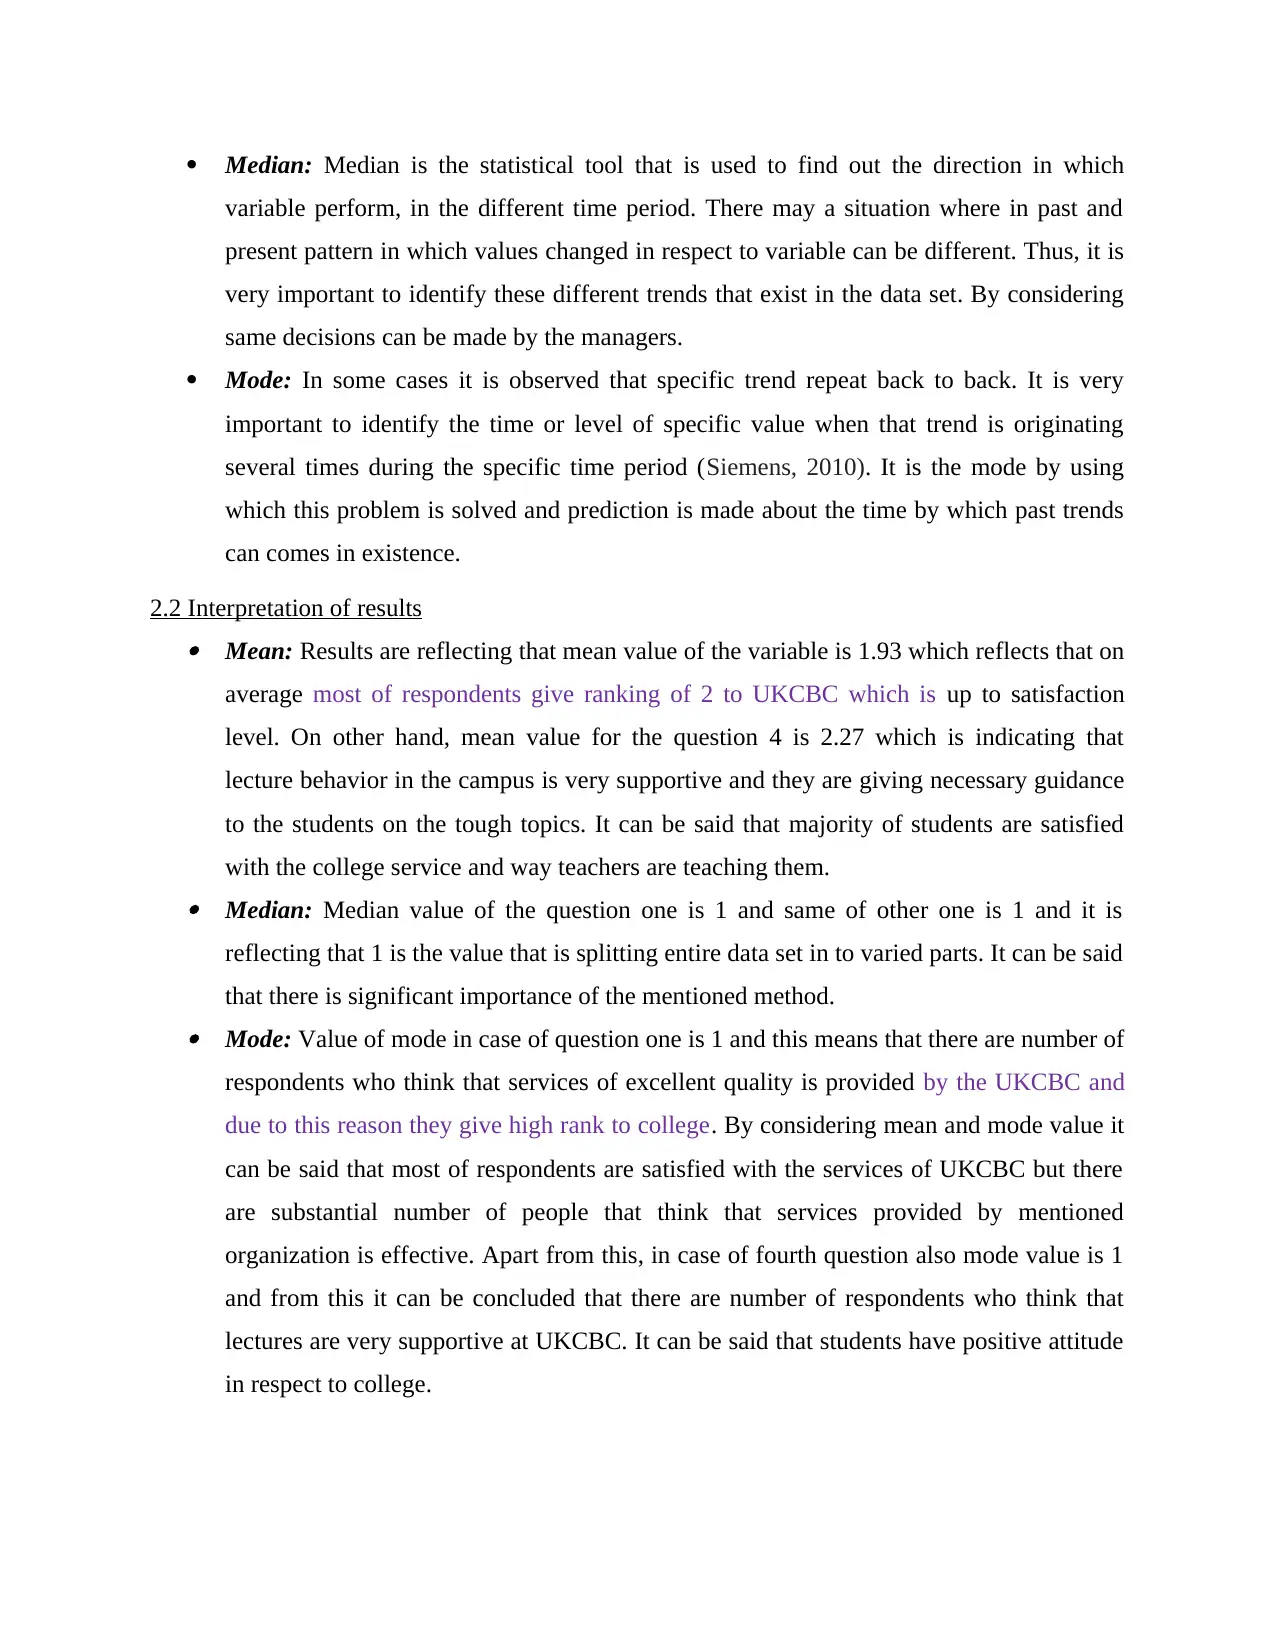
Median: Median is the statistical tool that is used to find out the direction in which
variable perform, in the different time period. There may a situation where in past and
present pattern in which values changed in respect to variable can be different. Thus, it is
very important to identify these different trends that exist in the data set. By considering
same decisions can be made by the managers.
Mode: In some cases it is observed that specific trend repeat back to back. It is very
important to identify the time or level of specific value when that trend is originating
several times during the specific time period (Siemens, 2010). It is the mode by using
which this problem is solved and prediction is made about the time by which past trends
can comes in existence.
2.2 Interpretation of results Mean: Results are reflecting that mean value of the variable is 1.93 which reflects that on
average most of respondents give ranking of 2 to UKCBC which is up to satisfaction
level. On other hand, mean value for the question 4 is 2.27 which is indicating that
lecture behavior in the campus is very supportive and they are giving necessary guidance
to the students on the tough topics. It can be said that majority of students are satisfied
with the college service and way teachers are teaching them. Median: Median value of the question one is 1 and same of other one is 1 and it is
reflecting that 1 is the value that is splitting entire data set in to varied parts. It can be said
that there is significant importance of the mentioned method. Mode: Value of mode in case of question one is 1 and this means that there are number of
respondents who think that services of excellent quality is provided by the UKCBC and
due to this reason they give high rank to college. By considering mean and mode value it
can be said that most of respondents are satisfied with the services of UKCBC but there
are substantial number of people that think that services provided by mentioned
organization is effective. Apart from this, in case of fourth question also mode value is 1
and from this it can be concluded that there are number of respondents who think that
lectures are very supportive at UKCBC. It can be said that students have positive attitude
in respect to college.
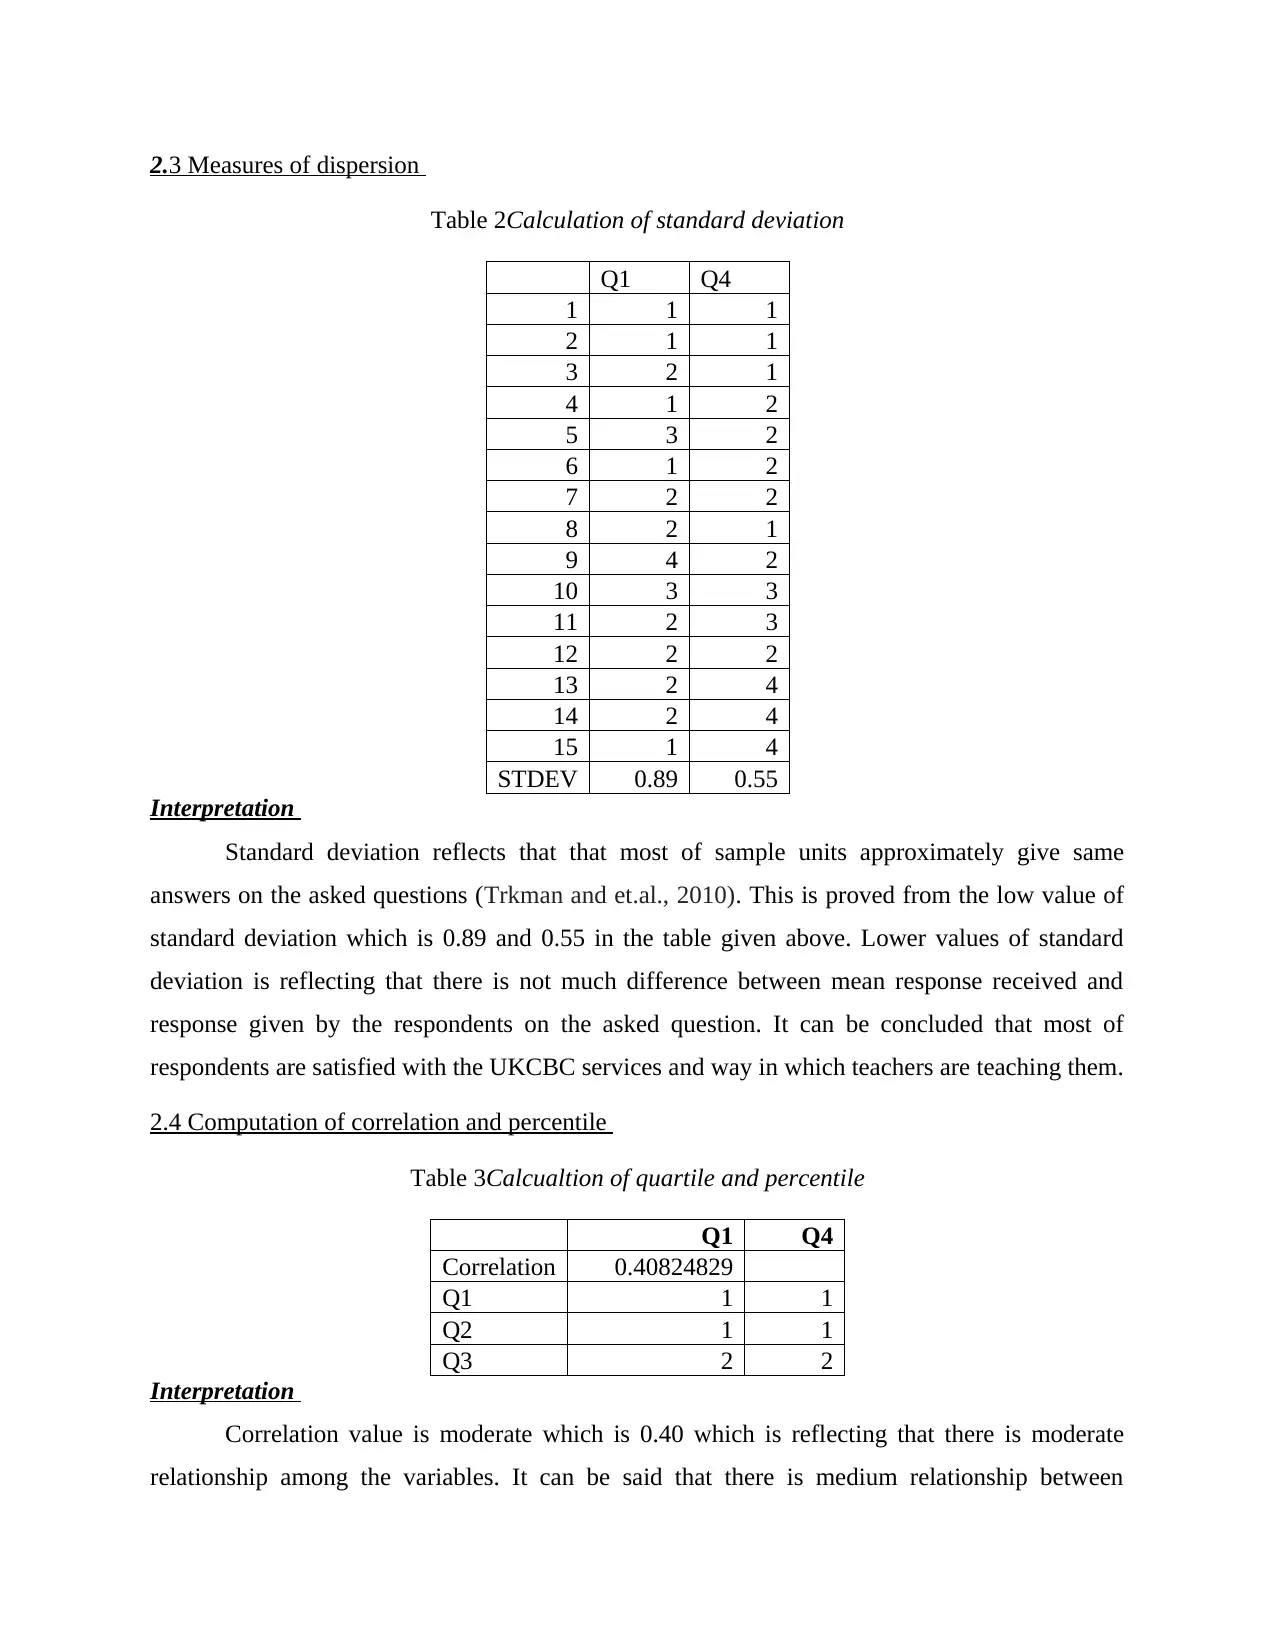
2.3 Measures of dispersion
Table 2Calculation of standard deviation
Q1 Q4
1 1 1
2 1 1
3 2 1
4 1 2
5 3 2
6 1 2
7 2 2
8 2 1
9 4 2
10 3 3
11 2 3
12 2 2
13 2 4
14 2 4
15 1 4
STDEV 0.89 0.55
Interpretation
Standard deviation reflects that that most of sample units approximately give same
answers on the asked questions (Trkman and et.al., 2010). This is proved from the low value of
standard deviation which is 0.89 and 0.55 in the table given above. Lower values of standard
deviation is reflecting that there is not much difference between mean response received and
response given by the respondents on the asked question. It can be concluded that most of
respondents are satisfied with the UKCBC services and way in which teachers are teaching them.
2.4 Computation of correlation and percentile
Table 3Calcualtion of quartile and percentile
Q1 Q4
Correlation 0.40824829
Q1 1 1
Q2 1 1
Q3 2 2
Interpretation
Correlation value is moderate which is 0.40 which is reflecting that there is moderate
relationship among the variables. It can be said that there is medium relationship between
⊘ This is a preview!⊘
Do you want full access?
Subscribe today to unlock all pages.
Trusted by 1+ million students worldwide
1 out of 22
Related Documents


Your All-in-One AI-Powered Toolkit for Academic Success.
+13062052269
info@desklib.com
Available 24*7 on WhatsApp / Email
![[object Object]](/_next/static/media/star-bottom.7253800d.svg)
Unlock your academic potential
Copyright © 2020–2026 A2Z Services. All Rights Reserved. Developed and managed by ZUCOL.