Business Decision Making: Analysis of UKCBC Student Survey Report
VerifiedAdded on 2020/01/07
|23
|4715
|186
Report
AI Summary
This report, prepared for the Quality Assurance Agency (QAA) review of UK College of Business and Computing (UKCBC), analyzes a student survey designed to assess student experiences and satisfaction. The report details the planning of data collection across UKCBC campuses, including the survey methodology, sampling framework, and questionnaire design. It explores data analysis techniques such as mean, median, and mode, along with measures of dispersion, percentile calculations, and correlation analysis to interpret the survey results. Furthermore, the report presents conclusions and findings derived from the survey responses, culminating in a formal report structure. The assignment also incorporates the use of information processing tools and project management in MS Project to determine the critical path. Finally, it applies financial tools, including net present value and internal rate of return, to advise UKCBC on the best investment plans, providing a comprehensive overview of business decision-making processes within the context of the college's performance and future strategies.
Business Decision
Making
Contents
1
Making
Contents
1
Paraphrase This Document
Need a fresh take? Get an instant paraphrase of this document with our AI Paraphraser
INTRODUCTION...........................................................................................................................4
TASK 1............................................................................................................................................4
1.1 Plan for collecting data from students across all campuses...................................................4
1.2 Survey methodology and sampling framework.....................................................................5
1.3 Questionnaire.........................................................................................................................6
Task 2...............................................................................................................................................7
2.1 Information for decision making...........................................................................................7
2.2 Interpretation of the values of the mean, median and mode..................................................8
2.3 Measures of dispersion..........................................................................................................9
2.4 Calculation of percentile and correlation...............................................................................9
TASK 3..........................................................................................................................................11
3.1 Conclusions On Survey.......................................................................................................11
3.2 Students Responses..............................................................................................................12
3.3 Findings...............................................................................................................................12
3.4 Formal Report......................................................................................................................12
TASK 4..........................................................................................................................................14
(A). Using information processing tool and its usefulness for UKCBC...................................14
(B). Preparing a project plan in MS project management to determine the critical path..........14
(C). Using financial tools for decision-making to advice UKCBC about the best investment
plan.............................................................................................................................................16
(1). Calculation of net present value..........................................................................................17
(2) Calculation of internal rate of return....................................................................................17
CONCLUSION..............................................................................................................................18
REFERENCES..............................................................................................................................19
2
INTRODUCTION
Decision making in business organization is crucial for proper management of operations
and carrying on entity efficiently. In this regard, different tools and techniques included such as
analyzing actual performance of firm further preparing strategies on the for effectiveness of
organization and getting solutions to reduce occurs at workplace. The current study is based on
significance of decision making process in reference of UK college of Business and Computing
(UKCBC) which is going to be inspectected by Quality Assurance Agency (QAA) in few
months. Therefore, analyzing students' satisfaction and experiences with college entity's
performance.
In this regard, different research methods and proper survey for collecting data is to be
described. However, graphical presentation for determining respondents' views are to be
expressed in systematic manner through this assignment. Along with this, investment appraisal
tools for selecting best project for effectiveness of college is to introduced. Thus, students are
able to understand significance of business decision making process regarding college's
efficiency through studying this report.
TASK 1
1.1Differennt way through which data was collected.
UKCBC is going to be reviewed by QAA in next coming months therefore, planning is
created for analyzing students' views on performance of college. In accordance to this, data are
collected through different methods at primary and secondary level. However, from all campuses
of college, students will be selected for sharing their opinions by conducting survey and
gathering information in systematic manner. Survey method was used throughout the process to
collect data, The researcher prepared questionnaire related to program (Lewis, 2015). Therefore,
proper information related to students' views can be collected that presents college entity's
performance. In addition to this, it is required for analyst to prepare questionnaire as well
collecting students' opinions efficiently.
For primary data collection, A survey was conduct to achieve the information researcher
used door to door, face to face and may way through which he can accomplish his work. . The
collected ddata give the report on the present condition of entity.. It has no link with past
3
⊘ This is a preview!⊘
Do you want full access?
Subscribe today to unlock all pages.
Trusted by 1+ million students worldwide
operations and future intentions. On the other side, collection of secondary data was based on
the analyses of performance tools, that presents financial and non-economic position of entity
including this recognizing government publications as well other components that shows
performance of UKCBC. Thus, researcher can accomplish research project by using these factors
through primary and secondary data collection. It will be effective to analyze performance of
organization therefore further decision making can be proceed for improving quality services of
company at high level (Simon, 2015).
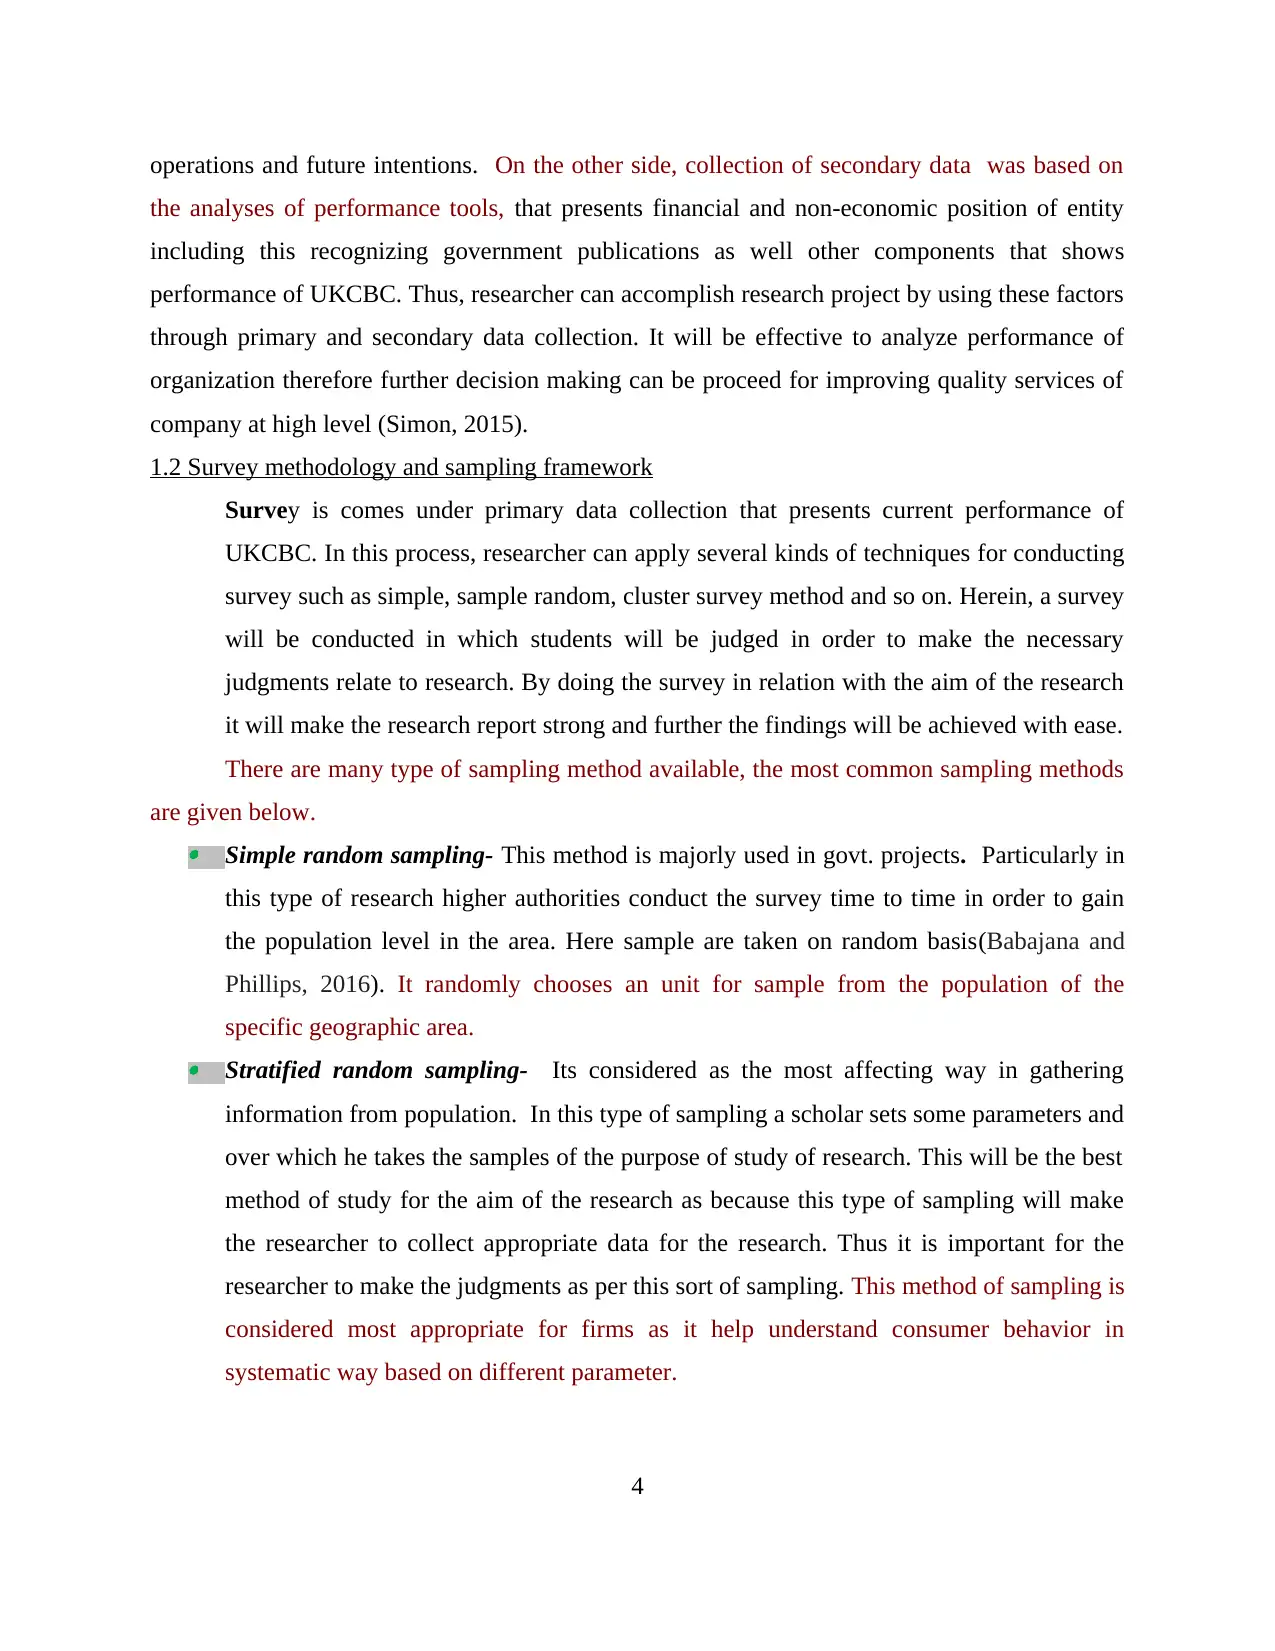
1.2 Survey methodology and sampling framework
Survey is comes under primary data collection that presents current performance of
UKCBC. In this process, researcher can apply several kinds of techniques for conducting
survey such as simple, sample random, cluster survey method and so on. Herein, a survey
will be conducted in which students will be judged in order to make the necessary
judgments relate to research. By doing the survey in relation with the aim of the research
it will make the research report strong and further the findings will be achieved with ease.
There are many type of sampling method available, the most common sampling methods
are given below. Simple random sampling- This method is majorly used in govt. projects. Particularly in
this type of research higher authorities conduct the survey time to time in order to gain
the population level in the area. Here sample are taken on random basis(Babajana and
Phillips, 2016). It randomly chooses an unit for sample from the population of the
specific geographic area. Stratified random sampling- Its considered as the most affecting way in gathering
information from population. In this type of sampling a scholar sets some parameters and
over which he takes the samples of the purpose of study of research. This will be the best
method of study for the aim of the research as because this type of sampling will make
the researcher to collect appropriate data for the research. Thus it is important for the
researcher to make the judgments as per this sort of sampling. This method of sampling is
considered most appropriate for firms as it help understand consumer behavior in
systematic way based on different parameter.
4
the analyses of performance tools, that presents financial and non-economic position of entity
including this recognizing government publications as well other components that shows
performance of UKCBC. Thus, researcher can accomplish research project by using these factors
through primary and secondary data collection. It will be effective to analyze performance of
organization therefore further decision making can be proceed for improving quality services of
company at high level (Simon, 2015).
1.2 Survey methodology and sampling framework
Survey is comes under primary data collection that presents current performance of
UKCBC. In this process, researcher can apply several kinds of techniques for conducting
survey such as simple, sample random, cluster survey method and so on. Herein, a survey
will be conducted in which students will be judged in order to make the necessary
judgments relate to research. By doing the survey in relation with the aim of the research
it will make the research report strong and further the findings will be achieved with ease.
There are many type of sampling method available, the most common sampling methods
are given below. Simple random sampling- This method is majorly used in govt. projects. Particularly in
this type of research higher authorities conduct the survey time to time in order to gain
the population level in the area. Here sample are taken on random basis(Babajana and
Phillips, 2016). It randomly chooses an unit for sample from the population of the
specific geographic area. Stratified random sampling- Its considered as the most affecting way in gathering
information from population. In this type of sampling a scholar sets some parameters and
over which he takes the samples of the purpose of study of research. This will be the best
method of study for the aim of the research as because this type of sampling will make
the researcher to collect appropriate data for the research. Thus it is important for the
researcher to make the judgments as per this sort of sampling. This method of sampling is
considered most appropriate for firms as it help understand consumer behavior in
systematic way based on different parameter.
4
Paraphrase This Document
Need a fresh take? Get an instant paraphrase of this document with our AI Paraphraser
Cluster sampling- Cluster type is similar to the stratified random sampling. In cluster
sampling one big geographical area is selected and divided into different small areas from
which the samples are selected on the basis of the purpose of the research(Babajana and
Phillips, 2016). This type of sampling is appropriate where the data collection is to be
done on the different demographic areas and locality.
Convenience sampling – Convenience sampling is the most common and simple way of
doing and gathering the samples, as it includes gathering the sample with the view point of
the researcher and on the basis of his/her experiences researcher will collect the samples. As
this method is has its own implications for the purpose of understanding the behaviour of
students this method will not be useful(Babajana and Phillips, 2016).
In this regard, sampling framework is for selecting respondents in different ways and
gathering information through analyzing different views and opinions of students.
1.3 Questionnaire
Geographical area
Name.......
Age......
Gender......
1. How frequent do you visit UKCBC’s ?
1-2 times
3-4 times
5-6 times
More than 6 times
2. What is the level satisfaction at UKCBC’s ?
Satisfied
Highly satisfied
Dissatisfied
Highly dissatisfied
3. Which of the below given factors drives you more towards going to UKCBC’s ?
Price
Quality
5
Waiting time
Other
4. Do Professors of UKCBC’s gives response to queries of Students?
Yes
No
5. Please rate the teaching at UKCBC’s ?
Average
Good
Excellent
8. Your recommendation regarding improvements that needs to be made in Teaching of
UKCBC’s
….........
TASK 2
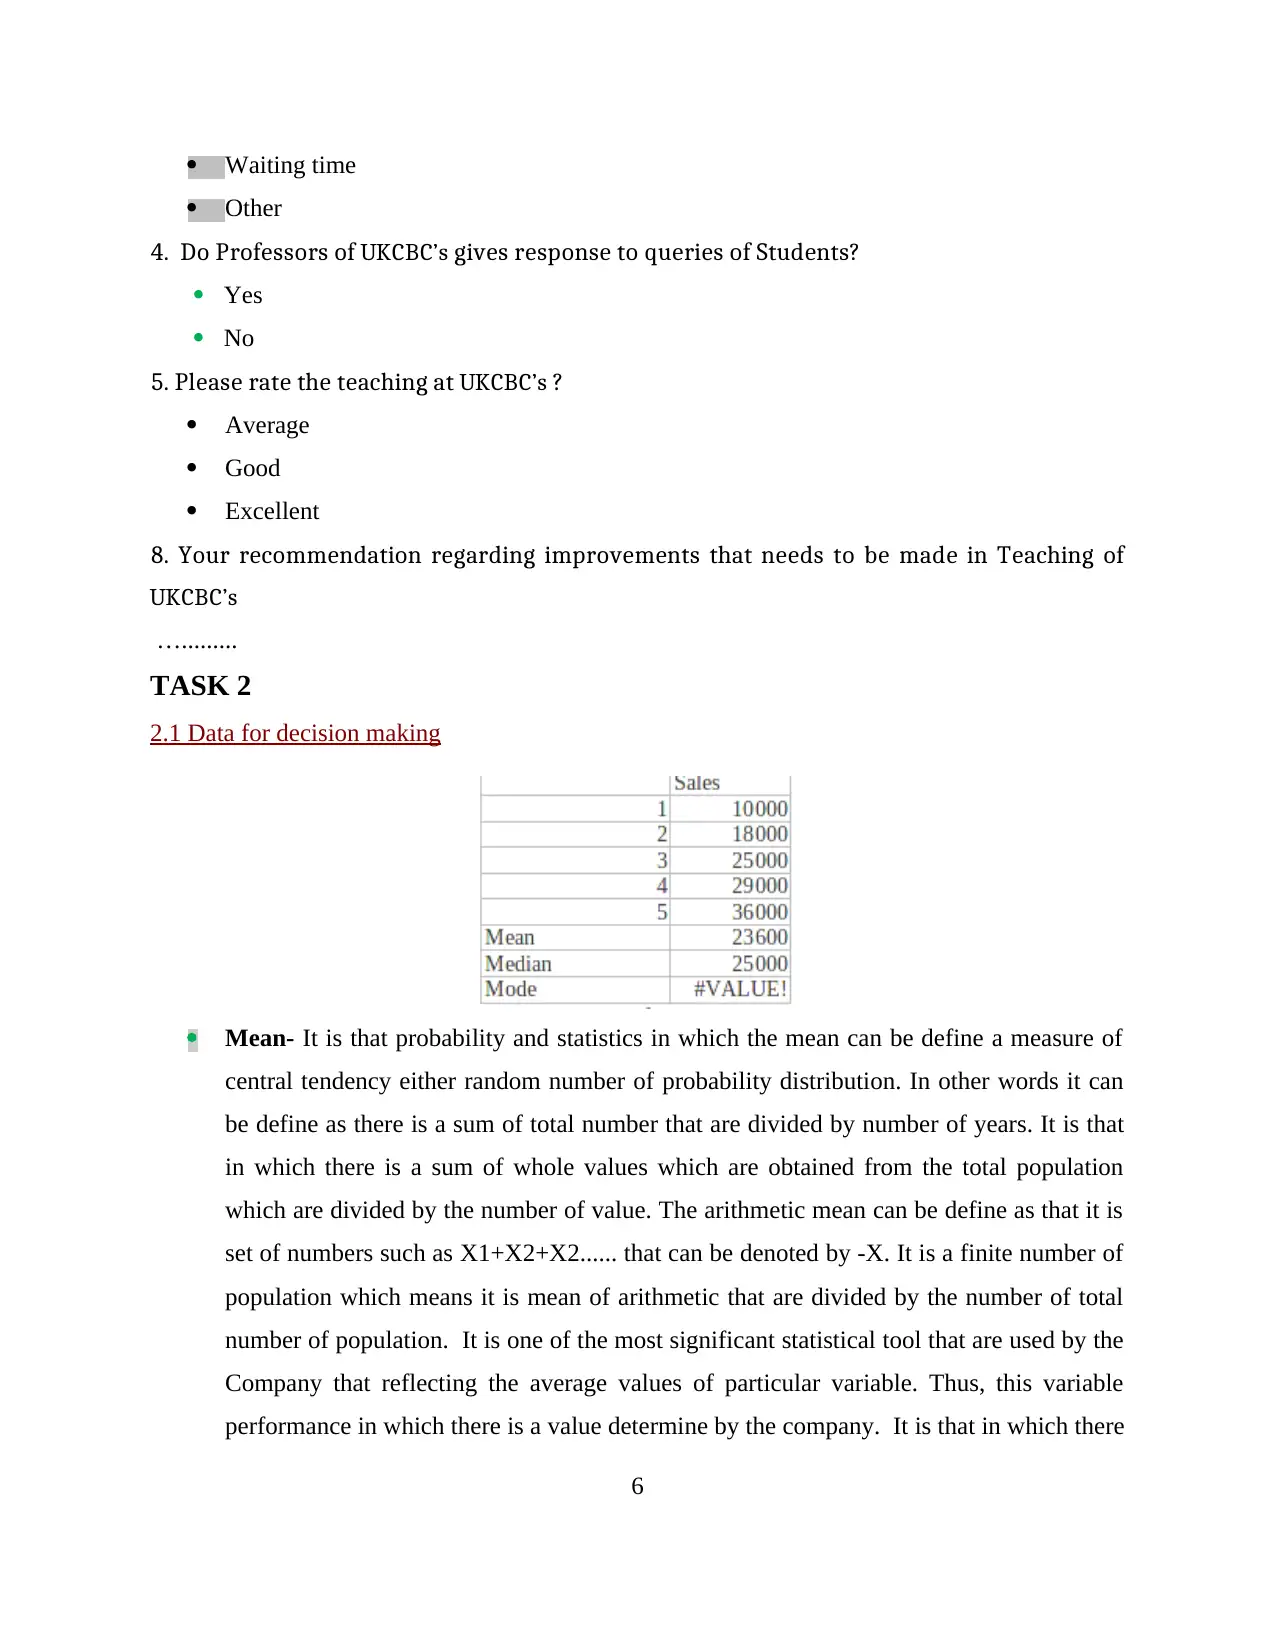
2.1 Data for decision making
Mean- It is that probability and statistics in which the mean can be define a measure of
central tendency either random number of probability distribution. In other words it can
be define as there is a sum of total number that are divided by number of years. It is that
in which there is a sum of whole values which are obtained from the total population
which are divided by the number of value. The arithmetic mean can be define as that it is
set of numbers such as X1+X2+X2...... that can be denoted by -X. It is a finite number of
population which means it is mean of arithmetic that are divided by the number of total
number of population. It is one of the most significant statistical tool that are used by the
Company that reflecting the average values of particular variable. Thus, this variable
performance in which there is a value determine by the company. It is that in which there
6
Other
4. Do Professors of UKCBC’s gives response to queries of Students?
Yes
No
5. Please rate the teaching at UKCBC’s ?
Average
Good
Excellent
8. Your recommendation regarding improvements that needs to be made in Teaching of
UKCBC’s
….........
TASK 2
2.1 Data for decision making
Mean- It is that probability and statistics in which the mean can be define a measure of
central tendency either random number of probability distribution. In other words it can
be define as there is a sum of total number that are divided by number of years. It is that
in which there is a sum of whole values which are obtained from the total population
which are divided by the number of value. The arithmetic mean can be define as that it is
set of numbers such as X1+X2+X2...... that can be denoted by -X. It is a finite number of
population which means it is mean of arithmetic that are divided by the number of total
number of population. It is one of the most significant statistical tool that are used by the
Company that reflecting the average values of particular variable. Thus, this variable
performance in which there is a value determine by the company. It is that in which there
6
⊘ This is a preview!⊘
Do you want full access?
Subscribe today to unlock all pages.
Trusted by 1+ million students worldwide
is a sum of whole values which are obtained from the total population which are divided
by the number of value.
Median- It is also one of the most important tool of statistical which can be define as a
descriptive tool under which the overall data are divided into two categories. Thus,
adopting this method in which it analysis these two categorized parts of performance of
variable in which it can be defined in same. Further, there is different data sets have a
different trend. Thus, it is necessary to identify these different trends of variable
performance which shows that it is good or bad. Thereafter, if the variables show profits
after that these values after and before median value which can be identifying the gap
among that are needed to measured. Thus, it aid in to discover whether the performance
was good or bad for the set data
Mode- It is statistical tool that explain the descriptive analysis that show the value that
are again repeated on the data set. Thus, if the data is reiterating in the set of data which
can be stated as there is particular data trend that are mainly occurs several times in the
data set. In regard to this the prediction are mainly based upon the future time period that
are mainly made up by the organization. Therefore, it can be stated that is one of the
important statistical tool that are used by the most of the firm business.
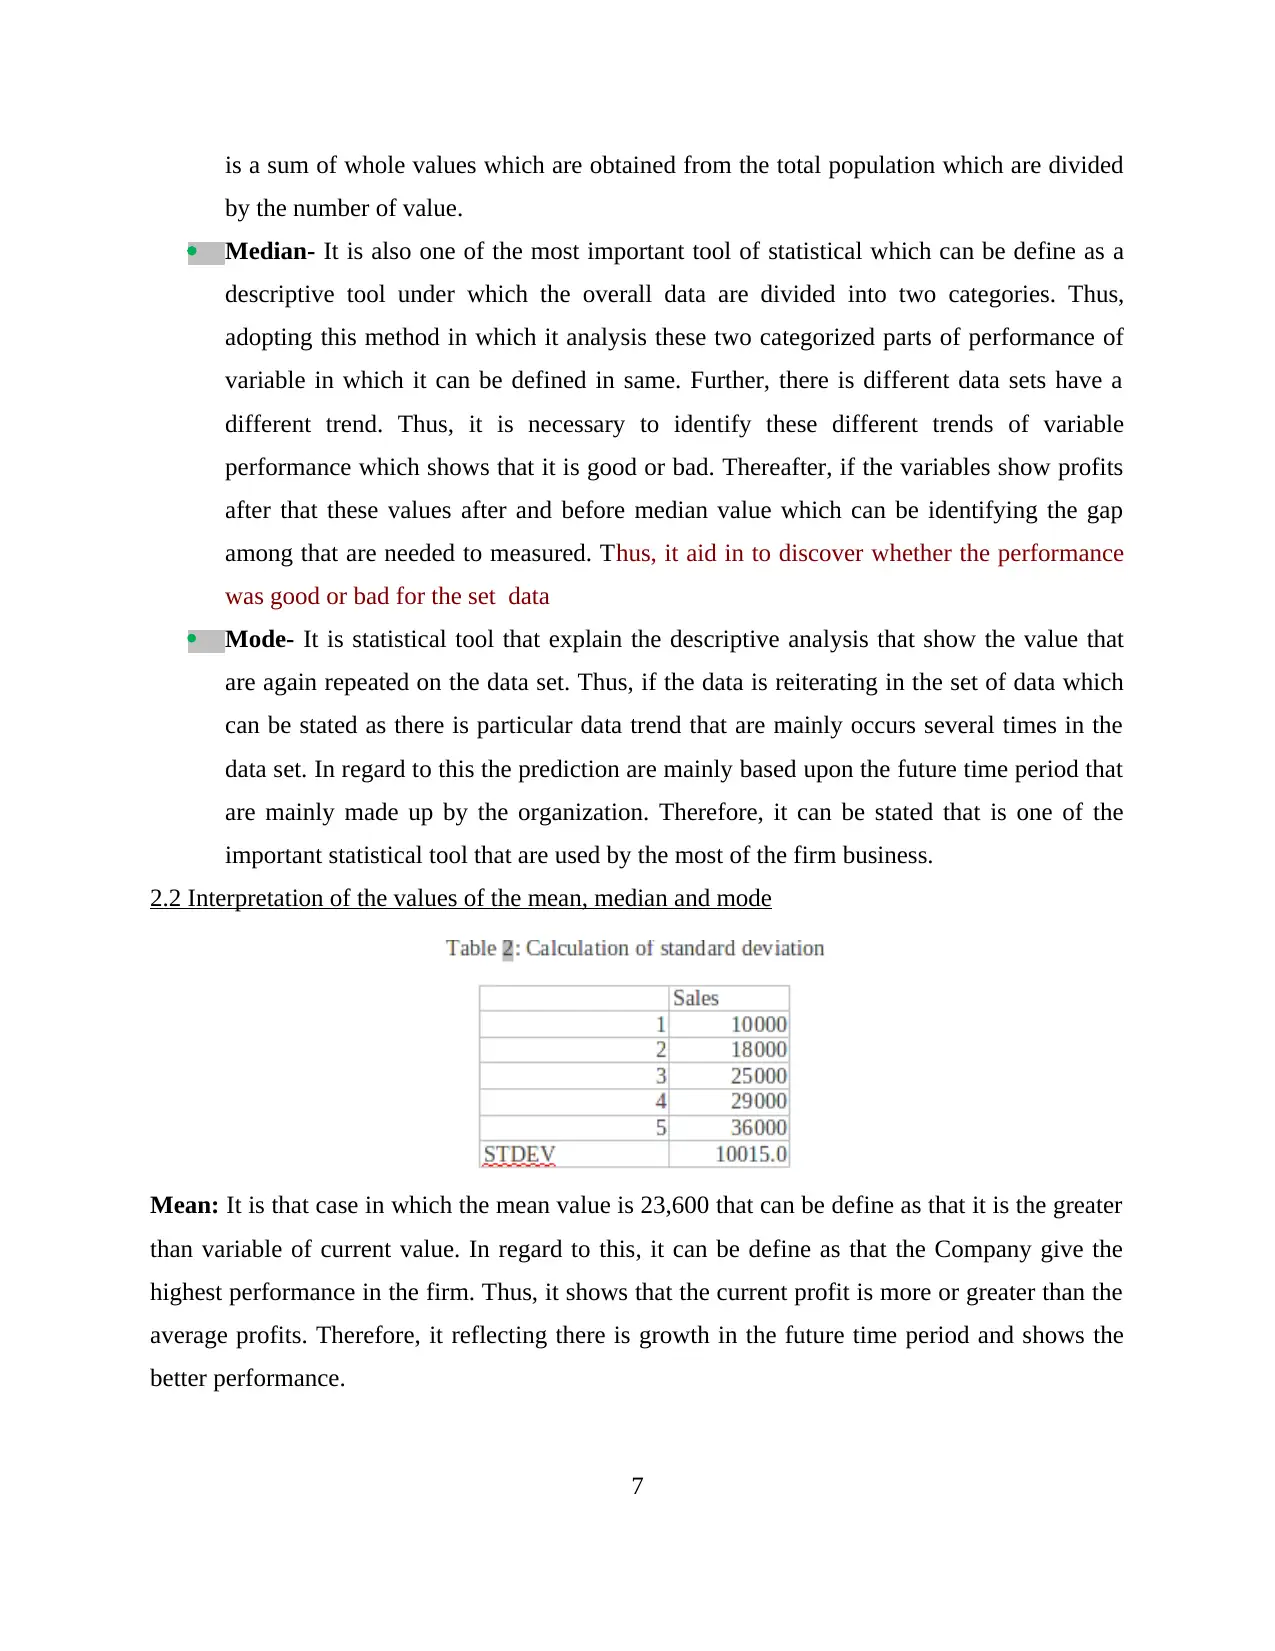
2.2 Interpretation of the values of the mean, median and mode
Mean: It is that case in which the mean value is 23,600 that can be define as that it is the greater
than variable of current value. In regard to this, it can be define as that the Company give the
highest performance in the firm. Thus, it shows that the current profit is more or greater than the
average profits. Therefore, it reflecting there is growth in the future time period and shows the
better performance.
7
by the number of value.
Median- It is also one of the most important tool of statistical which can be define as a
descriptive tool under which the overall data are divided into two categories. Thus,
adopting this method in which it analysis these two categorized parts of performance of
variable in which it can be defined in same. Further, there is different data sets have a
different trend. Thus, it is necessary to identify these different trends of variable
performance which shows that it is good or bad. Thereafter, if the variables show profits
after that these values after and before median value which can be identifying the gap
among that are needed to measured. Thus, it aid in to discover whether the performance
was good or bad for the set data
Mode- It is statistical tool that explain the descriptive analysis that show the value that
are again repeated on the data set. Thus, if the data is reiterating in the set of data which
can be stated as there is particular data trend that are mainly occurs several times in the
data set. In regard to this the prediction are mainly based upon the future time period that
are mainly made up by the organization. Therefore, it can be stated that is one of the
important statistical tool that are used by the most of the firm business.
2.2 Interpretation of the values of the mean, median and mode
Mean: It is that case in which the mean value is 23,600 that can be define as that it is the greater
than variable of current value. In regard to this, it can be define as that the Company give the
highest performance in the firm. Thus, it shows that the current profit is more or greater than the
average profits. Therefore, it reflecting there is growth in the future time period and shows the
better performance.
7
Paraphrase This Document
Need a fresh take? Get an instant paraphrase of this document with our AI Paraphraser
Median: It is observed from the above table and figures that in which the median is 25,000 that
can be define as a value that can be divide data that into various equal parts. Thus, it shows that
there is observing that there is sale declining the growth rate of a Company. Thus, it is the matter
of concern for the organization. Therefore, the median value from 44.4% to 28% that are decline
of sale which shows that there is reduction in the growth rate. Thus, it can be said that the
company sales increasing the that shows that there is a growth rate is reduced.
Mode: Mode value can be stated as that the value of mode is zero which can be define as there is
repetition of data in the data set. Thus, the data trend is occur said that there same trend that the
trend is a consistency. The sales of an firm is reduced.
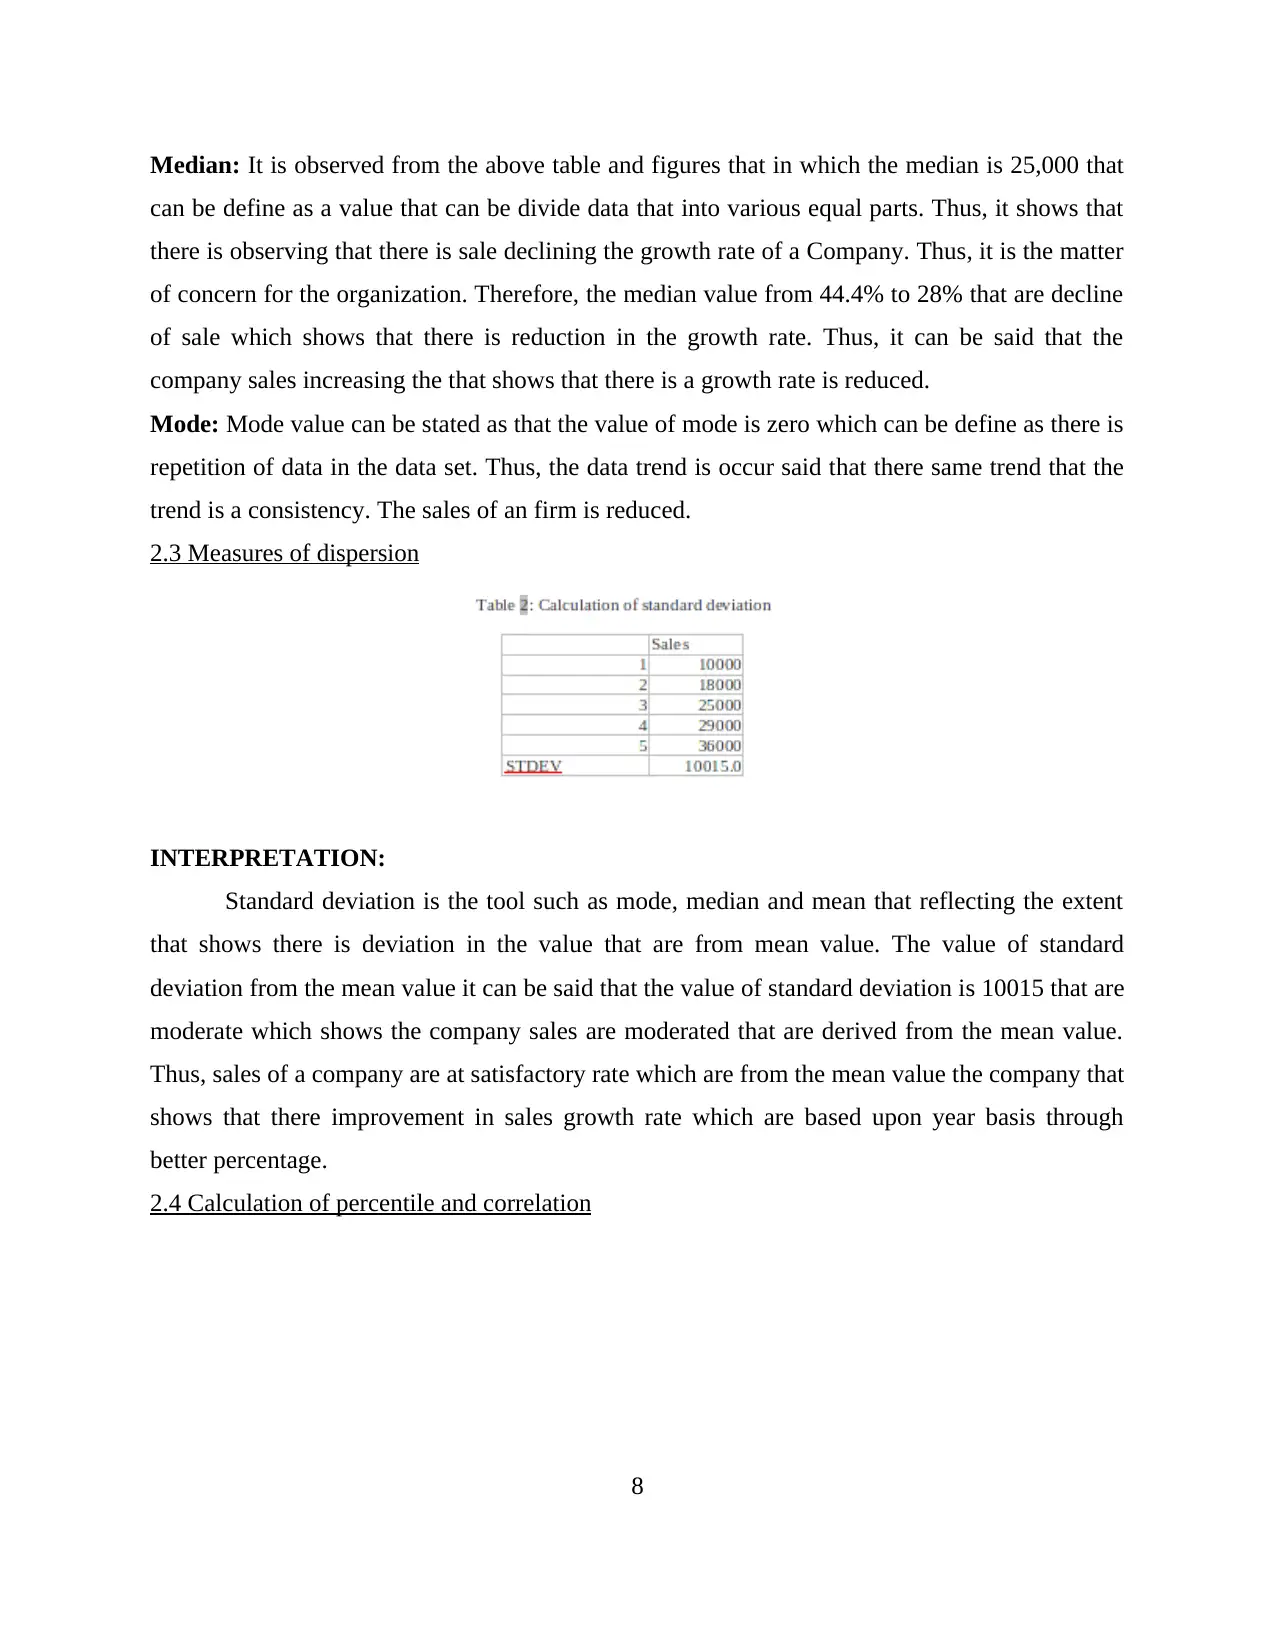
2.3 Measures of dispersion
INTERPRETATION:
Standard deviation is the tool such as mode, median and mean that reflecting the extent
that shows there is deviation in the value that are from mean value. The value of standard
deviation from the mean value it can be said that the value of standard deviation is 10015 that are
moderate which shows the company sales are moderated that are derived from the mean value.
Thus, sales of a company are at satisfactory rate which are from the mean value the company that
shows that there improvement in sales growth rate which are based upon year basis through
better percentage.
2.4 Calculation of percentile and correlation
8
can be define as a value that can be divide data that into various equal parts. Thus, it shows that
there is observing that there is sale declining the growth rate of a Company. Thus, it is the matter
of concern for the organization. Therefore, the median value from 44.4% to 28% that are decline
of sale which shows that there is reduction in the growth rate. Thus, it can be said that the
company sales increasing the that shows that there is a growth rate is reduced.
Mode: Mode value can be stated as that the value of mode is zero which can be define as there is
repetition of data in the data set. Thus, the data trend is occur said that there same trend that the
trend is a consistency. The sales of an firm is reduced.
2.3 Measures of dispersion
INTERPRETATION:
Standard deviation is the tool such as mode, median and mean that reflecting the extent
that shows there is deviation in the value that are from mean value. The value of standard
deviation from the mean value it can be said that the value of standard deviation is 10015 that are
moderate which shows the company sales are moderated that are derived from the mean value.
Thus, sales of a company are at satisfactory rate which are from the mean value the company that
shows that there improvement in sales growth rate which are based upon year basis through
better percentage.
2.4 Calculation of percentile and correlation
8
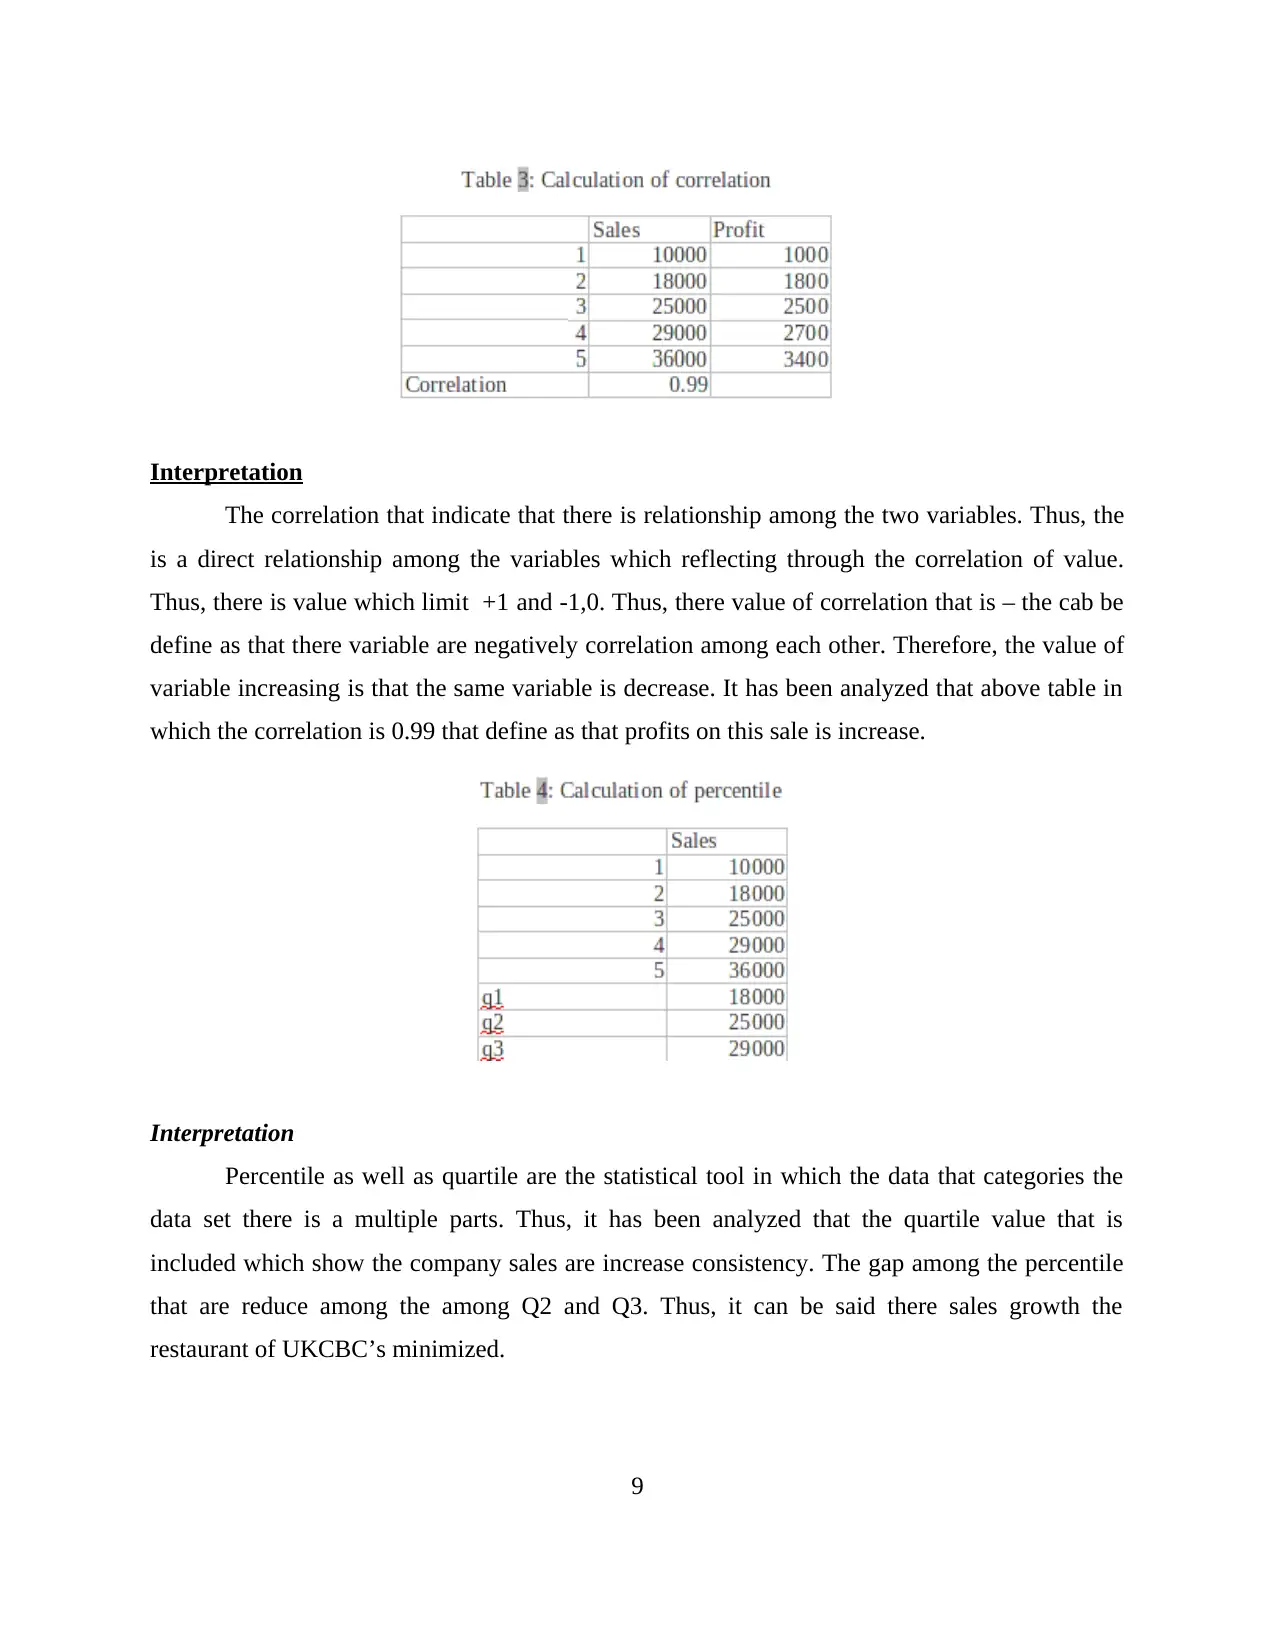
Interpretation
The correlation that indicate that there is relationship among the two variables. Thus, the
is a direct relationship among the variables which reflecting through the correlation of value.
Thus, there is value which limit +1 and -1,0. Thus, there value of correlation that is – the cab be
define as that there variable are negatively correlation among each other. Therefore, the value of
variable increasing is that the same variable is decrease. It has been analyzed that above table in
which the correlation is 0.99 that define as that profits on this sale is increase.
Interpretation
Percentile as well as quartile are the statistical tool in which the data that categories the
data set there is a multiple parts. Thus, it has been analyzed that the quartile value that is
included which show the company sales are increase consistency. The gap among the percentile
that are reduce among the among Q2 and Q3. Thus, it can be said there sales growth the
restaurant of UKCBC’s minimized.
9
⊘ This is a preview!⊘
Do you want full access?
Subscribe today to unlock all pages.
Trusted by 1+ million students worldwide
TASK 3
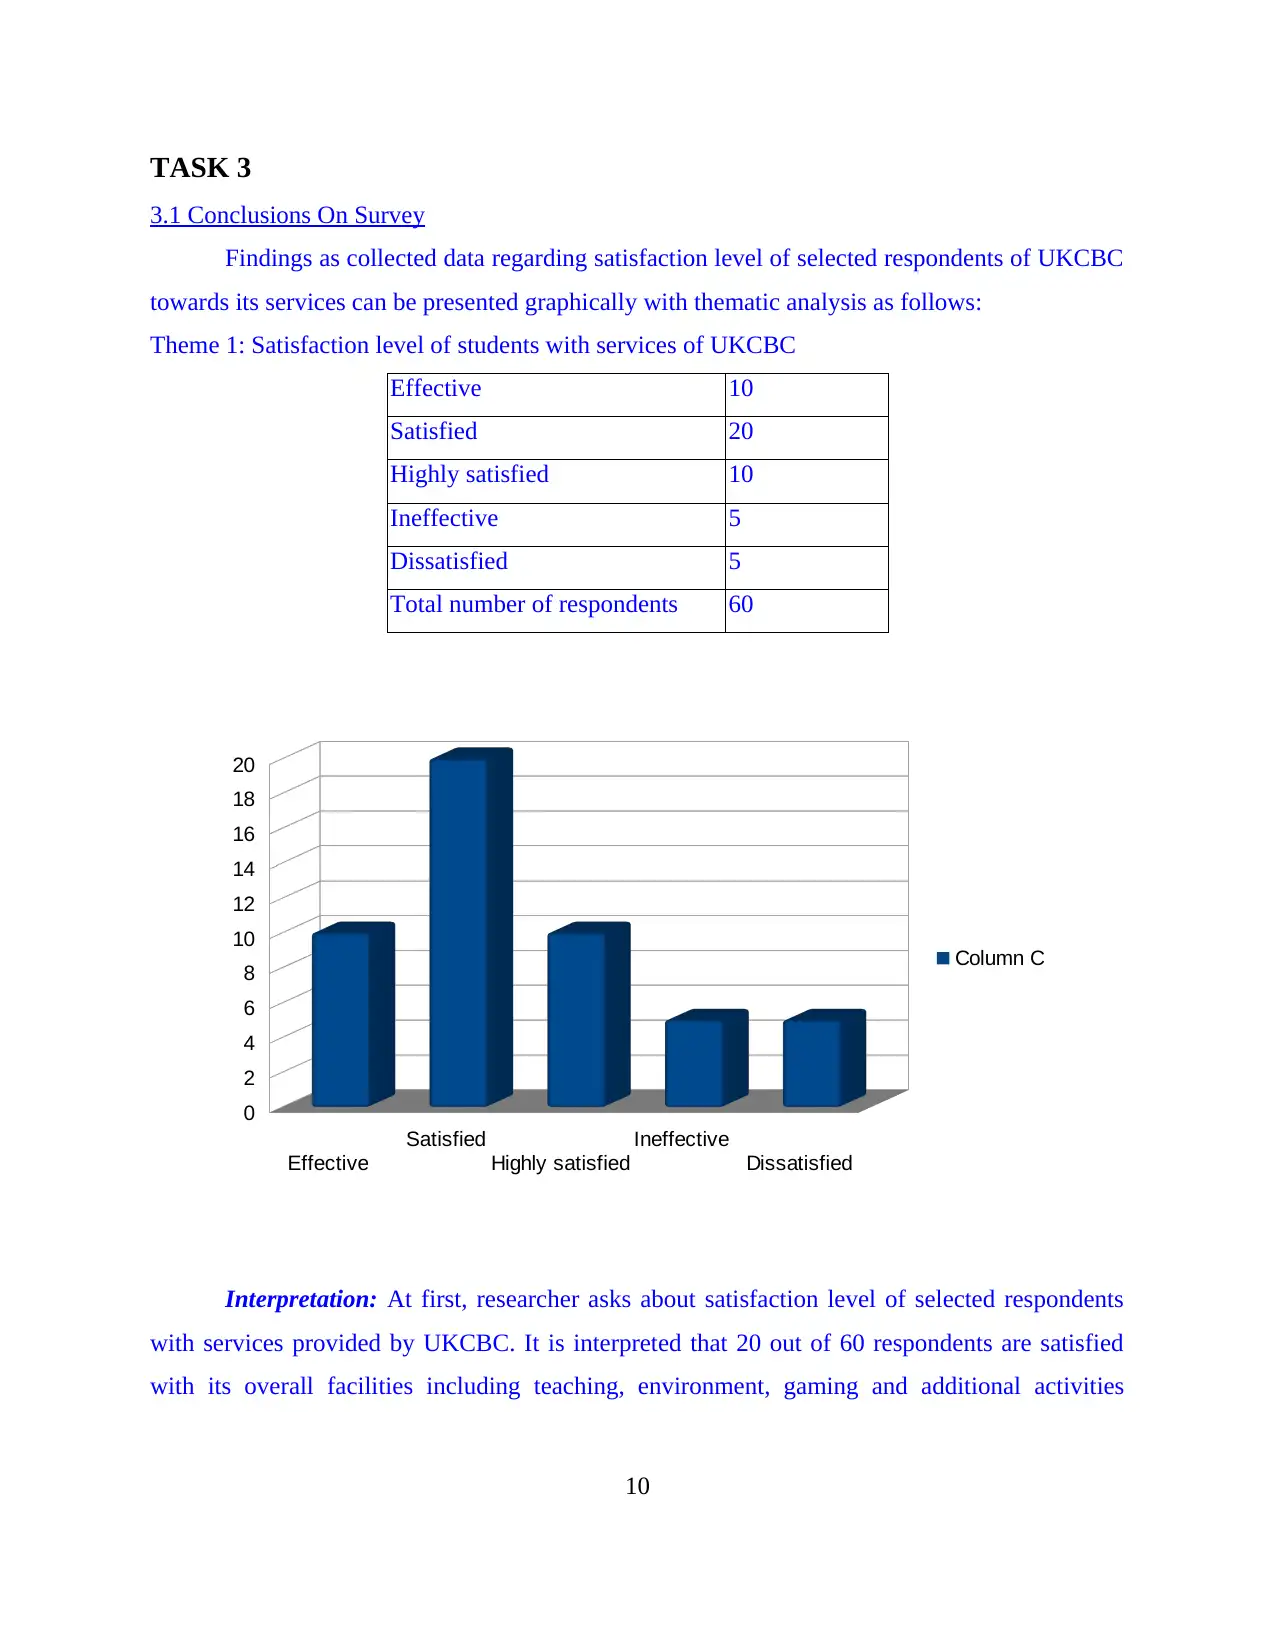
3.1 Conclusions On Survey
Findings as collected data regarding satisfaction level of selected respondents of UKCBC
towards its services can be presented graphically with thematic analysis as follows:
Theme 1: Satisfaction level of students with services of UKCBC
Effective 10
Satisfied 20
Highly satisfied 10
Ineffective 5
Dissatisfied 5
Total number of respondents 60
Interpretation: At first, researcher asks about satisfaction level of selected respondents
with services provided by UKCBC. It is interpreted that 20 out of 60 respondents are satisfied
with its overall facilities including teaching, environment, gaming and additional activities
10
Effective
Satisfied
Highly satisfied
Ineffective
Dissatisfied
0
2
4
6
8
10
12
14
16
18
20
Column C
Paraphrase This Document
Need a fresh take? Get an instant paraphrase of this document with our AI Paraphraser
organized for students' development. However, remaining 20 out of 40 are highly satisfied and
express that organization provides effective services to students equally. On behalf of this
interpretation, it can be forecast that this satisfaction level of students can be maintained and
sustained for longer time period efficiently. Therefore, organization should work upon it for
enhancing its efficiency at maximum level.
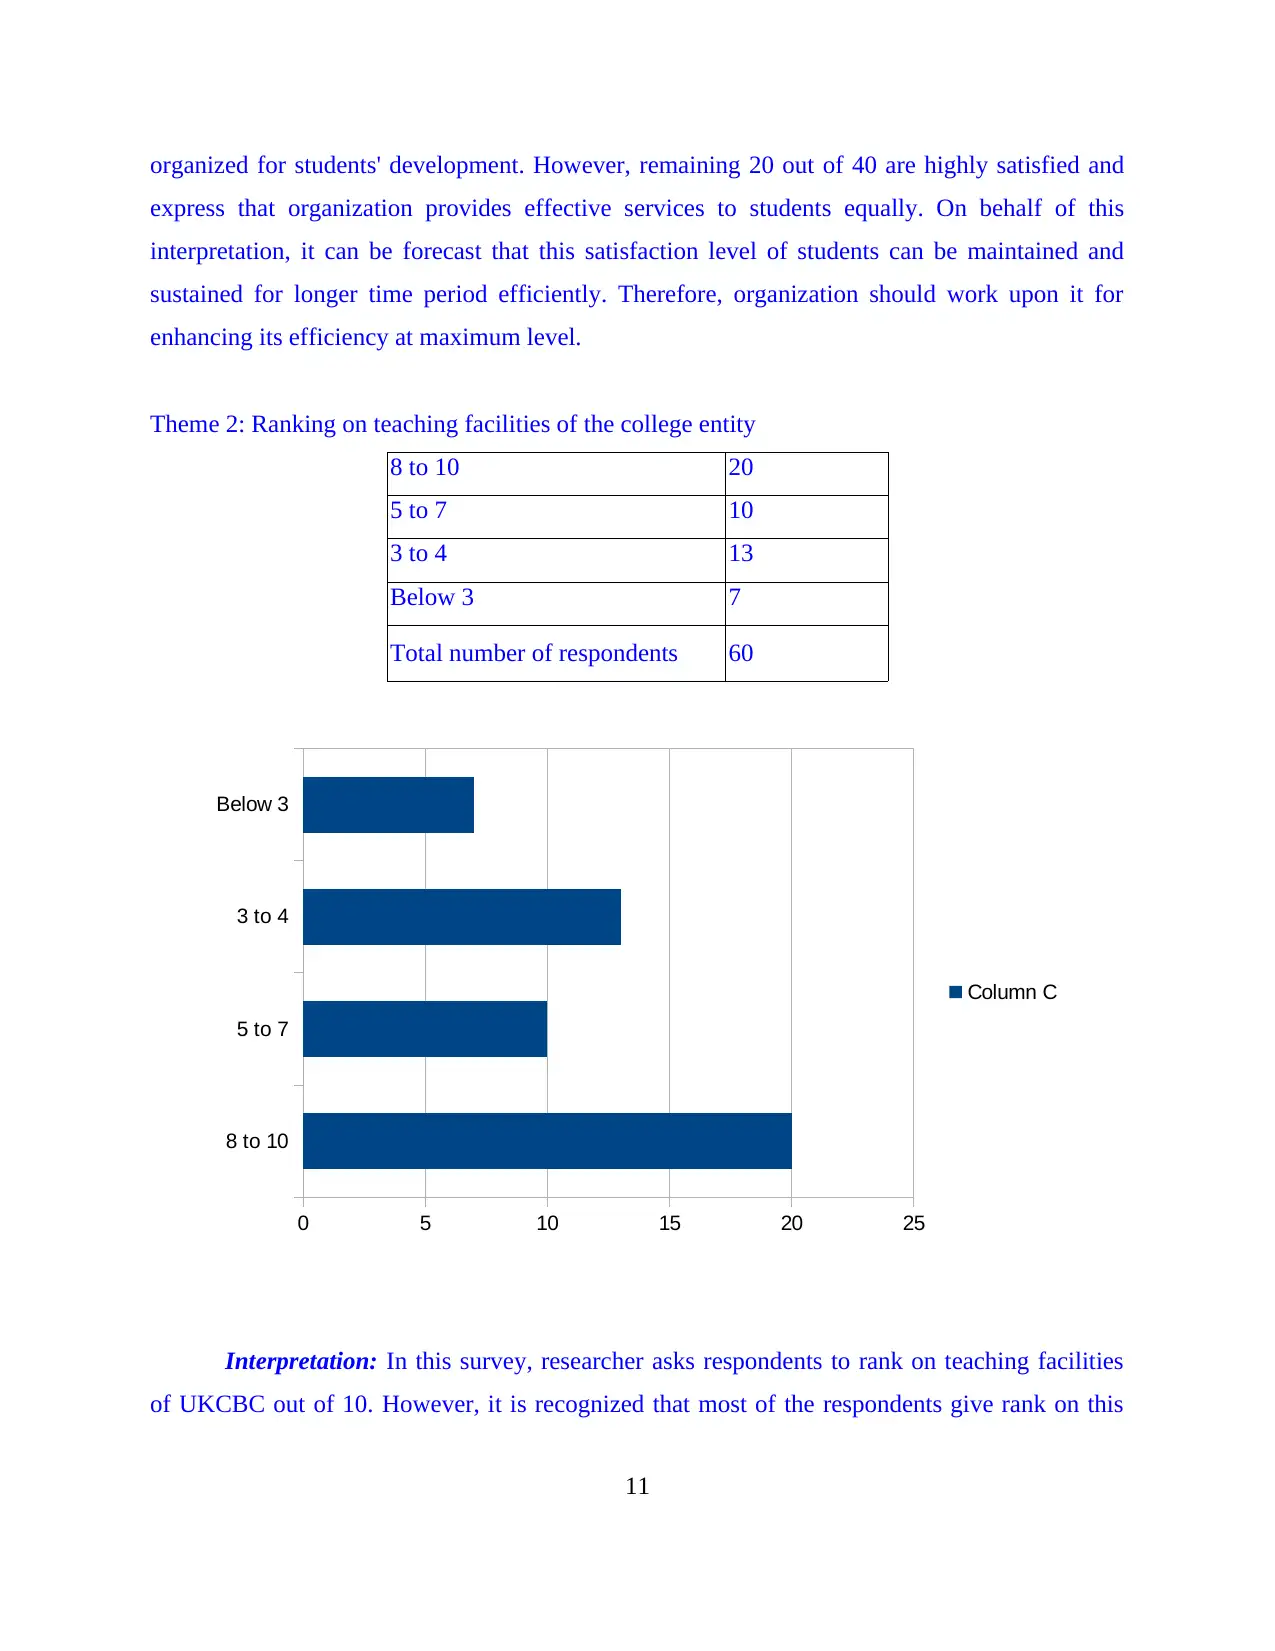
Theme 2: Ranking on teaching facilities of the college entity
8 to 10 20
5 to 7 10
3 to 4 13
Below 3 7
Total number of respondents 60
Interpretation: In this survey, researcher asks respondents to rank on teaching facilities
of UKCBC out of 10. However, it is recognized that most of the respondents give rank on this
11
8 to 10
5 to 7
3 to 4
Below 3
0 5 10 15 20 25
Column C
express that organization provides effective services to students equally. On behalf of this
interpretation, it can be forecast that this satisfaction level of students can be maintained and
sustained for longer time period efficiently. Therefore, organization should work upon it for
enhancing its efficiency at maximum level.
Theme 2: Ranking on teaching facilities of the college entity
8 to 10 20
5 to 7 10
3 to 4 13
Below 3 7
Total number of respondents 60
Interpretation: In this survey, researcher asks respondents to rank on teaching facilities
of UKCBC out of 10. However, it is recognized that most of the respondents give rank on this
11
8 to 10
5 to 7
3 to 4
Below 3
0 5 10 15 20 25
Column C
service is between 8 to 10 which is good and indicates implementation in further years. Including
this, 10 out of 60 respondents rank between 5 to 7 on teaching facilities of the college entity.
Therefore, positive and effective results are obtained regarding teaching facilities that can be
maintained and improved at maximum level for longer time period.
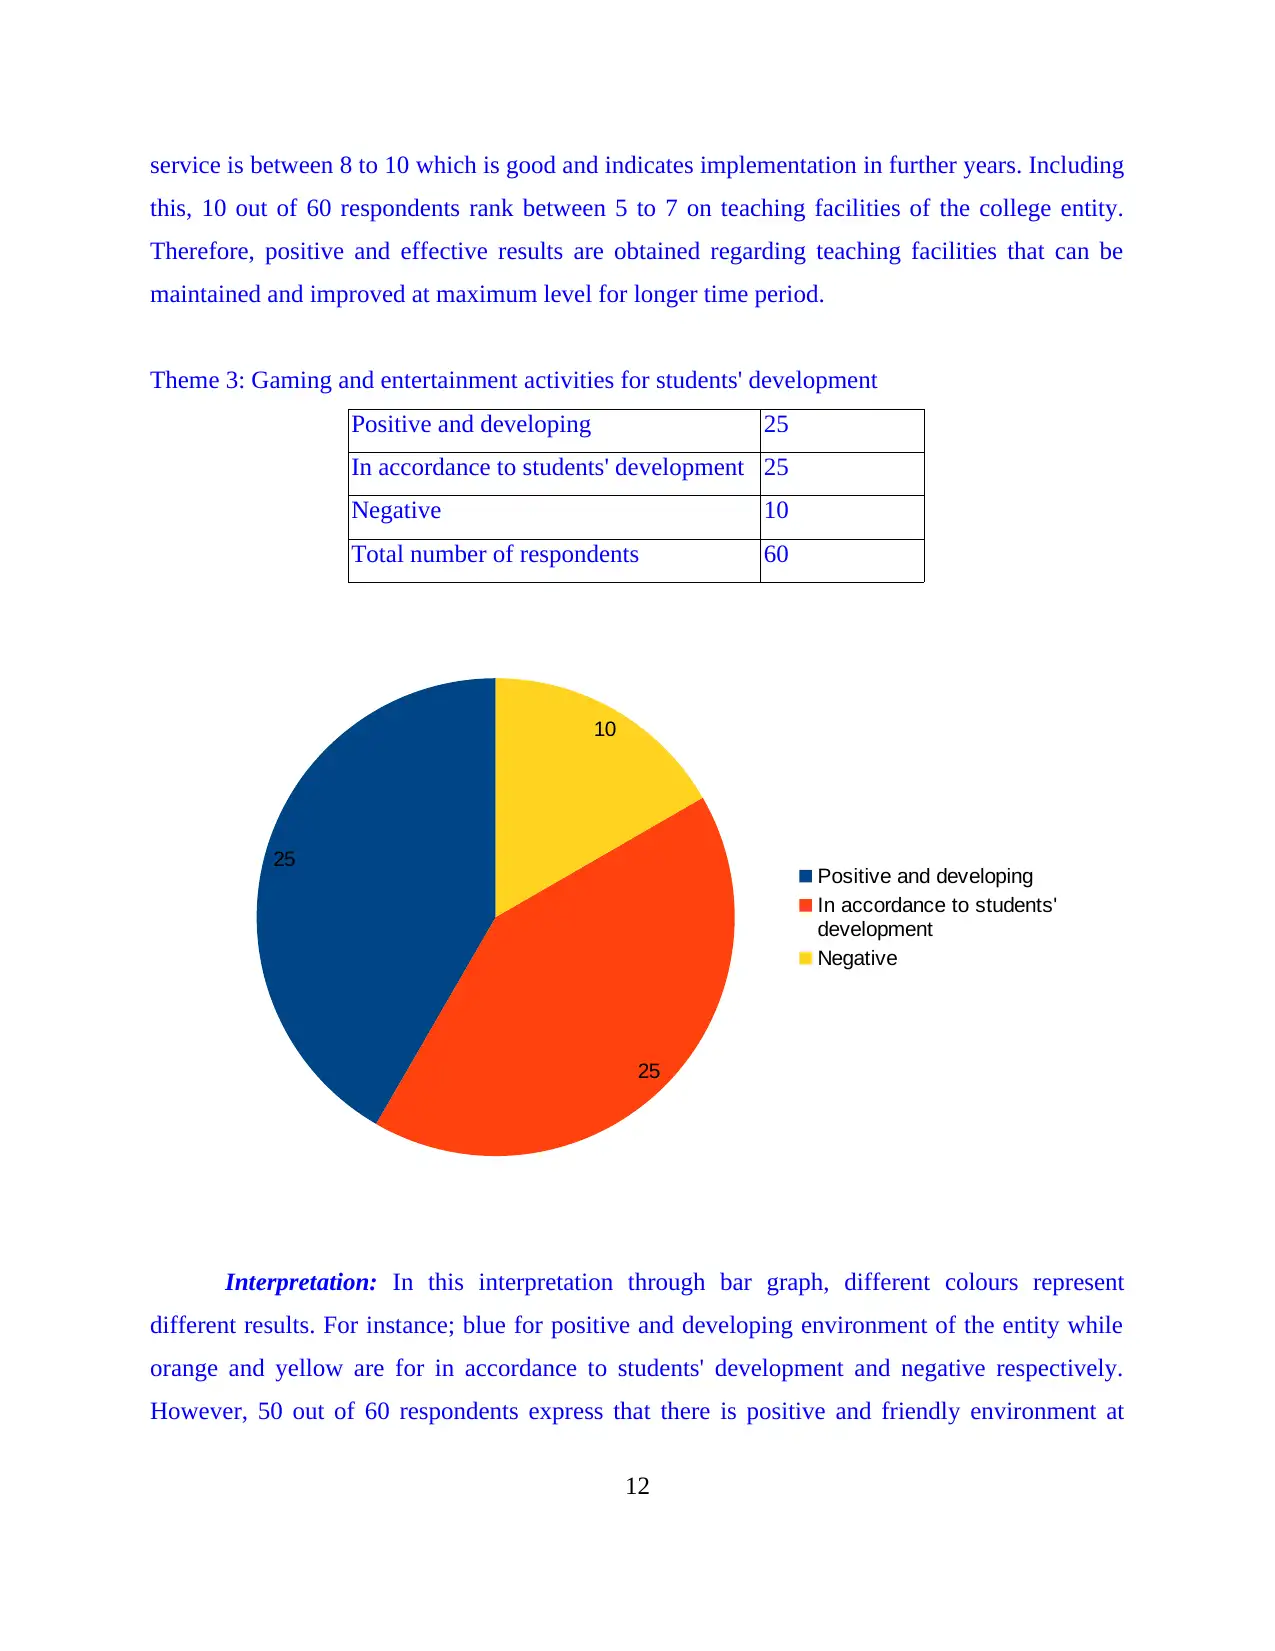
Theme 3: Gaming and entertainment activities for students' development
Positive and developing 25
In accordance to students' development 25
Negative 10
Total number of respondents 60
Interpretation: In this interpretation through bar graph, different colours represent
different results. For instance; blue for positive and developing environment of the entity while
orange and yellow are for in accordance to students' development and negative respectively.
However, 50 out of 60 respondents express that there is positive and friendly environment at
12
25
25
10
Positive and developing
In accordance to students'
development
Negative
this, 10 out of 60 respondents rank between 5 to 7 on teaching facilities of the college entity.
Therefore, positive and effective results are obtained regarding teaching facilities that can be
maintained and improved at maximum level for longer time period.
Theme 3: Gaming and entertainment activities for students' development
Positive and developing 25
In accordance to students' development 25
Negative 10
Total number of respondents 60
Interpretation: In this interpretation through bar graph, different colours represent
different results. For instance; blue for positive and developing environment of the entity while
orange and yellow are for in accordance to students' development and negative respectively.
However, 50 out of 60 respondents express that there is positive and friendly environment at
12
25
25
10
Positive and developing
In accordance to students'
development
Negative
⊘ This is a preview!⊘
Do you want full access?
Subscribe today to unlock all pages.
Trusted by 1+ million students worldwide
1 out of 23
Related Documents


Your All-in-One AI-Powered Toolkit for Academic Success.
+13062052269
info@desklib.com
Available 24*7 on WhatsApp / Email
![[object Object]](/_next/static/media/star-bottom.7253800d.svg)
Unlock your academic potential
Copyright © 2020–2026 A2Z Services. All Rights Reserved. Developed and managed by ZUCOL.