Business Decision Making: Analysis of Morrison's Supermarket Issues
VerifiedAdded on 2019/12/03
|15
|3123
|20
Report
AI Summary
This report provides a comprehensive analysis of the business decision-making process within Morrison's supermarket, a major UK retailer. It begins with an introduction to the company and identifies its primary business challenge: a lack of customer awareness regarding its products and services. The report outlines the research plan, detailing the collection of primary data through questionnaires and secondary data from various sources. The core of the report involves a thorough analysis of sales and profit data over a ten-year period, including descriptive statistics, measures of dispersion, and the use of quartiles, percentiles, and correlation coefficients to draw conclusions. The findings reveal insights into customer preferences, the impact of promotional campaigns, and the relationship between sales and profitability. Furthermore, the report includes the production of graphs, the use of trend lines for forecasting, and a discussion of business presentation techniques, culminating in a formal business report. The analysis is designed to provide a clear understanding of Morrison's current market position and suggest data-driven strategies for improvement.
Business Decision Making
Paraphrase This Document
Need a fresh take? Get an instant paraphrase of this document with our AI Paraphraser
Table of Contents
INTRODUCTION...........................................................................................................................1
TASK 1............................................................................................................................................1
1.1 Brief introduction of the organization and business problem which is facing by the
Morrison's...............................................................................................................................1
1.2 Preparing the research plan to collect primary and secondary data in order to assess the
business problem....................................................................................................................1
1.3 Designing of questionnaire...............................................................................................2
1.4 Sampling frame used to collect the relevant and reliable data.........................................3
TASK 2............................................................................................................................................4
2.1 Summarization of data to create information for the decision making............................4
Descriptive analysis of sales is enumerated below:...............................................................4
Descriptive analysis of profits is enumerated below:.............................................................5
2.2 Analysis of the result to draw valid conclusion................................................................5
2.3 Analysis of data by using measures of dispersion............................................................7
2.4 Use of quartile, percentile and correlation coefficient to draw conclusion......................8
TASK 3............................................................................................................................................9
3.1 Producing graph using spreadsheet and conclusion based upon it...................................9
3.2 Use of trend line in order to forecast the future sales.......................................................9
3.3 Business presentation by using software and techniques to disseminate the information10
3.4 Producing a formal business report................................................................................10
TASK 4..........................................................................................................................................11
CONCLUSION..............................................................................................................................11
REFERENCES..............................................................................................................................11
INTRODUCTION
Business decision making can be defined as a process in which finance manager selects
best options among several alternatives. Financial decisions and strategies play a significant role
in achieving success in dynamic business environment (Bhattacharya and Londhe, 2014). The
present report is based upon Morrison which the largest supermarket of UK. This project report
depicts collection of primary and secondary data in order to resolve problems which are faced by
the company. Besides this, it also develops understanding about measures of dispersion which
helps in analyzing data in an effective manner.
TASK 1
1.1 Brief introduction of the organization and business problem which is facing by the
Morrison's
Morrison is the fourth largest supermarket of UK which is founded in the year 1899.
Morrison offers variety of quality and cost effective product and services to their customers. It
has 569 stores in different areas of the world. Besides this, it provides employment to large
number of people approximately. Maximizing productivity and profitability by satisfying needs
and wants of the customers is one of the main objectives of Morrison. In addition to this,
increasing efficiency, driving top line and capturing growth are also the main objectives of
Morrison. One of the main problems which are faced by Morrison is the lack of awareness
among the customers in relation to the product and services which are offered by them. This is
one of the major problems which closely impact the level of customer satisfaction and loyalty
towards product or services of Morrison.
1
⊘ This is a preview!⊘
Do you want full access?
Subscribe today to unlock all pages.
Trusted by 1+ million students worldwide
1.2 Preparing the research plan to collect primary and secondary data in order to assess the
business problem
Plan for the collection of primary data: Primary data can be defined as those which are
collected by the researcher for the first time for their own research purpose. In order to collect
primary data, researcher undertakes survey technique which helps them in getting appropriate
information according to the research problem. To conduct survey in an effective manner
searcher selects sample by undertaking suitable sampling techniques. Once sample for the survey
have been selected thereafter researcher prepares questionnaire which contains both close and
open ended questions (Corsatea, Giaccaria and Arántegui, 2014). Through this, researcher is
able to assess level of awareness among the customer about product or services offered by them.
Plan for the collection of secondary data: It may be defined as those which are already
collected by the other researcher for their own research purpose. Researcher can use secondary
data by making modification in it which provides assistance to them in their own research
finding (Sapsford and Jupp, 2006). Books, journals, periodicals, government sources and
research paper are the main secondary sources which help the researcher in identifying customer
attitude and preference towards the product and services of Morrison.
1.3 Designing of questionnaire
Demographic data of the customers:
Name:
Age:
1. What is the working status of the users or non users?
Working ( )
No working ( )
2. What is the marital status of the customer?
Married ( )
Single( )
3. How often do you purchase the product from the retail store?
Weekly ( )
Monthly ( )
Yearly ( )
3. Which retail store first come in your mind when you make purchase decision?
2
Paraphrase This Document
Need a fresh take? Get an instant paraphrase of this document with our AI Paraphraser
ASDA ( )
Tesco ( )
Morrison's ( )
Sainsbury ( )
Other ( )
4. Factor which closely impacts your purchasing decision?
Price ( )
Quality ( )
Convenience ( )
5. Does promotional campaign or advertisement affects your purchasing decision?
Yes ( )
No ( )
6. If yes, then which of the promotional campaign or method used by Morrison affects you the
most?
Social media advertisement ( )
Television ( )
Advertisement on the website of Morrison ( )
7. Are you satisfied with the services which are offered by Morrison?
Moderately satisfied ( )
Satisfied ( )
Dissatisfied ( )
1.4 Sampling frame used to collect the relevant and reliable data
Survey methodology acts as a guide which provides assistance to researcher in
conducting the research study in an effective manner. Researcher undertakes survey to assess
satisfaction level and awareness among the customers in relation to the product or services which
are offered by Morrison's. In order to get information from the existing and potential customer
base Morrison will make effort to get e-mail id of the customers. Through this, researcher will
conduct survey and identify appropriate solution of the problem.
Sample can be defined as a small size of the population which provides assistance to the
researcher in finding an appropriate solution to the problem. There are several sampling
technique such as quota, random and purpose sampling technique which researcher can use in
3
selecting appropriate sample (Herman, 2011). Moreover, it is not possible for the researcher to
conduct survey of whole population. In quota sampling, sample is selected by the researcher on
the basis of the quota which is fixed by them. For instance, in 50 people 20 persons should be
females and others must be 30 students who are between the ages of 20-22.
In random sampling method, researcher randomly selects the sample. In this, each person has the
equal chance to be chosen as a sample (Shultz, 2005). In addition to this, in purpose sampling
researcher selects sample on the basis of specified criteria which helps them in meeting their
goals and objectives. This sampling technique helps the researcher in identifying appropriate
solution of the problem. For the effective research, the sample size should neither be too large
nor too small (Lind, D., Marchal and Wathen, 2005). For this study, researcher undertakes
purpose sampling method and thereby selects 50 people as a sample which helps them in
assessing level of awareness and satisfaction of the customers.
TASK 2
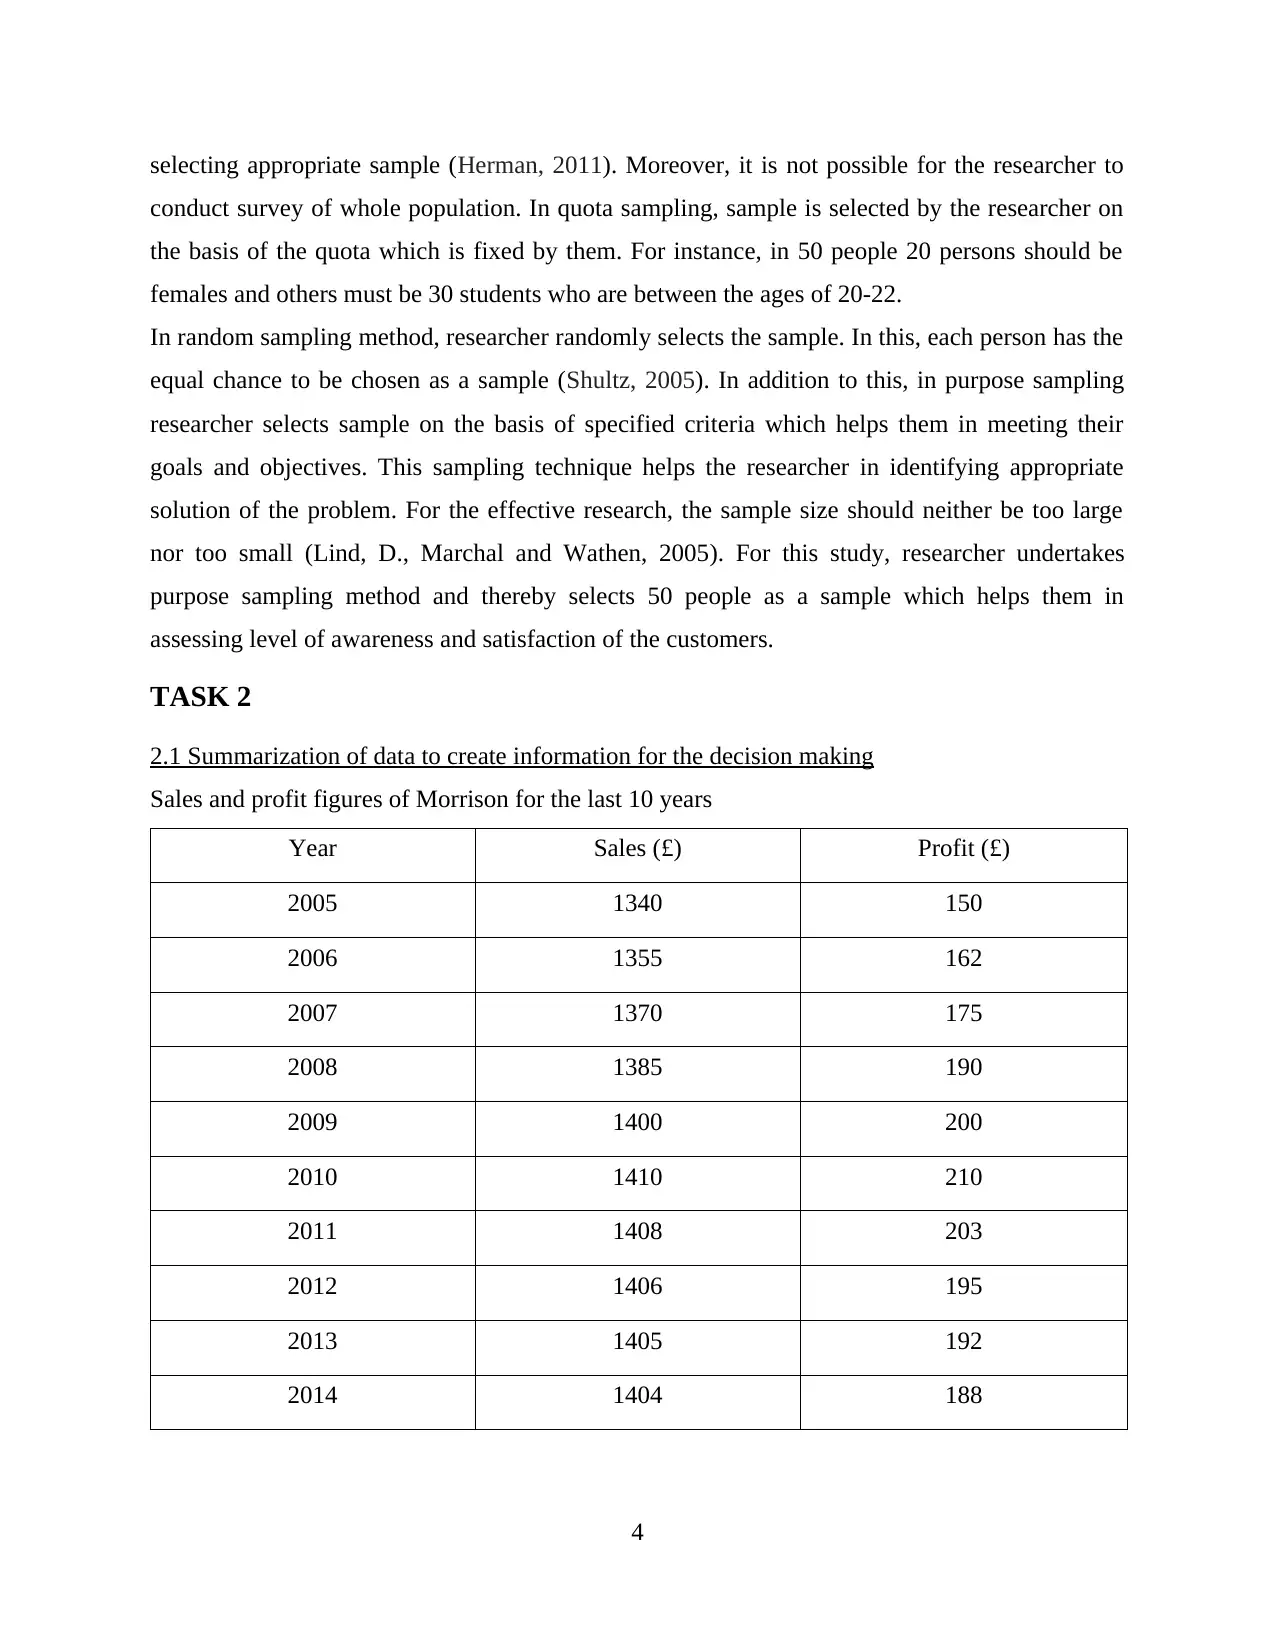
2.1 Summarization of data to create information for the decision making
Sales and profit figures of Morrison for the last 10 years
Year Sales (£) Profit (£)
2005 1340 150
2006 1355 162
2007 1370 175
2008 1385 190
2009 1400 200
2010 1410 210
2011 1408 203
2012 1406 195
2013 1405 192
2014 1404 188
4
conduct survey of whole population. In quota sampling, sample is selected by the researcher on
the basis of the quota which is fixed by them. For instance, in 50 people 20 persons should be
females and others must be 30 students who are between the ages of 20-22.
In random sampling method, researcher randomly selects the sample. In this, each person has the
equal chance to be chosen as a sample (Shultz, 2005). In addition to this, in purpose sampling
researcher selects sample on the basis of specified criteria which helps them in meeting their
goals and objectives. This sampling technique helps the researcher in identifying appropriate
solution of the problem. For the effective research, the sample size should neither be too large
nor too small (Lind, D., Marchal and Wathen, 2005). For this study, researcher undertakes
purpose sampling method and thereby selects 50 people as a sample which helps them in
assessing level of awareness and satisfaction of the customers.
TASK 2
2.1 Summarization of data to create information for the decision making
Sales and profit figures of Morrison for the last 10 years
Year Sales (£) Profit (£)
2005 1340 150
2006 1355 162
2007 1370 175
2008 1385 190
2009 1400 200
2010 1410 210
2011 1408 203
2012 1406 195
2013 1405 192
2014 1404 188
4
⊘ This is a preview!⊘
Do you want full access?
Subscribe today to unlock all pages.
Trusted by 1+ million students worldwide
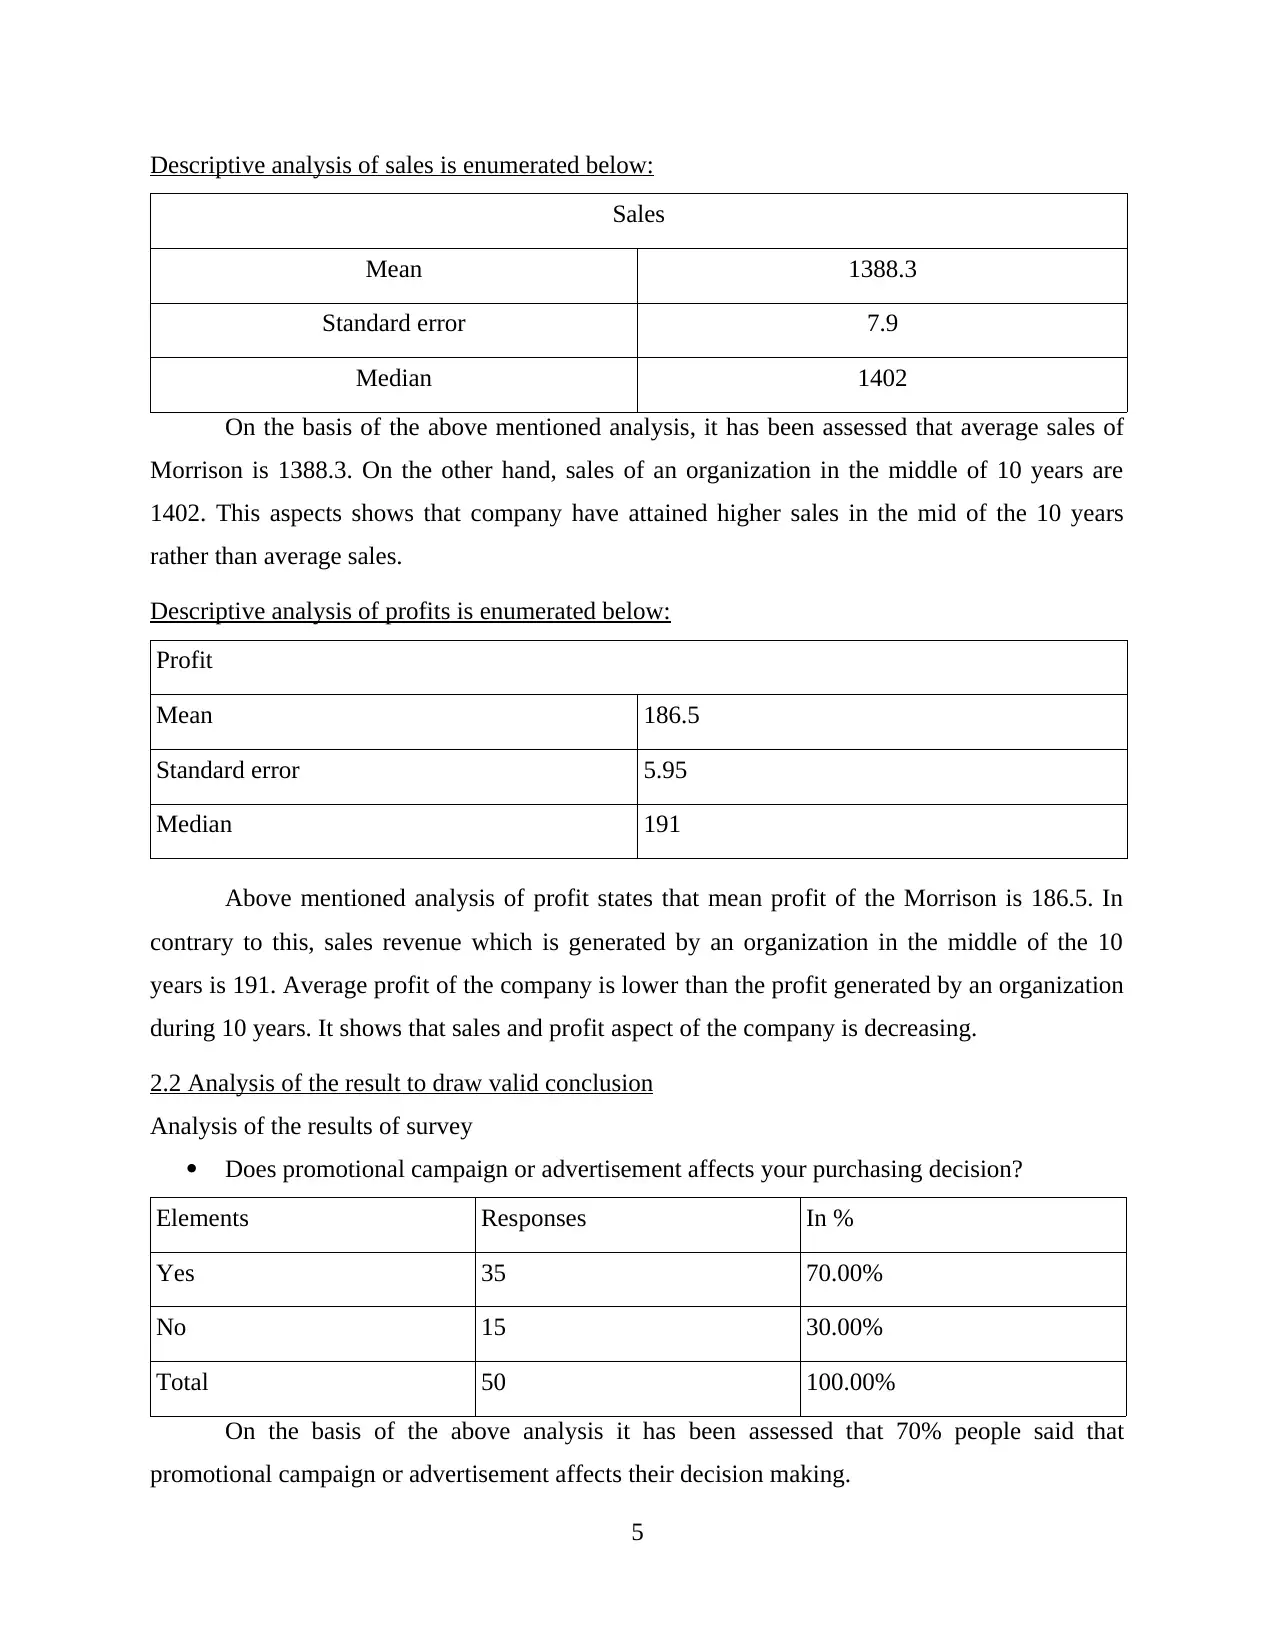
Descriptive analysis of sales is enumerated below:
Sales
Mean 1388.3
Standard error 7.9
Median 1402
On the basis of the above mentioned analysis, it has been assessed that average sales of
Morrison is 1388.3. On the other hand, sales of an organization in the middle of 10 years are
1402. This aspects shows that company have attained higher sales in the mid of the 10 years
rather than average sales.
Descriptive analysis of profits is enumerated below:
Profit
Mean 186.5
Standard error 5.95
Median 191
Above mentioned analysis of profit states that mean profit of the Morrison is 186.5. In
contrary to this, sales revenue which is generated by an organization in the middle of the 10
years is 191. Average profit of the company is lower than the profit generated by an organization
during 10 years. It shows that sales and profit aspect of the company is decreasing.
2.2 Analysis of the result to draw valid conclusion
Analysis of the results of survey
Does promotional campaign or advertisement affects your purchasing decision?
Elements Responses In %
Yes 35 70.00%
No 15 30.00%
Total 50 100.00%
On the basis of the above analysis it has been assessed that 70% people said that
promotional campaign or advertisement affects their decision making.
5
Paraphrase This Document
Need a fresh take? Get an instant paraphrase of this document with our AI Paraphraser
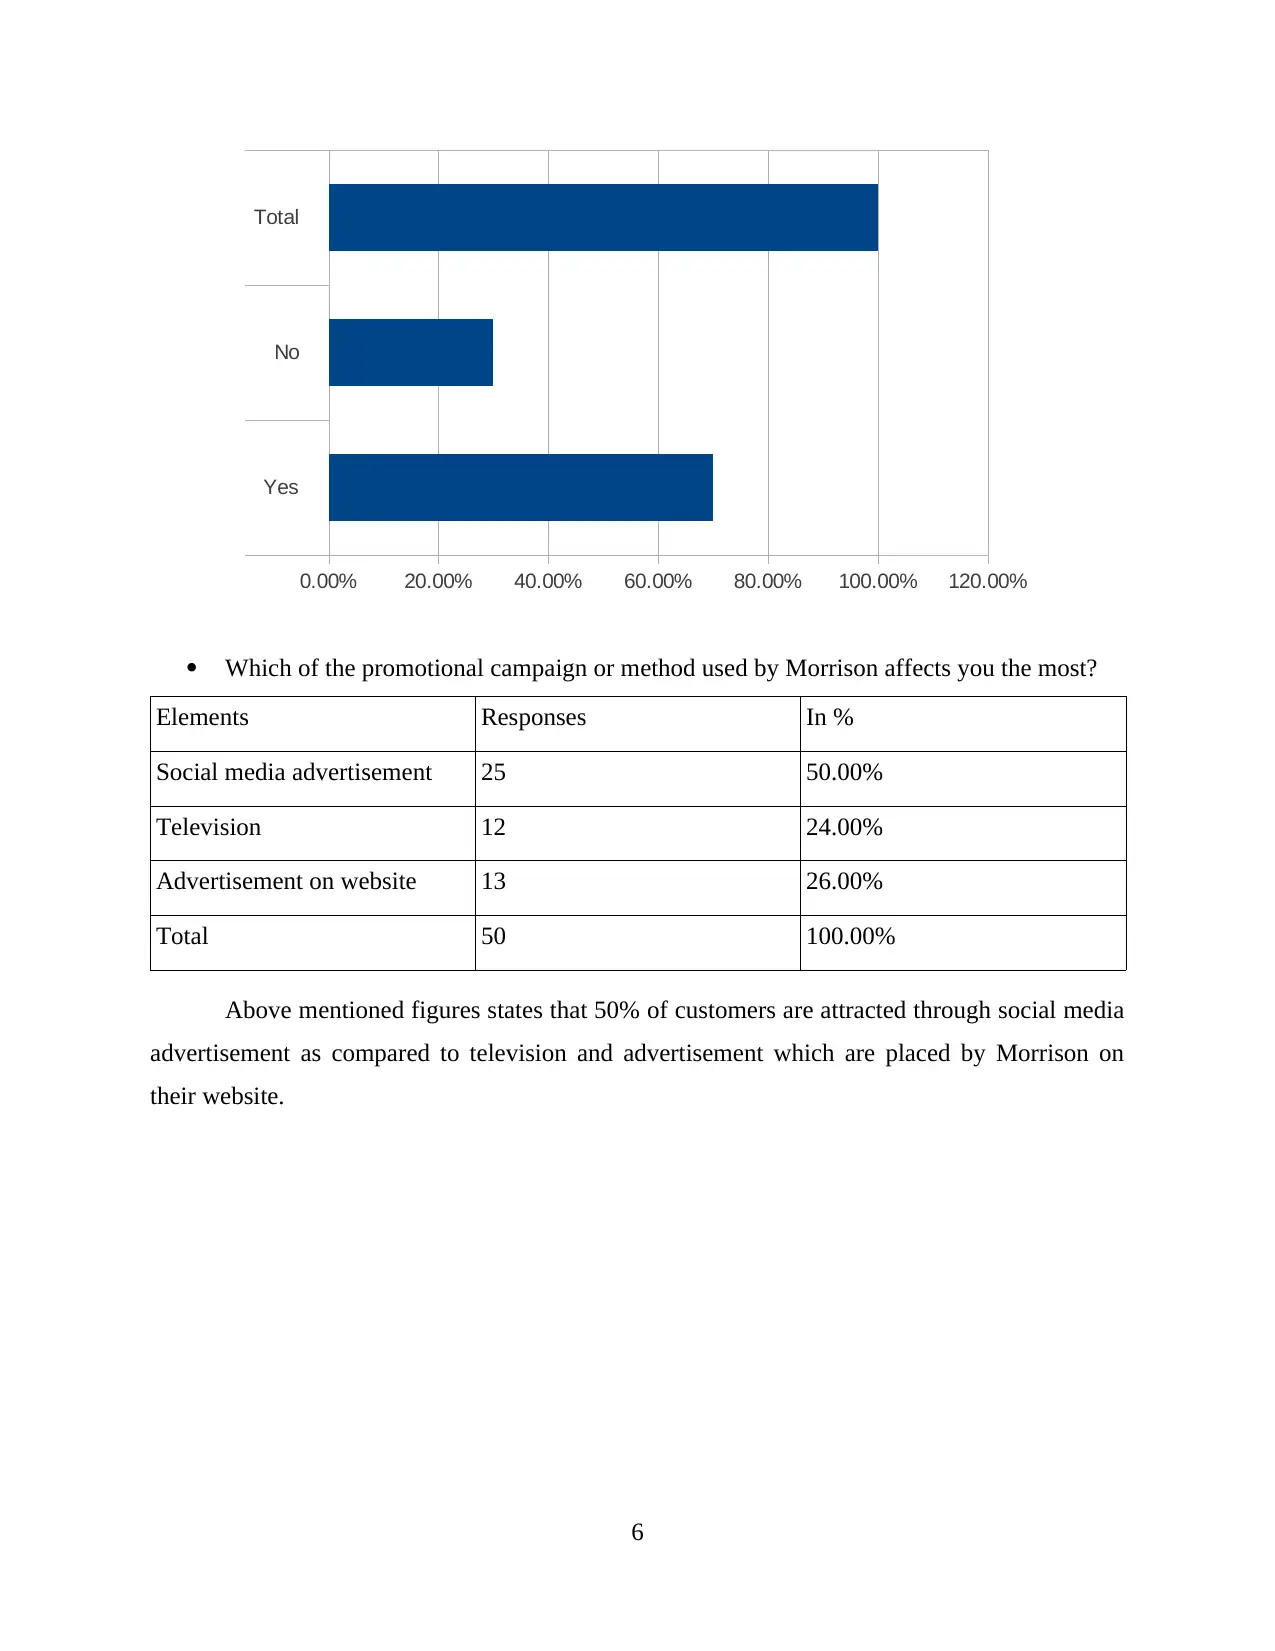
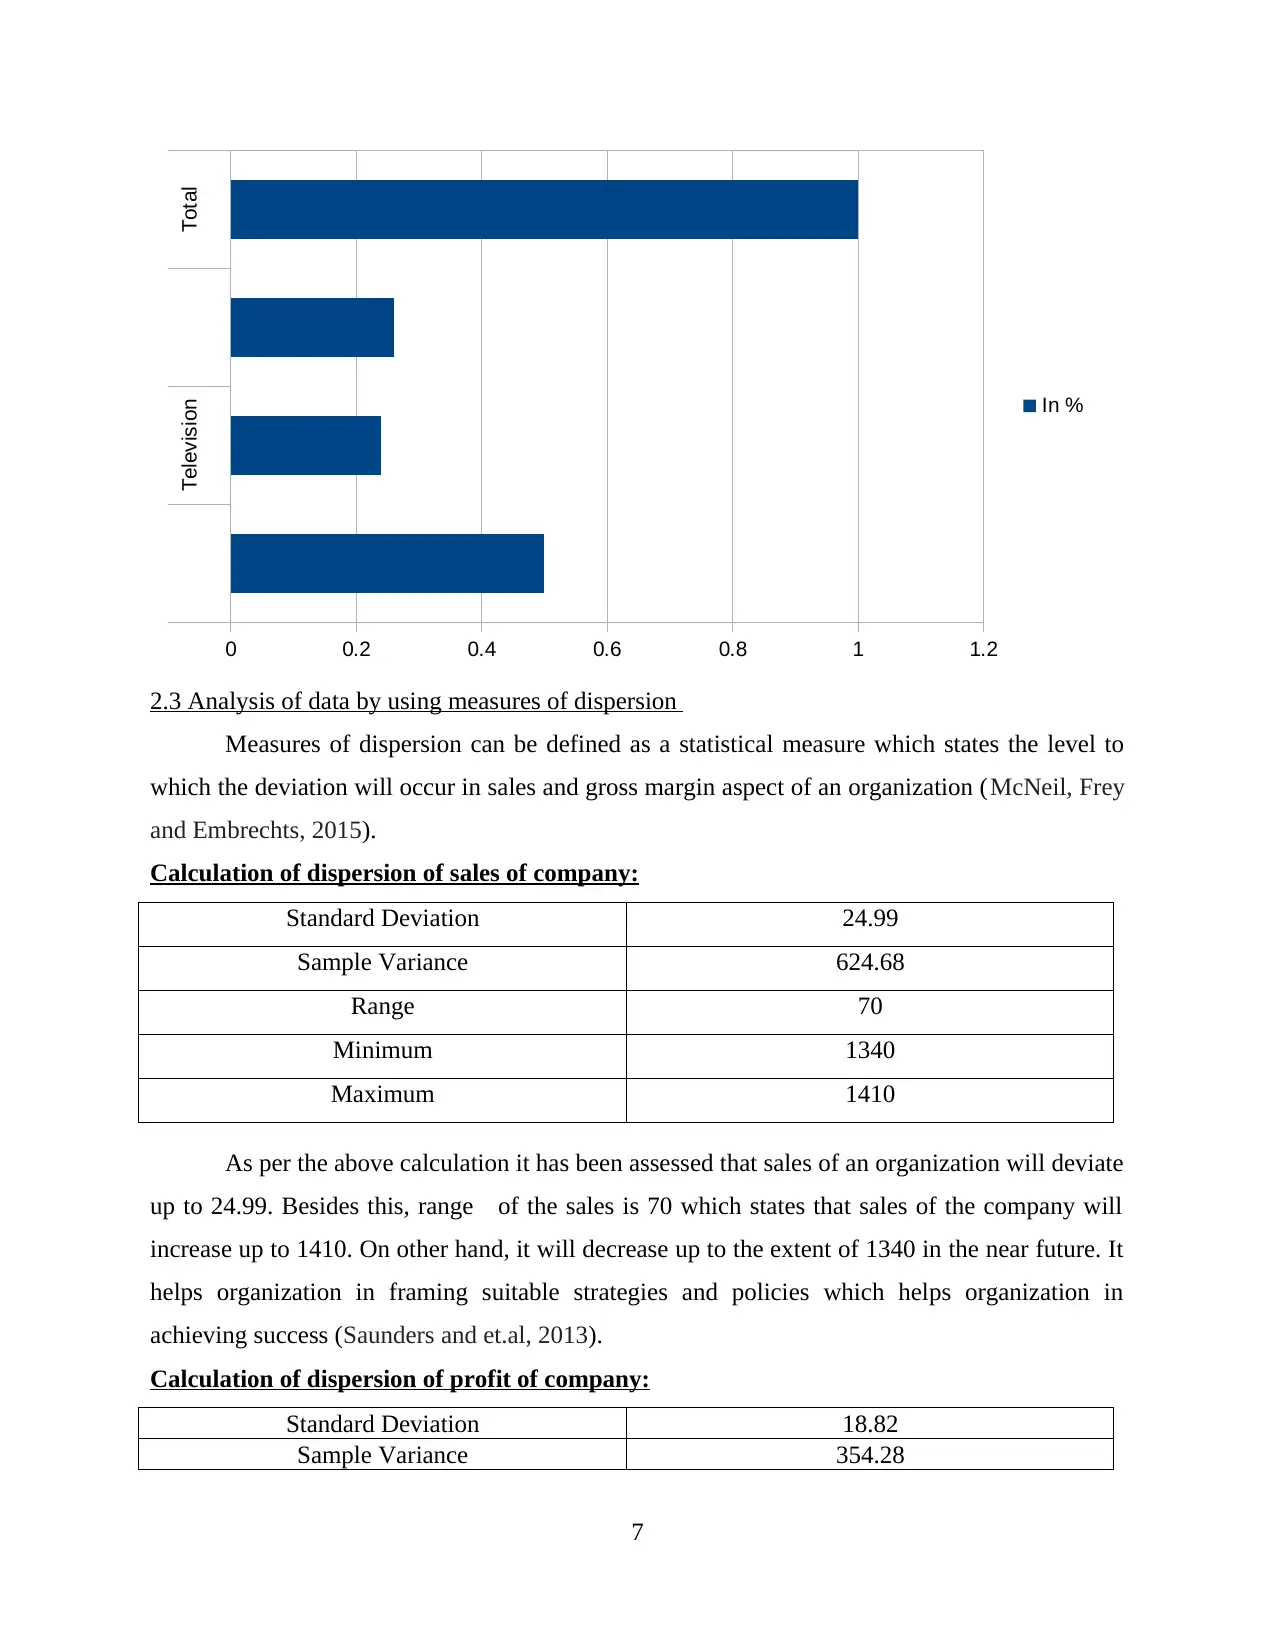
Which of the promotional campaign or method used by Morrison affects you the most?
Elements Responses In %
Social media advertisement 25 50.00%
Television 12 24.00%
Advertisement on website 13 26.00%
Total 50 100.00%
Above mentioned figures states that 50% of customers are attracted through social media
advertisement as compared to television and advertisement which are placed by Morrison on
their website.
6
Yes
No
Total
0.00% 20.00% 40.00% 60.00% 80.00% 100.00% 120.00%
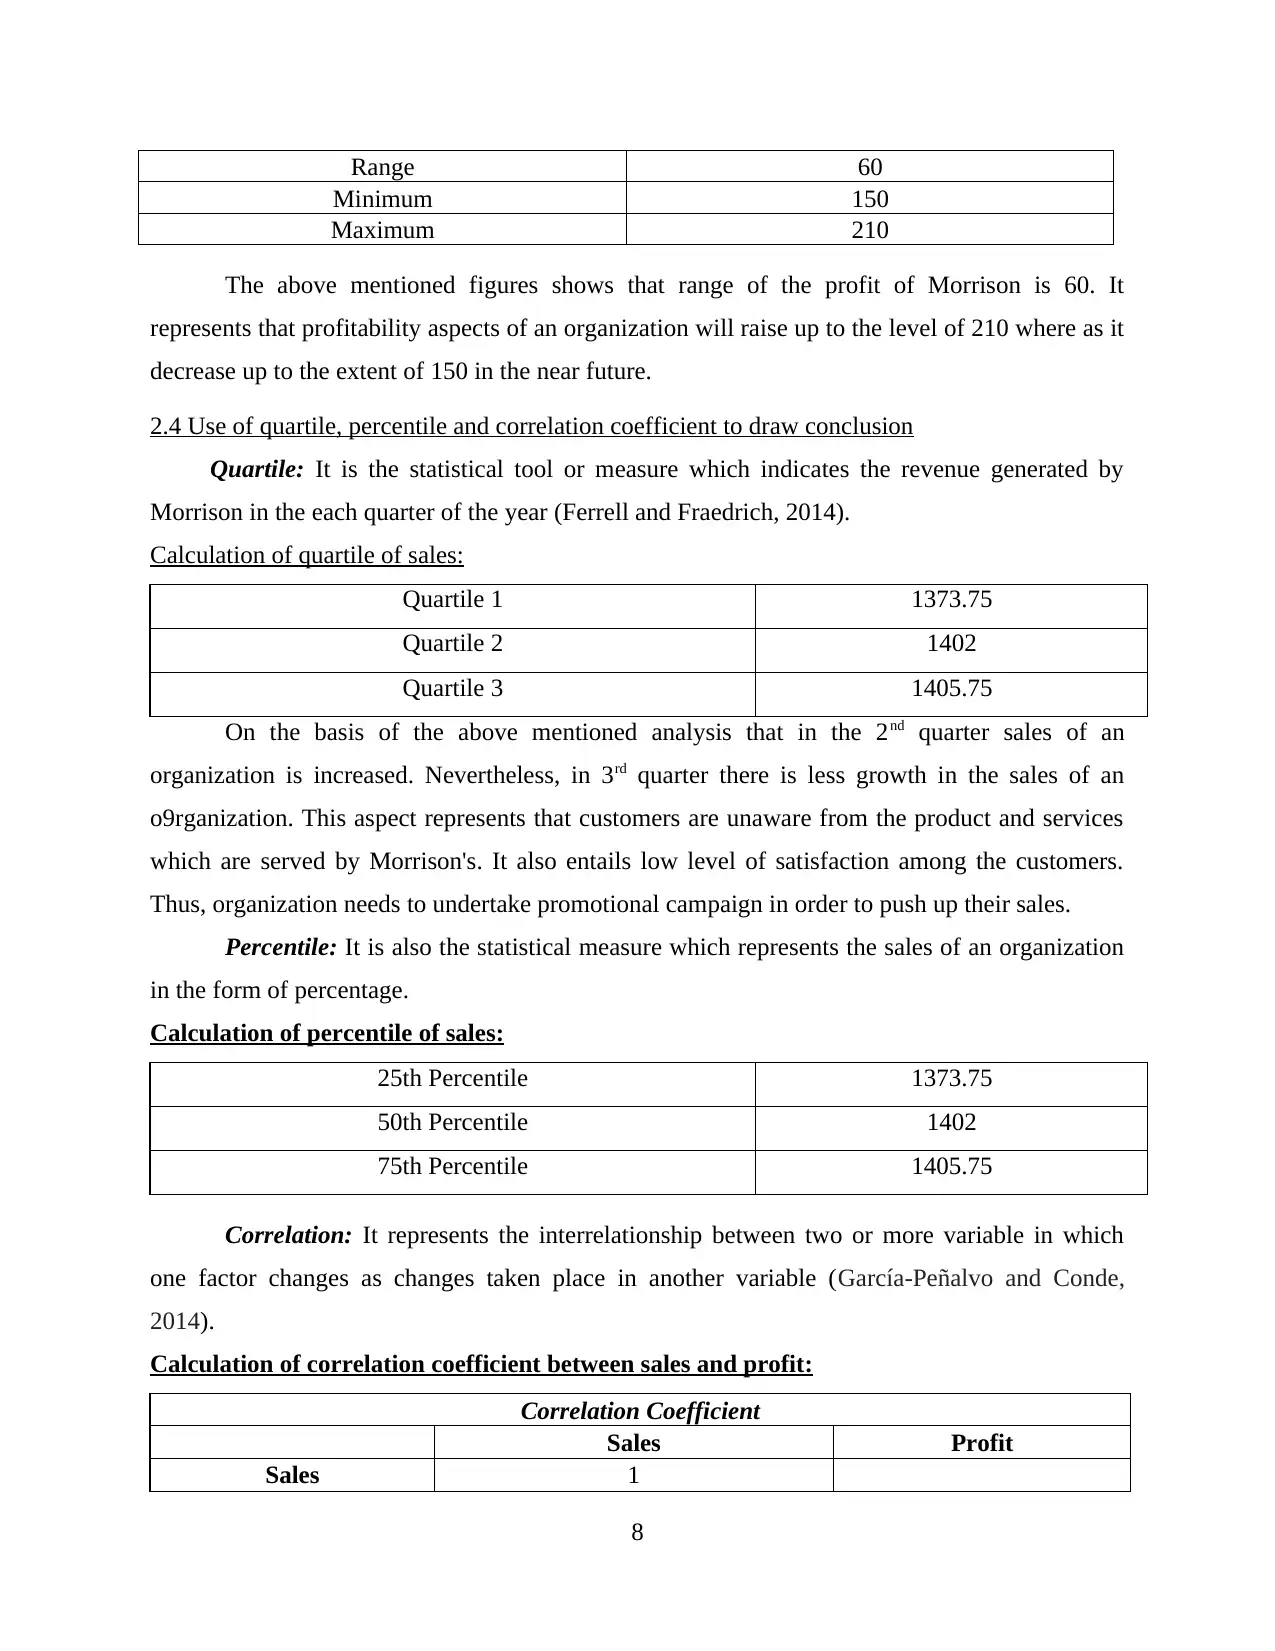
2.3 Analysis of data by using measures of dispersion
Measures of dispersion can be defined as a statistical measure which states the level to
which the deviation will occur in sales and gross margin aspect of an organization (McNeil, Frey
and Embrechts, 2015).
Calculation of dispersion of sales of company:
Standard Deviation 24.99
Sample Variance 624.68
Range 70
Minimum 1340
Maximum 1410
As per the above calculation it has been assessed that sales of an organization will deviate
up to 24.99. Besides this, range of the sales is 70 which states that sales of the company will
increase up to 1410. On other hand, it will decrease up to the extent of 1340 in the near future. It
helps organization in framing suitable strategies and policies which helps organization in
achieving success (Saunders and et.al, 2013).
Calculation of dispersion of profit of company:
Standard Deviation 18.82
Sample Variance 354.28
7
Television Total
0 0.2 0.4 0.6 0.8 1 1.2
In %
⊘ This is a preview!⊘
Do you want full access?
Subscribe today to unlock all pages.
Trusted by 1+ million students worldwide
Range 60
Minimum 150
Maximum 210
The above mentioned figures shows that range of the profit of Morrison is 60. It
represents that profitability aspects of an organization will raise up to the level of 210 where as it
decrease up to the extent of 150 in the near future.
2.4 Use of quartile, percentile and correlation coefficient to draw conclusion
Quartile: It is the statistical tool or measure which indicates the revenue generated by
Morrison in the each quarter of the year (Ferrell and Fraedrich, 2014).
Calculation of quartile of sales:
Quartile 1 1373.75
Quartile 2 1402
Quartile 3 1405.75
On the basis of the above mentioned analysis that in the 2nd quarter sales of an
organization is increased. Nevertheless, in 3rd quarter there is less growth in the sales of an
o9rganization. This aspect represents that customers are unaware from the product and services
which are served by Morrison's. It also entails low level of satisfaction among the customers.
Thus, organization needs to undertake promotional campaign in order to push up their sales.
Percentile: It is also the statistical measure which represents the sales of an organization
in the form of percentage.
Calculation of percentile of sales:
25th Percentile 1373.75
50th Percentile 1402
75th Percentile 1405.75
Correlation: It represents the interrelationship between two or more variable in which
one factor changes as changes taken place in another variable (García-Peñalvo and Conde,
2014).
Calculation of correlation coefficient between sales and profit:
Correlation Coefficient
Sales Profit
Sales 1
8
Paraphrase This Document
Need a fresh take? Get an instant paraphrase of this document with our AI Paraphraser
Profit 0.95 1
On the basis of the above analysis it has been assessed that there is the positive co--
relationship exist between sales and profit aspects (Nicholson and Aman, 2012). It states that
sales and profit will increase or decrease in the same direction.
TASK 3
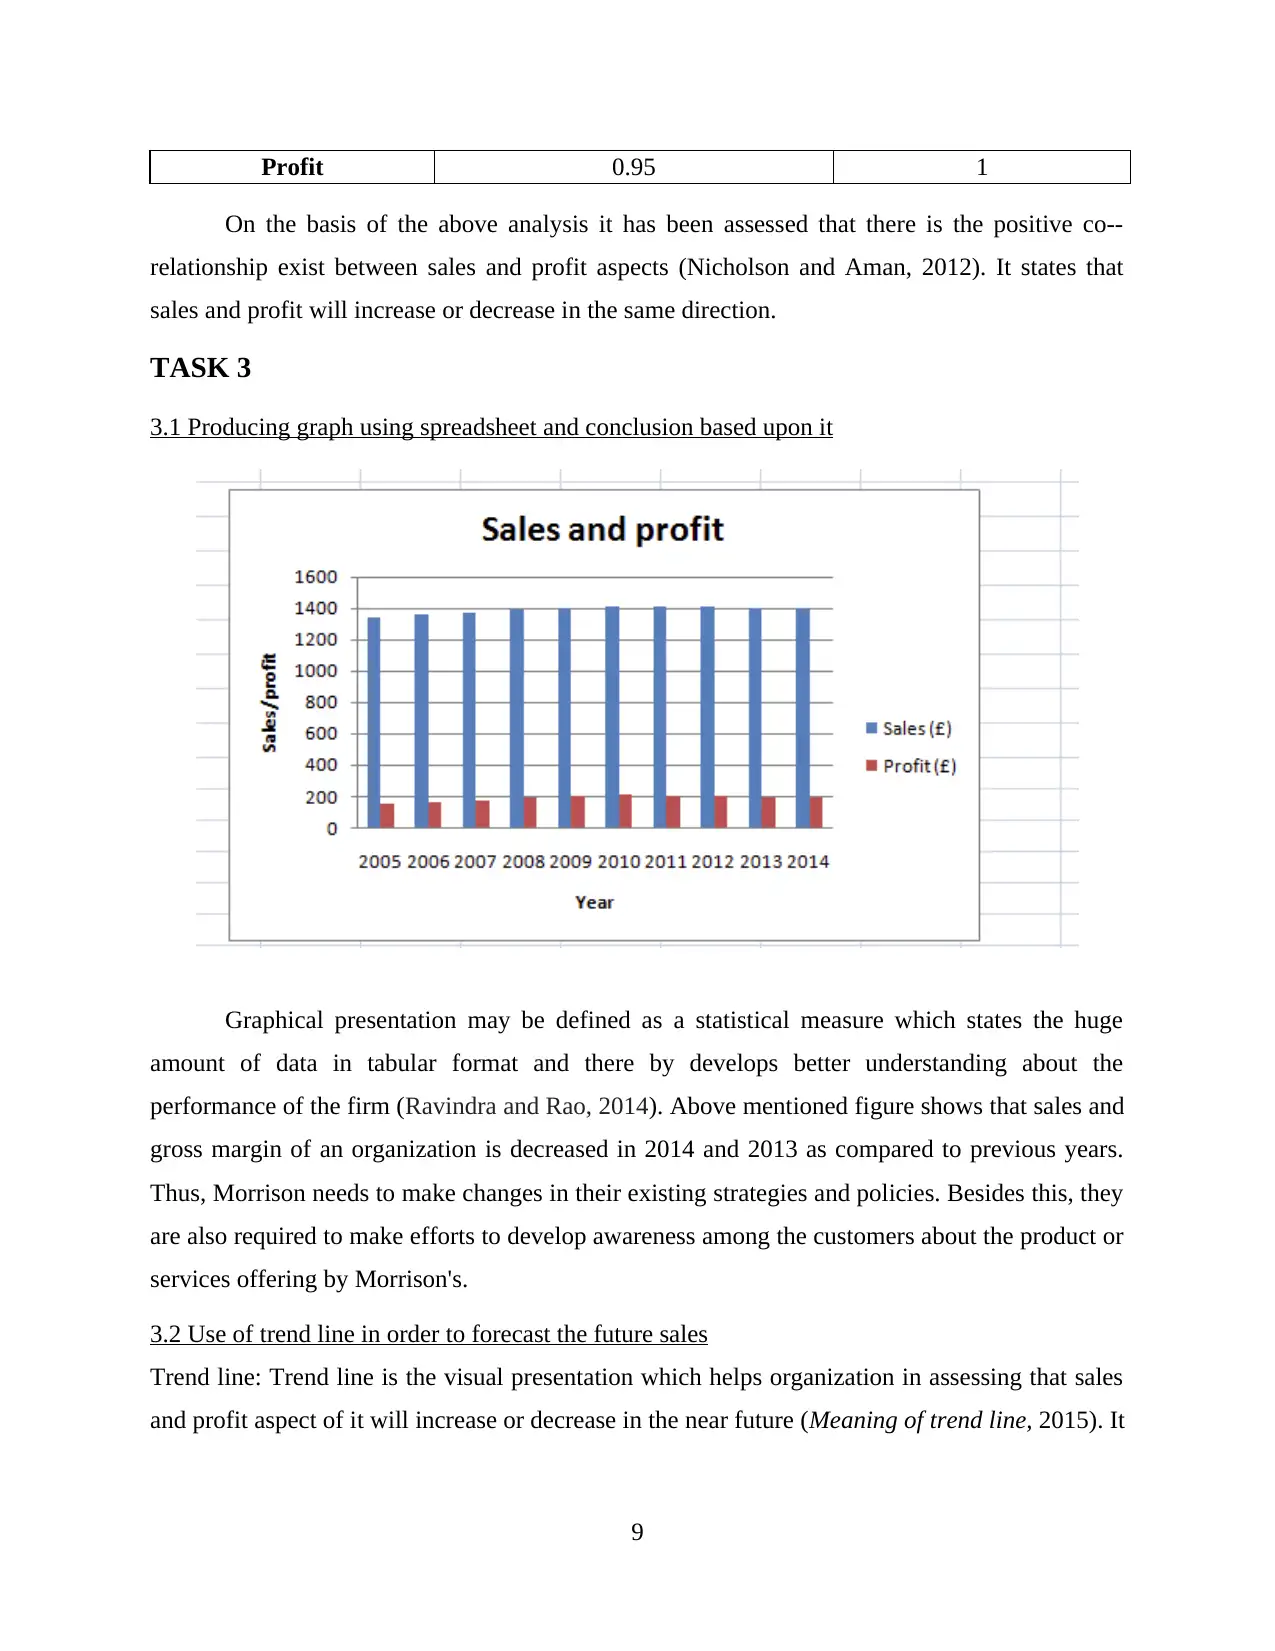
3.1 Producing graph using spreadsheet and conclusion based upon it
Graphical presentation may be defined as a statistical measure which states the huge
amount of data in tabular format and there by develops better understanding about the
performance of the firm (Ravindra and Rao, 2014). Above mentioned figure shows that sales and
gross margin of an organization is decreased in 2014 and 2013 as compared to previous years.
Thus, Morrison needs to make changes in their existing strategies and policies. Besides this, they
are also required to make efforts to develop awareness among the customers about the product or
services offering by Morrison's.
3.2 Use of trend line in order to forecast the future sales
Trend line: Trend line is the visual presentation which helps organization in assessing that sales
and profit aspect of it will increase or decrease in the near future (Meaning of trend line, 2015). It
9
On the basis of the above analysis it has been assessed that there is the positive co--
relationship exist between sales and profit aspects (Nicholson and Aman, 2012). It states that
sales and profit will increase or decrease in the same direction.
TASK 3
3.1 Producing graph using spreadsheet and conclusion based upon it
Graphical presentation may be defined as a statistical measure which states the huge
amount of data in tabular format and there by develops better understanding about the
performance of the firm (Ravindra and Rao, 2014). Above mentioned figure shows that sales and
gross margin of an organization is decreased in 2014 and 2013 as compared to previous years.
Thus, Morrison needs to make changes in their existing strategies and policies. Besides this, they
are also required to make efforts to develop awareness among the customers about the product or
services offering by Morrison's.
3.2 Use of trend line in order to forecast the future sales
Trend line: Trend line is the visual presentation which helps organization in assessing that sales
and profit aspect of it will increase or decrease in the near future (Meaning of trend line, 2015). It
9
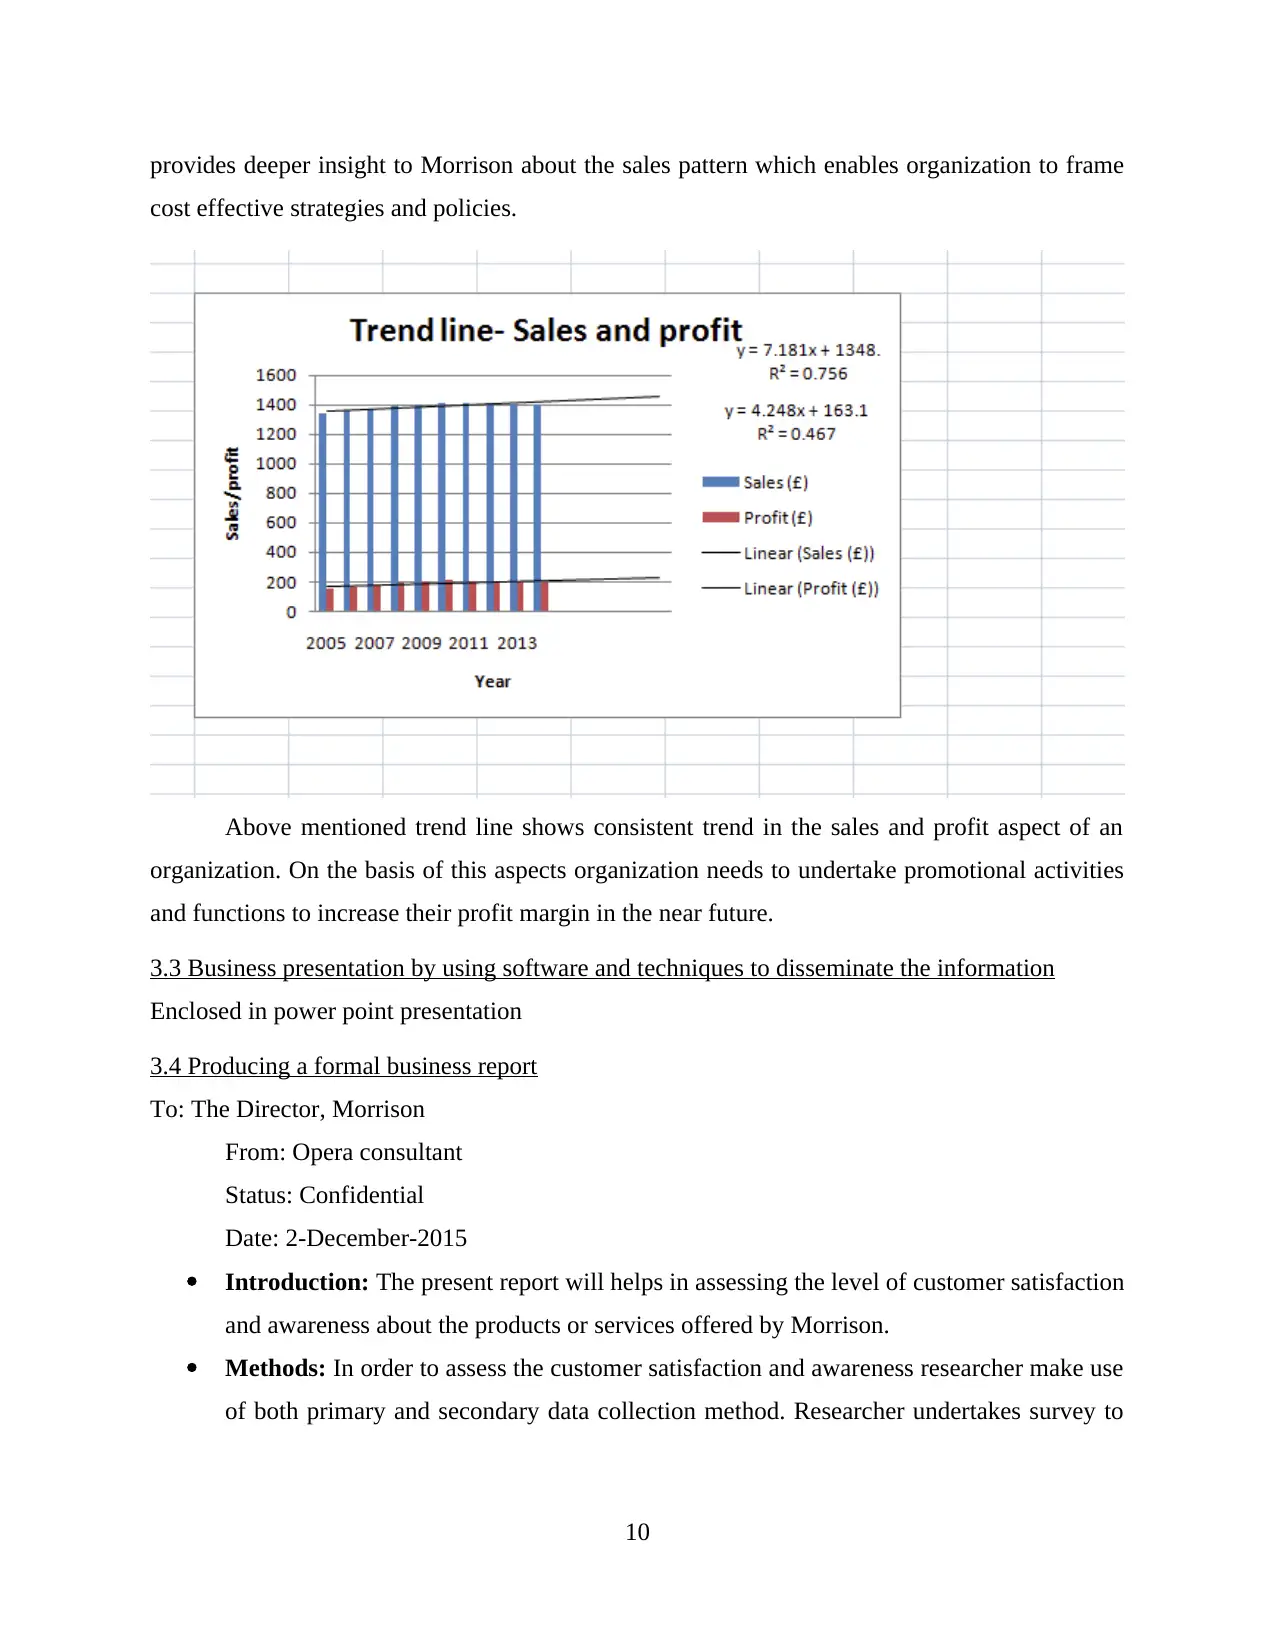
provides deeper insight to Morrison about the sales pattern which enables organization to frame
cost effective strategies and policies.
Above mentioned trend line shows consistent trend in the sales and profit aspect of an
organization. On the basis of this aspects organization needs to undertake promotional activities
and functions to increase their profit margin in the near future.
3.3 Business presentation by using software and techniques to disseminate the information
Enclosed in power point presentation
3.4 Producing a formal business report
To: The Director, Morrison
From: Opera consultant
Status: Confidential
Date: 2-December-2015
Introduction: The present report will helps in assessing the level of customer satisfaction
and awareness about the products or services offered by Morrison.
Methods: In order to assess the customer satisfaction and awareness researcher make use
of both primary and secondary data collection method. Researcher undertakes survey to
10
⊘ This is a preview!⊘
Do you want full access?
Subscribe today to unlock all pages.
Trusted by 1+ million students worldwide
1 out of 15
Related Documents


Your All-in-One AI-Powered Toolkit for Academic Success.
+13062052269
info@desklib.com
Available 24*7 on WhatsApp / Email
![[object Object]](/_next/static/media/star-bottom.7253800d.svg)
Unlock your academic potential
Copyright © 2020–2026 A2Z Services. All Rights Reserved. Developed and managed by ZUCOL.