Business Decision Making and Data Analysis Report: Murano Restaurant
VerifiedAdded on 2020/06/04
|28
|4915
|45
Report
AI Summary
This report provides a comprehensive analysis of data collection and decision-making processes for Murano restaurant, focusing on its potential expansion in London. The report begins with an introduction to business decision-making and its significance, followed by a detailed exploration of Task 1, which covers the data collection plan, survey methods, sampling framework, and questionnaire design. Task 2 delves into data estimation techniques, including mean, median, and mode, along with data dispersion analysis using standard deviation and variance. Task 3 presents graphical representations of the survey results, trend line forecasting, and a PowerPoint presentation of the collected data, culminating in a business report. Finally, Task 4 examines information processing tools, project planning, and financial/investment appraisal techniques, such as NPV and IRR, used for decision-making. The report concludes with a summary of the key findings and references used throughout the analysis.

BUSINESS DECISION
MAKING
MAKING
Paraphrase This Document
Need a fresh take? Get an instant paraphrase of this document with our AI Paraphraser
TABLE OF CONTENTS
INTRODUCTION...........................................................................................................................1
TASK 1............................................................................................................................................1
1.1 Data collection plan...............................................................................................................1
1.2 Survey methods and sampling framework............................................................................2
1.3 Questionnaire for data collection..........................................................................................3
TASK 2............................................................................................................................................5
2.1 Estimation on collected data.................................................................................................5
2.2 Data estimations on conducting survey.................................................................................6
2.3 Dispersion of collected data..................................................................................................8
2.4 Quartiles and correlation of collected data............................................................................9
TASK 3..........................................................................................................................................10
3.1 Graphical presentation on conducting survey.....................................................................10
3.2 Trend line method for forecasting on further business operations......................................15
3.3 Power point presentation of collected data.........................................................................16
3.4 Business report....................................................................................................................16
TASK 4..........................................................................................................................................17
4.1 Information processing tools...............................................................................................17
4.2 Project plan..........................................................................................................................18
4.3 Financial/investment appraisal techniques for decision making.........................................20
CONCLUSION..............................................................................................................................22
REFERENCES..............................................................................................................................23
INDEX OF TABLES
Table 1: Data collection plan for Murano restaurant.......................................................................1
Table 1: Data collection plan for Murano restaurant.......................................................................1
⊘ This is a preview!⊘
Do you want full access?
Subscribe today to unlock all pages.
Trusted by 1+ million students worldwide
ILLUSTRATION INDEX
Illustration 1: Formula used to calculate mean value......................................................................6
Illustration 2: Formula used for odd number of respondents...........................................................6
Illustration 3: Formula used for evaluating SD................................................................................9
Illustration 4: Age group of respondents.......................................................................................11
Illustration 5: Satisfaction level of respondents with Murano restaurant.....................................12
Illustration 6: The most attracted service of Murano restaurant....................................................13
Illustration 7: Food dish attracted at most......................................................................................14
Illustration 8: Service required to be improved.............................................................................15
Illustration 9: Trend line for forecasting on further implementation.............................................16
Illustration 10: Project plan............................................................................................................18
Illustration 11: Gantt chart.............................................................................................................19
Illustration 12: Network diagram...................................................................................................19
Illustration 13: Time schedule of the project.................................................................................20
Illustration 14: Formula used for calculating NPV........................................................................21
Illustration 15: NPV ......................................................................................................................21
Illustration 16: IRR........................................................................................................................22
Paraphrase This Document
Need a fresh take? Get an instant paraphrase of this document with our AI Paraphraser
INTRODUCTION
Decision making is an essential for creating planning and forecasting regarding further
business implementations. It is appropriate for managing entire business operations and
improving quality services at higher level. Present report is based on understanding data
collection and decision making tools for Murano restaurant which is going to setting up its new
entity in London. It provides food services and accommodation to a million people worldwide. In
this regard, data collection and storage tools as of gathering information and effective decision
making is to be discussed. Likewise, information and communication technology (ICT) for data
processing and decision making will be introduced. However, significance of business decision
making can be understood for establishing new entity of the restaurant in this report.
TASK 1
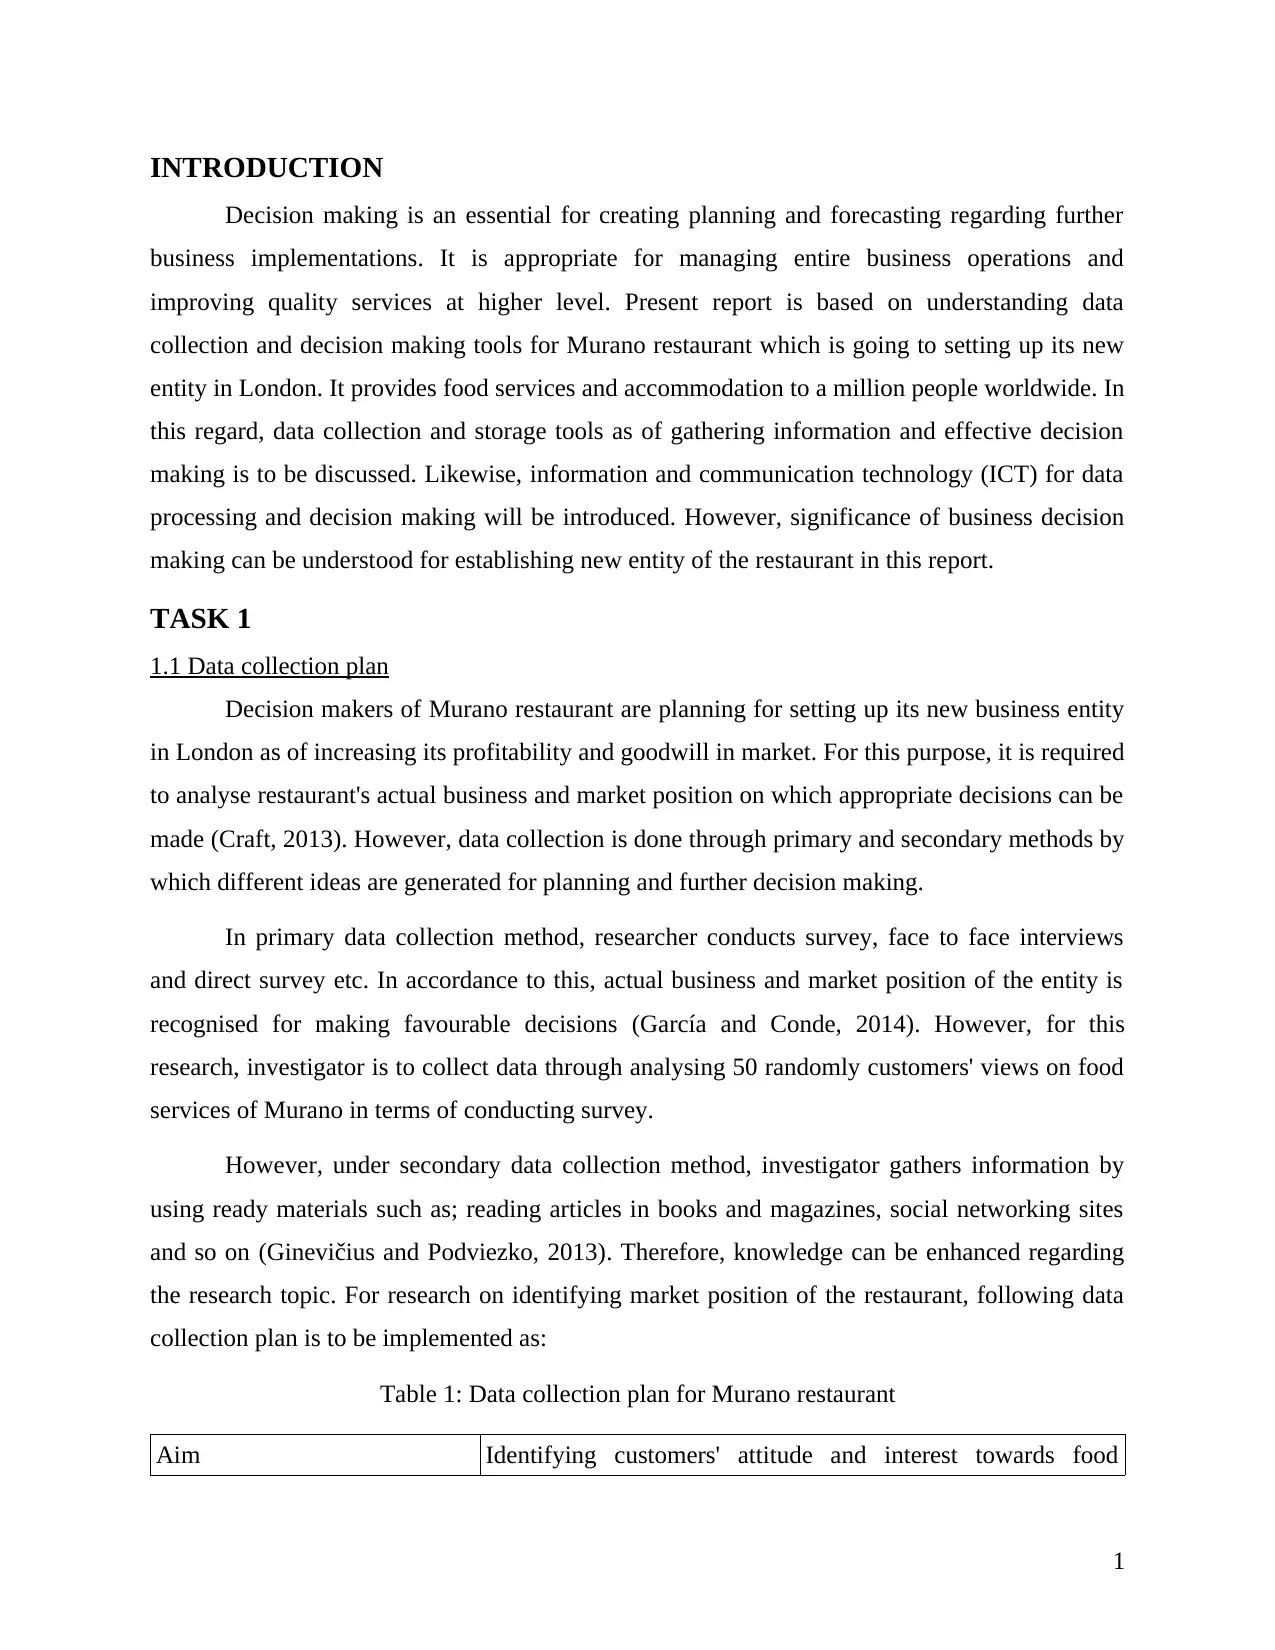
1.1 Data collection plan
Decision makers of Murano restaurant are planning for setting up its new business entity
in London as of increasing its profitability and goodwill in market. For this purpose, it is required
to analyse restaurant's actual business and market position on which appropriate decisions can be
made (Craft, 2013). However, data collection is done through primary and secondary methods by
which different ideas are generated for planning and further decision making.
In primary data collection method, researcher conducts survey, face to face interviews
and direct survey etc. In accordance to this, actual business and market position of the entity is
recognised for making favourable decisions (García and Conde, 2014). However, for this
research, investigator is to collect data through analysing 50 randomly customers' views on food
services of Murano in terms of conducting survey.
However, under secondary data collection method, investigator gathers information by
using ready materials such as; reading articles in books and magazines, social networking sites
and so on (Ginevičius and Podviezko, 2013). Therefore, knowledge can be enhanced regarding
the research topic. For research on identifying market position of the restaurant, following data
collection plan is to be implemented as:
Table 1: Data collection plan for Murano restaurant
Aim Identifying customers' attitude and interest towards food
1
Decision making is an essential for creating planning and forecasting regarding further
business implementations. It is appropriate for managing entire business operations and
improving quality services at higher level. Present report is based on understanding data
collection and decision making tools for Murano restaurant which is going to setting up its new
entity in London. It provides food services and accommodation to a million people worldwide. In
this regard, data collection and storage tools as of gathering information and effective decision
making is to be discussed. Likewise, information and communication technology (ICT) for data
processing and decision making will be introduced. However, significance of business decision
making can be understood for establishing new entity of the restaurant in this report.
TASK 1
1.1 Data collection plan
Decision makers of Murano restaurant are planning for setting up its new business entity
in London as of increasing its profitability and goodwill in market. For this purpose, it is required
to analyse restaurant's actual business and market position on which appropriate decisions can be
made (Craft, 2013). However, data collection is done through primary and secondary methods by
which different ideas are generated for planning and further decision making.
In primary data collection method, researcher conducts survey, face to face interviews
and direct survey etc. In accordance to this, actual business and market position of the entity is
recognised for making favourable decisions (García and Conde, 2014). However, for this
research, investigator is to collect data through analysing 50 randomly customers' views on food
services of Murano in terms of conducting survey.
However, under secondary data collection method, investigator gathers information by
using ready materials such as; reading articles in books and magazines, social networking sites
and so on (Ginevičius and Podviezko, 2013). Therefore, knowledge can be enhanced regarding
the research topic. For research on identifying market position of the restaurant, following data
collection plan is to be implemented as:
Table 1: Data collection plan for Murano restaurant
Aim Identifying customers' attitude and interest towards food
1
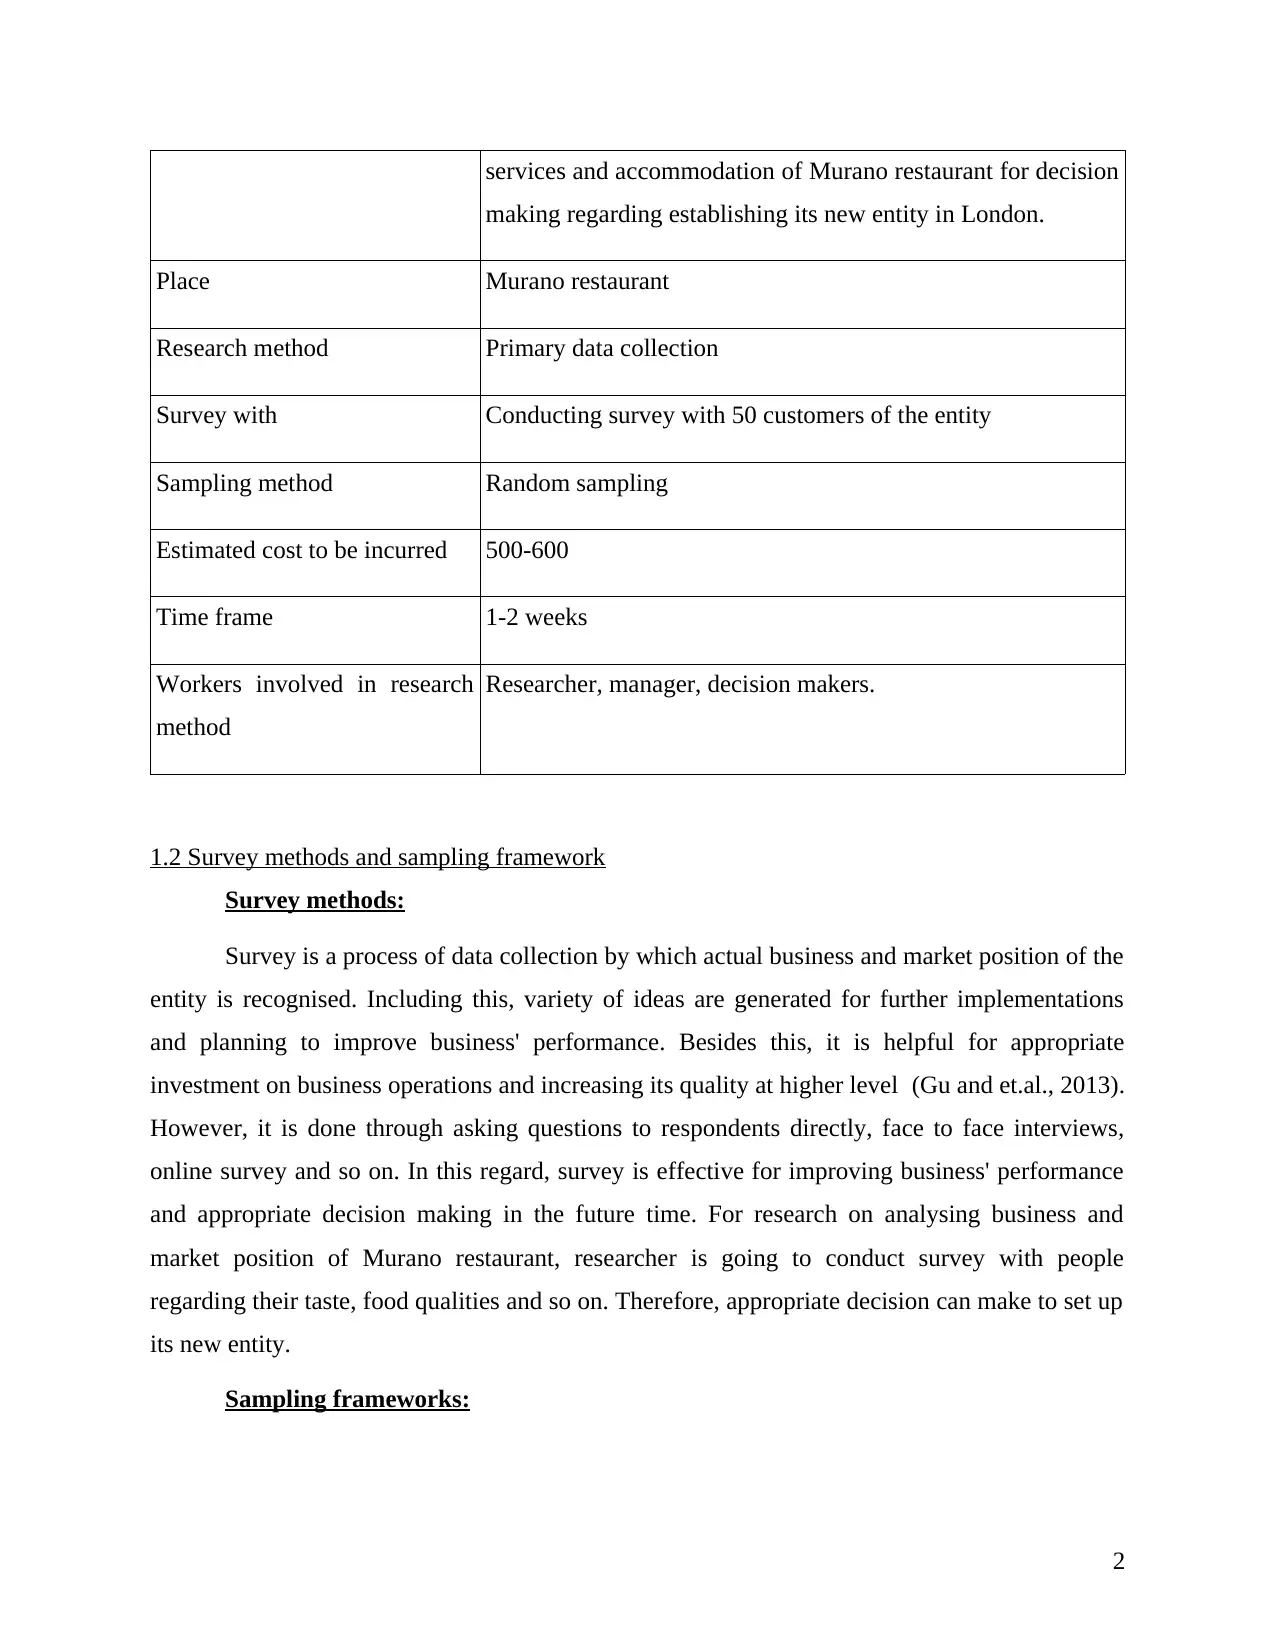
services and accommodation of Murano restaurant for decision
making regarding establishing its new entity in London.
Place Murano restaurant
Research method Primary data collection
Survey with Conducting survey with 50 customers of the entity
Sampling method Random sampling
Estimated cost to be incurred 500-600
Time frame 1-2 weeks
Workers involved in research
method
Researcher, manager, decision makers.
1.2 Survey methods and sampling framework
Survey methods:
Survey is a process of data collection by which actual business and market position of the
entity is recognised. Including this, variety of ideas are generated for further implementations
and planning to improve business' performance. Besides this, it is helpful for appropriate
investment on business operations and increasing its quality at higher level (Gu and et.al., 2013).
However, it is done through asking questions to respondents directly, face to face interviews,
online survey and so on. In this regard, survey is effective for improving business' performance
and appropriate decision making in the future time. For research on analysing business and
market position of Murano restaurant, researcher is going to conduct survey with people
regarding their taste, food qualities and so on. Therefore, appropriate decision can make to set up
its new entity.
Sampling frameworks:
2
⊘ This is a preview!⊘
Do you want full access?
Subscribe today to unlock all pages.
Trusted by 1+ million students worldwide
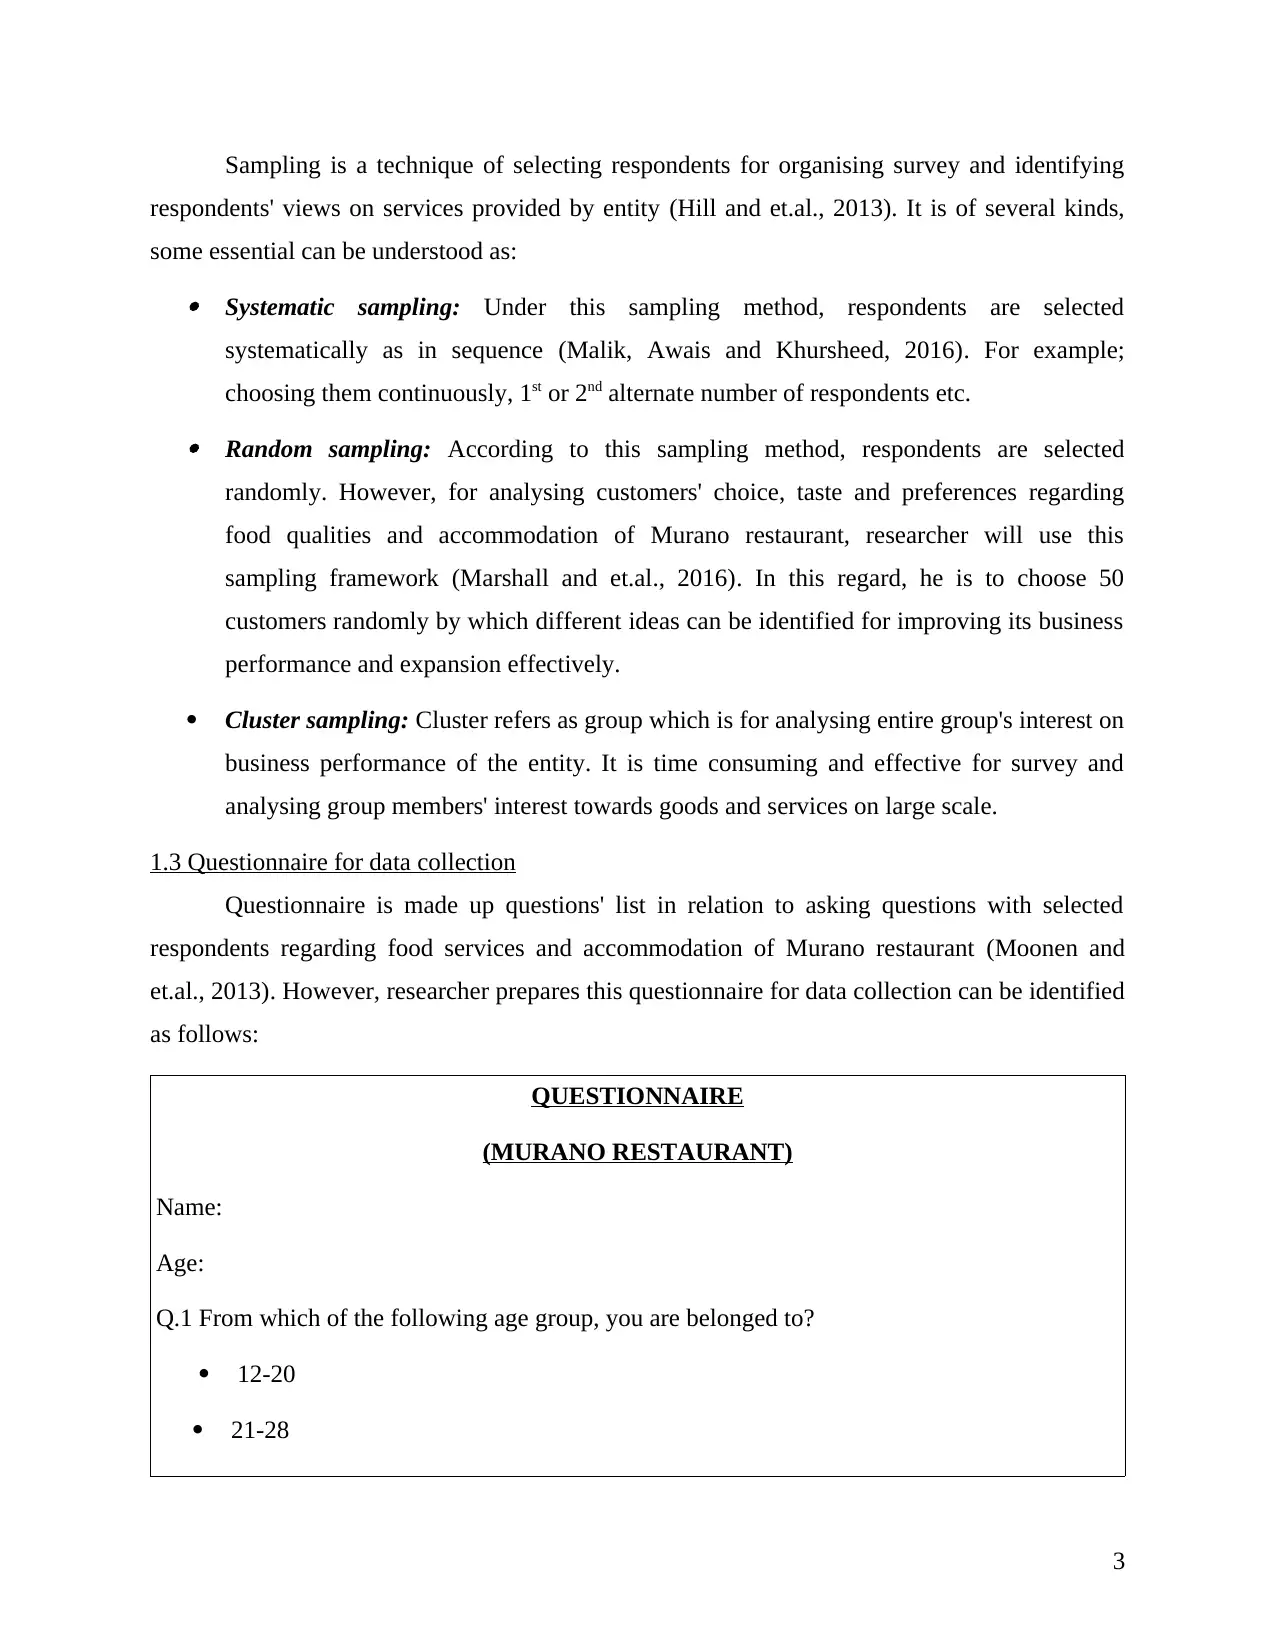
Sampling is a technique of selecting respondents for organising survey and identifying
respondents' views on services provided by entity (Hill and et.al., 2013). It is of several kinds,
some essential can be understood as: Systematic sampling: Under this sampling method, respondents are selected
systematically as in sequence (Malik, Awais and Khursheed, 2016). For example;
choosing them continuously, 1st or 2nd alternate number of respondents etc. Random sampling: According to this sampling method, respondents are selected
randomly. However, for analysing customers' choice, taste and preferences regarding
food qualities and accommodation of Murano restaurant, researcher will use this
sampling framework (Marshall and et.al., 2016). In this regard, he is to choose 50
customers randomly by which different ideas can be identified for improving its business
performance and expansion effectively.
Cluster sampling: Cluster refers as group which is for analysing entire group's interest on
business performance of the entity. It is time consuming and effective for survey and
analysing group members' interest towards goods and services on large scale.
1.3 Questionnaire for data collection
Questionnaire is made up questions' list in relation to asking questions with selected
respondents regarding food services and accommodation of Murano restaurant (Moonen and
et.al., 2013). However, researcher prepares this questionnaire for data collection can be identified
as follows:
QUESTIONNAIRE
(MURANO RESTAURANT)
Name:
Age:
Q.1 From which of the following age group, you are belonged to?
12-20
21-28
3
Paraphrase This Document
Need a fresh take? Get an instant paraphrase of this document with our AI Paraphraser
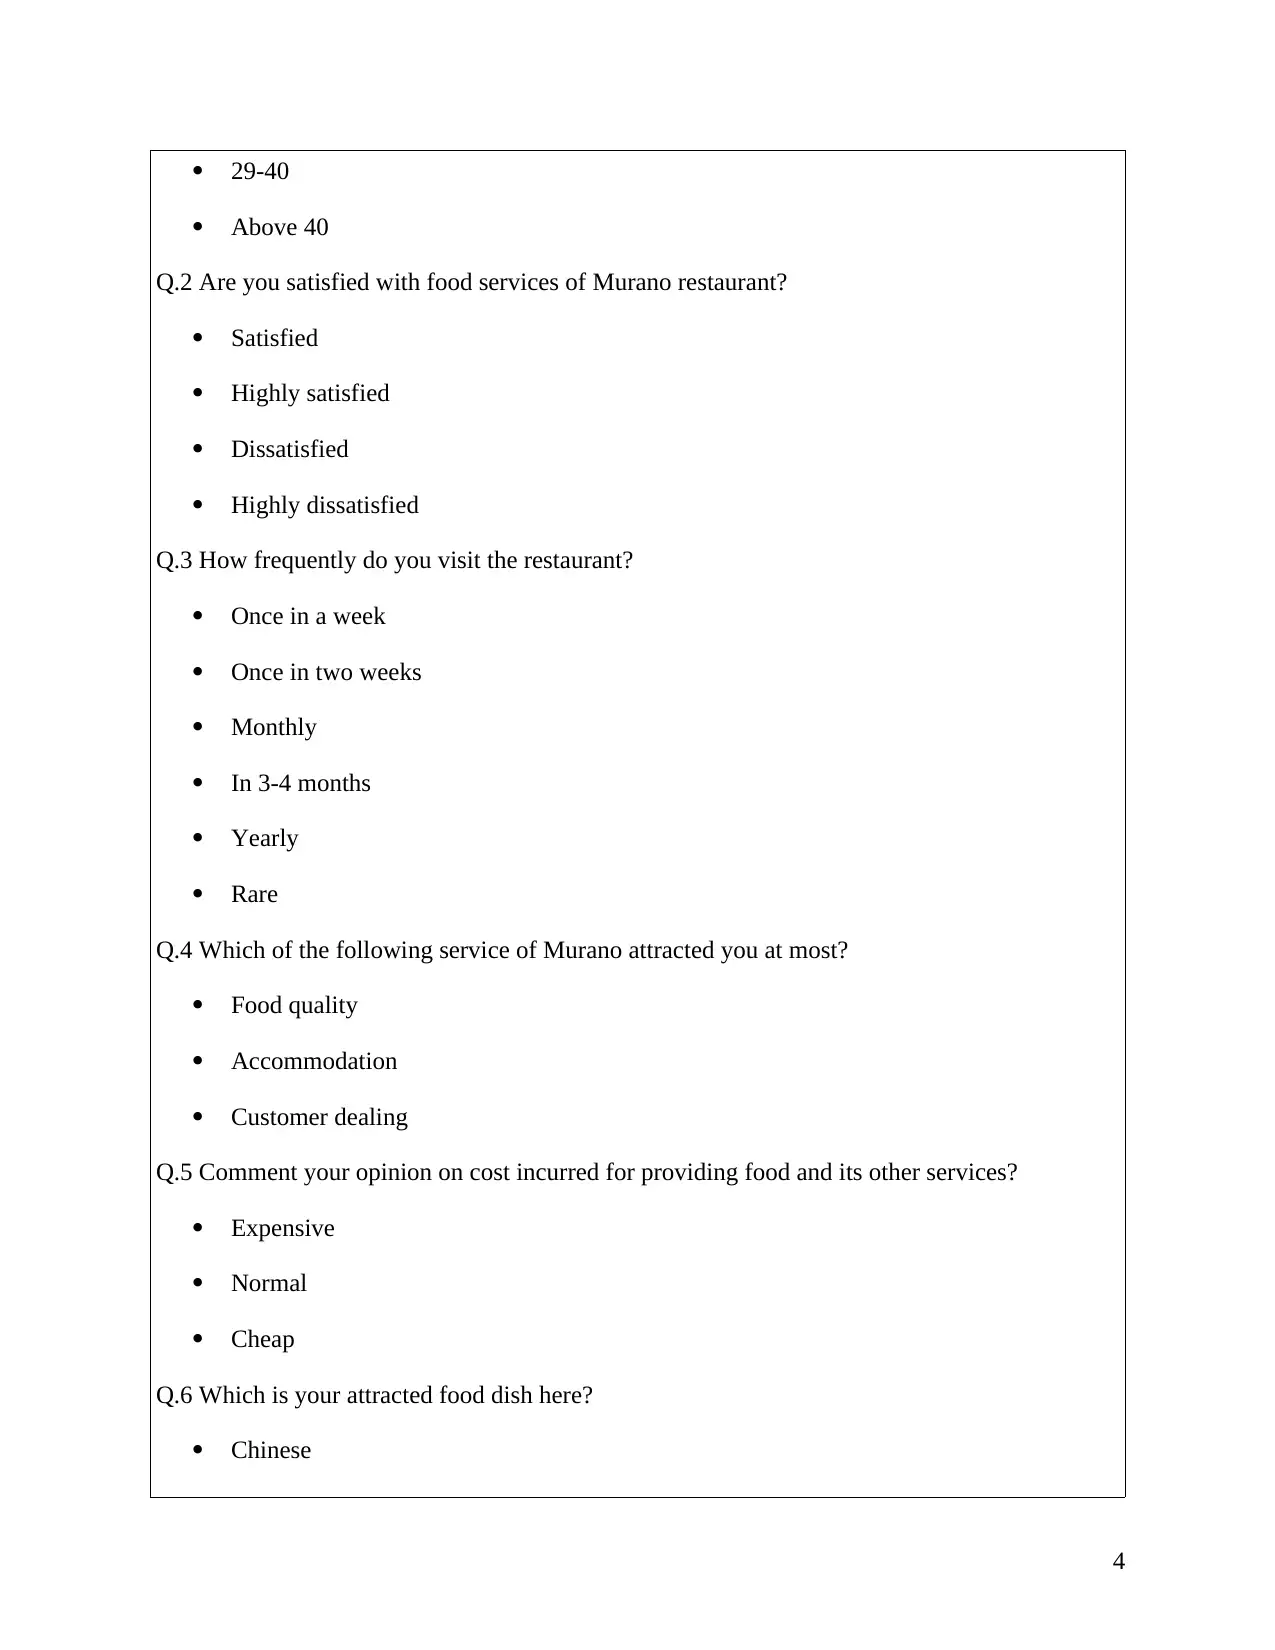
29-40
Above 40
Q.2 Are you satisfied with food services of Murano restaurant?
Satisfied
Highly satisfied
Dissatisfied
Highly dissatisfied
Q.3 How frequently do you visit the restaurant?
Once in a week
Once in two weeks
Monthly
In 3-4 months
Yearly
Rare
Q.4 Which of the following service of Murano attracted you at most?
Food quality
Accommodation
Customer dealing
Q.5 Comment your opinion on cost incurred for providing food and its other services?
Expensive
Normal
Cheap
Q.6 Which is your attracted food dish here?
Chinese
4
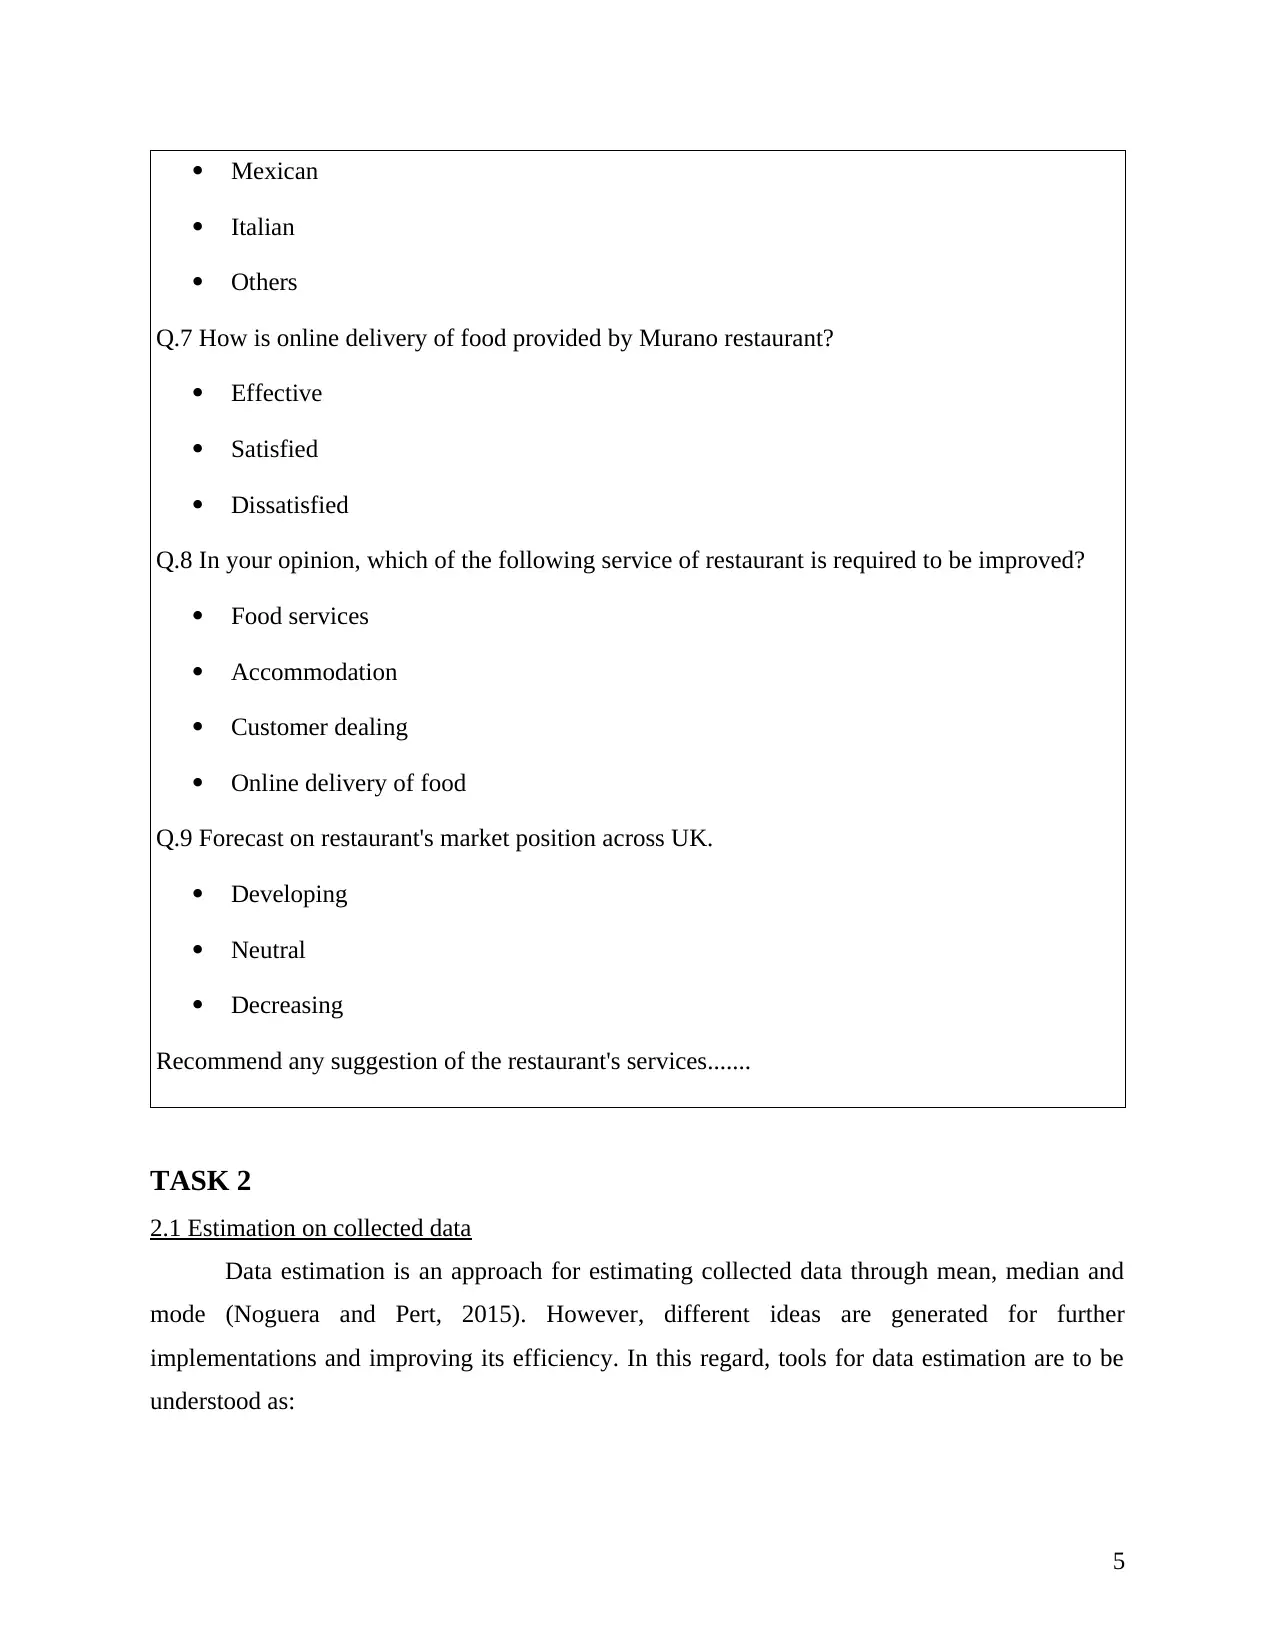
Mexican
Italian
Others
Q.7 How is online delivery of food provided by Murano restaurant?
Effective
Satisfied
Dissatisfied
Q.8 In your opinion, which of the following service of restaurant is required to be improved?
Food services
Accommodation
Customer dealing
Online delivery of food
Q.9 Forecast on restaurant's market position across UK.
Developing
Neutral
Decreasing
Recommend any suggestion of the restaurant's services.......
TASK 2
2.1 Estimation on collected data
Data estimation is an approach for estimating collected data through mean, median and
mode (Noguera and Pert, 2015). However, different ideas are generated for further
implementations and improving its efficiency. In this regard, tools for data estimation are to be
understood as:
5
⊘ This is a preview!⊘
Do you want full access?
Subscribe today to unlock all pages.
Trusted by 1+ million students worldwide
Mean: It is an average of collected data which is easy and convenient for estimation and
decision making for the future years. For evaluating mean, following formula is used as:
Illustration 1:
Formula used to
calculate mean
value
Median: It is evaluated as mid value of the overall collected data for decision making.
However, respond gained at mid pointy is basis of gathered information and further
implementation for business operations (Ruff and Pert, 2013). In this regard, formula
used for calculating median is as below:
For even number of respondents:
Median= (n/2) th term
For odd number of respondents:
Illustration 2: Formula used for odd number of respondents
Mode: For evaluating mode of the collected data, gained responds frequently and at the
highest level is considered. On behalf of calculating this mode value, further decisions
are made for the entity's effectiveness.
6
Paraphrase This Document
Need a fresh take? Get an instant paraphrase of this document with our AI Paraphraser
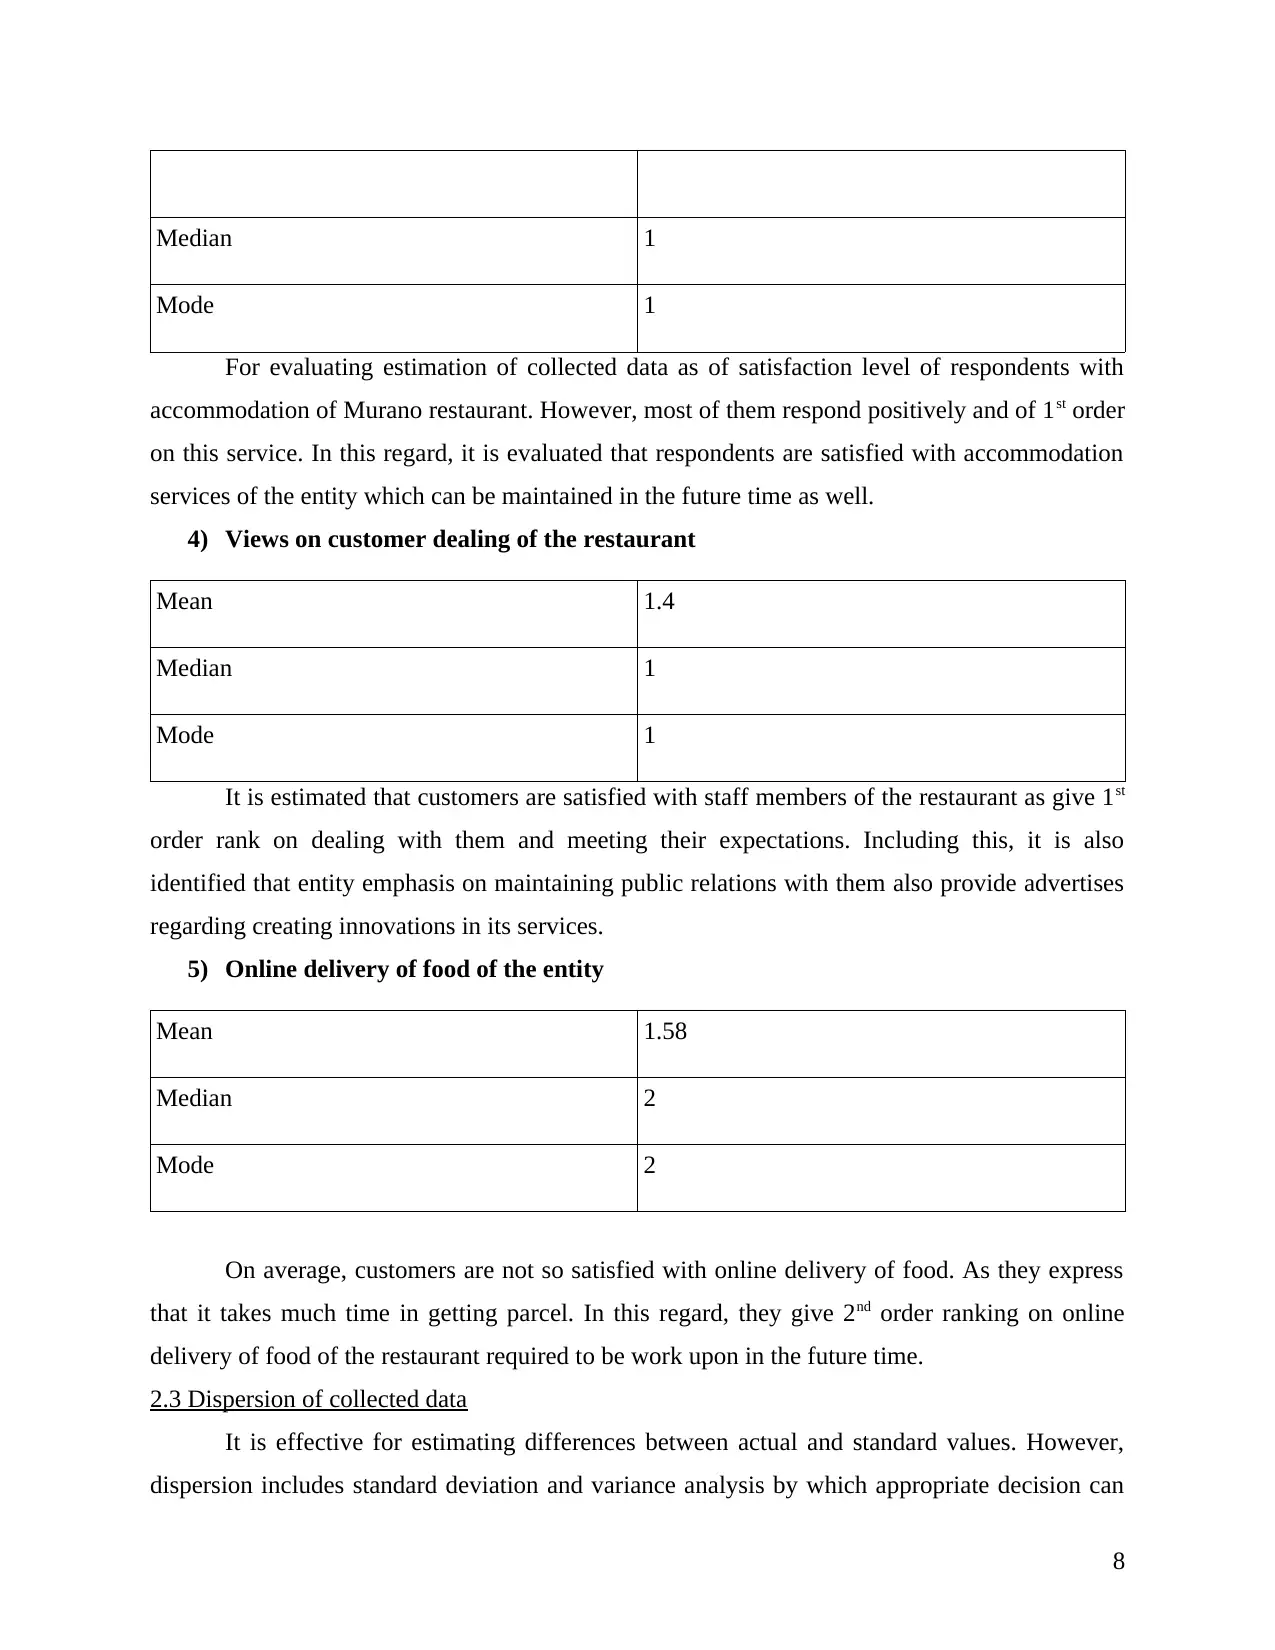
2.2 Data estimations on conducting survey
On estimation on collected data as respondents' views on Murano restaurant's services,
researcher is to ask them for ranking (Sutherland and Holstead, 2014). In this regard, customers
ranked differently on food services, accommodation and other facilities of the entity. However,
50 respondents are selected randomly for asking questions and estimating on average as
mentioned below:
1) Satisfaction with services of Murano restaurant
Mean 1.38
Median 1
Mode 1
It is identified that on average 1.38 is evaluated as of mean on satisfaction level of
respondents on services provided by Murano restaurant. Including this, it is also evaluated that
most of them give 1st order tank on their satisfaction with the services. On this basis, it is
evaluated that customers are satisfied and their interest towards its services can be maintained
and increased at higher level.
2) Respondents' views on food services
Mean 1.3
Median 1
Mode 1
On average, 1.3 estimation is identified on food services of the Murano restaurant.
Likewise, median and mode value is similar of 1st order ranking on variety of food and quality in
wide range. Therefore, customers' attraction towards food quality and variety of dishes can be
maintained efficiently.
3) Accommodation services of the entity
Mean 1.34
7
Median 1
Mode 1
For evaluating estimation of collected data as of satisfaction level of respondents with
accommodation of Murano restaurant. However, most of them respond positively and of 1st order
on this service. In this regard, it is evaluated that respondents are satisfied with accommodation
services of the entity which can be maintained in the future time as well.
4) Views on customer dealing of the restaurant
Mean 1.4
Median 1
Mode 1
It is estimated that customers are satisfied with staff members of the restaurant as give 1st
order rank on dealing with them and meeting their expectations. Including this, it is also
identified that entity emphasis on maintaining public relations with them also provide advertises
regarding creating innovations in its services.
5) Online delivery of food of the entity
Mean 1.58
Median 2
Mode 2
On average, customers are not so satisfied with online delivery of food. As they express
that it takes much time in getting parcel. In this regard, they give 2nd order ranking on online
delivery of food of the restaurant required to be work upon in the future time.
2.3 Dispersion of collected data
It is effective for estimating differences between actual and standard values. However,
dispersion includes standard deviation and variance analysis by which appropriate decision can
8
Mode 1
For evaluating estimation of collected data as of satisfaction level of respondents with
accommodation of Murano restaurant. However, most of them respond positively and of 1st order
on this service. In this regard, it is evaluated that respondents are satisfied with accommodation
services of the entity which can be maintained in the future time as well.
4) Views on customer dealing of the restaurant
Mean 1.4
Median 1
Mode 1
It is estimated that customers are satisfied with staff members of the restaurant as give 1st
order rank on dealing with them and meeting their expectations. Including this, it is also
identified that entity emphasis on maintaining public relations with them also provide advertises
regarding creating innovations in its services.
5) Online delivery of food of the entity
Mean 1.58
Median 2
Mode 2
On average, customers are not so satisfied with online delivery of food. As they express
that it takes much time in getting parcel. In this regard, they give 2nd order ranking on online
delivery of food of the restaurant required to be work upon in the future time.
2.3 Dispersion of collected data
It is effective for estimating differences between actual and standard values. However,
dispersion includes standard deviation and variance analysis by which appropriate decision can
8
⊘ This is a preview!⊘
Do you want full access?
Subscribe today to unlock all pages.
Trusted by 1+ million students worldwide
1 out of 28
Related Documents


Your All-in-One AI-Powered Toolkit for Academic Success.
+13062052269
info@desklib.com
Available 24*7 on WhatsApp / Email
![[object Object]](/_next/static/media/star-bottom.7253800d.svg)
Unlock your academic potential
Copyright © 2020–2026 A2Z Services. All Rights Reserved. Developed and managed by ZUCOL.