Business Decision Making Report for Murano Restaurant Expansion
VerifiedAdded on 2020/06/04
|22
|4233
|32
Report
AI Summary
This report examines the business decision-making process for Murano Restaurant, focusing on its potential expansion. It details the use of primary and secondary data collection methods, including questionnaires and market research. The report covers research methodologies, sampling frameworks, and questionnaire design. Data analysis techniques, such as mean, median, mode, and measures of dispersion (range, standard deviation), are employed to interpret findings. The report also explores the use of various charts and graphs, trend lines, and information systems for decision-making, along with investment appraisal tools. The analysis includes financial data analysis of past sales and profits to support the decision-making process for the restaurant's expansion plans, considering factors like market share and customer satisfaction.

Business decision Making
Paraphrase This Document
Need a fresh take? Get an instant paraphrase of this document with our AI Paraphraser
Table of Contents
INTRODUCTION...........................................................................................................................1
TASK 1............................................................................................................................................1
1.1: Sources of data collection....................................................................................................1
1.2: Research methodologies and sampling framework.............................................................2
1.3: Questionnaire designing ......................................................................................................3
TASK 2............................................................................................................................................5
2.1: Designing data with the help of representative values.........................................................5
2.2: Evaluation of data those are collected from research .........................................................7
TASK 3..........................................................................................................................................10
3.1: Different charts and graphs................................................................................................10
3.2: Trend line...........................................................................................................................14
3.3: Covered in PPT..................................................................................................................15
TASK 4..........................................................................................................................................16
4.1: Use of information methods system in decision-making...................................................16
4.2: Critical path .......................................................................................................................17
4.3: Various investment appraisal tools....................................................................................18
CONCLUSION..............................................................................................................................18
REFERENCES..............................................................................................................................19
.......................................................................................................................................................19
.......................................................................................................................................................19

⊘ This is a preview!⊘
Do you want full access?
Subscribe today to unlock all pages.
Trusted by 1+ million students worldwide
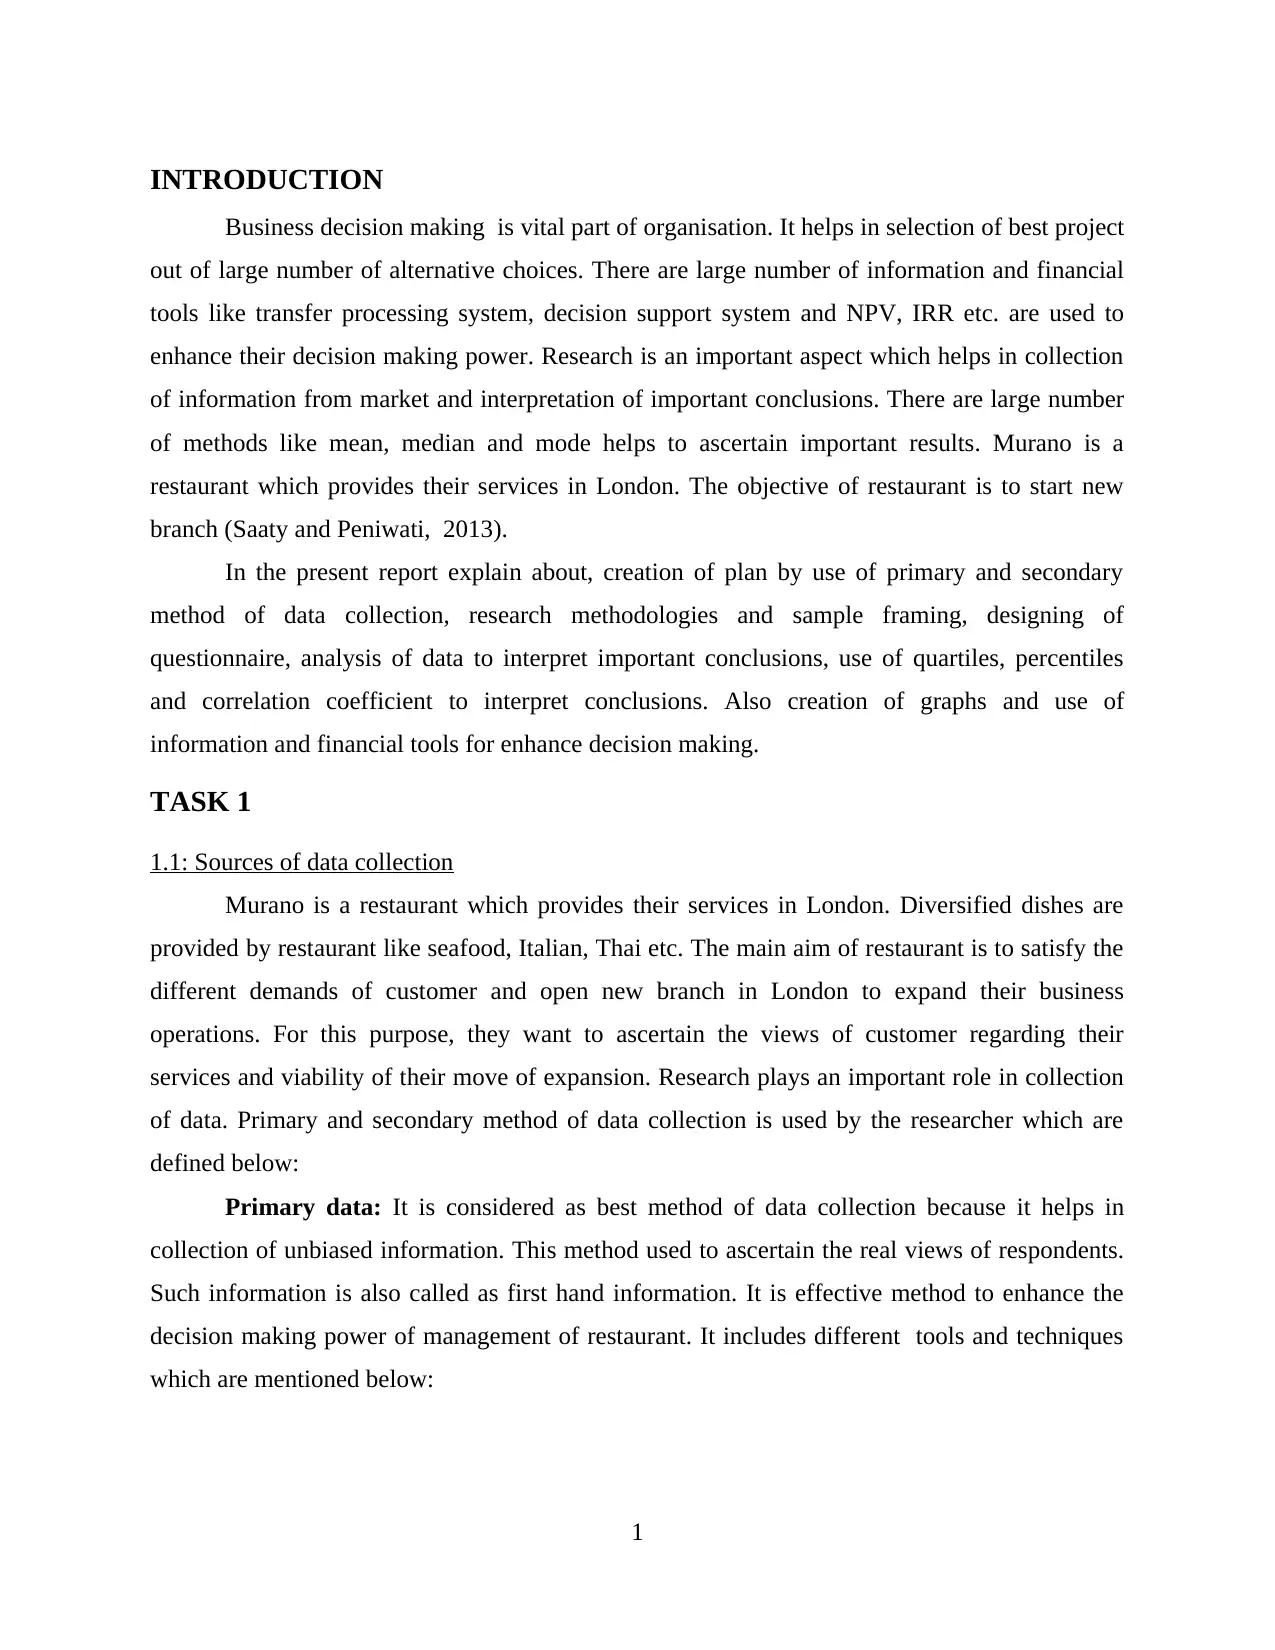
INTRODUCTION
Business decision making is vital part of organisation. It helps in selection of best project
out of large number of alternative choices. There are large number of information and financial
tools like transfer processing system, decision support system and NPV, IRR etc. are used to
enhance their decision making power. Research is an important aspect which helps in collection
of information from market and interpretation of important conclusions. There are large number
of methods like mean, median and mode helps to ascertain important results. Murano is a
restaurant which provides their services in London. The objective of restaurant is to start new
branch (Saaty and Peniwati, 2013).
In the present report explain about, creation of plan by use of primary and secondary
method of data collection, research methodologies and sample framing, designing of
questionnaire, analysis of data to interpret important conclusions, use of quartiles, percentiles
and correlation coefficient to interpret conclusions. Also creation of graphs and use of
information and financial tools for enhance decision making.
TASK 1
1.1: Sources of data collection
Murano is a restaurant which provides their services in London. Diversified dishes are
provided by restaurant like seafood, Italian, Thai etc. The main aim of restaurant is to satisfy the
different demands of customer and open new branch in London to expand their business
operations. For this purpose, they want to ascertain the views of customer regarding their
services and viability of their move of expansion. Research plays an important role in collection
of data. Primary and secondary method of data collection is used by the researcher which are
defined below:
Primary data: It is considered as best method of data collection because it helps in
collection of unbiased information. This method used to ascertain the real views of respondents.
Such information is also called as first hand information. It is effective method to enhance the
decision making power of management of restaurant. It includes different tools and techniques
which are mentioned below:
1
Paraphrase This Document
Need a fresh take? Get an instant paraphrase of this document with our AI Paraphraser
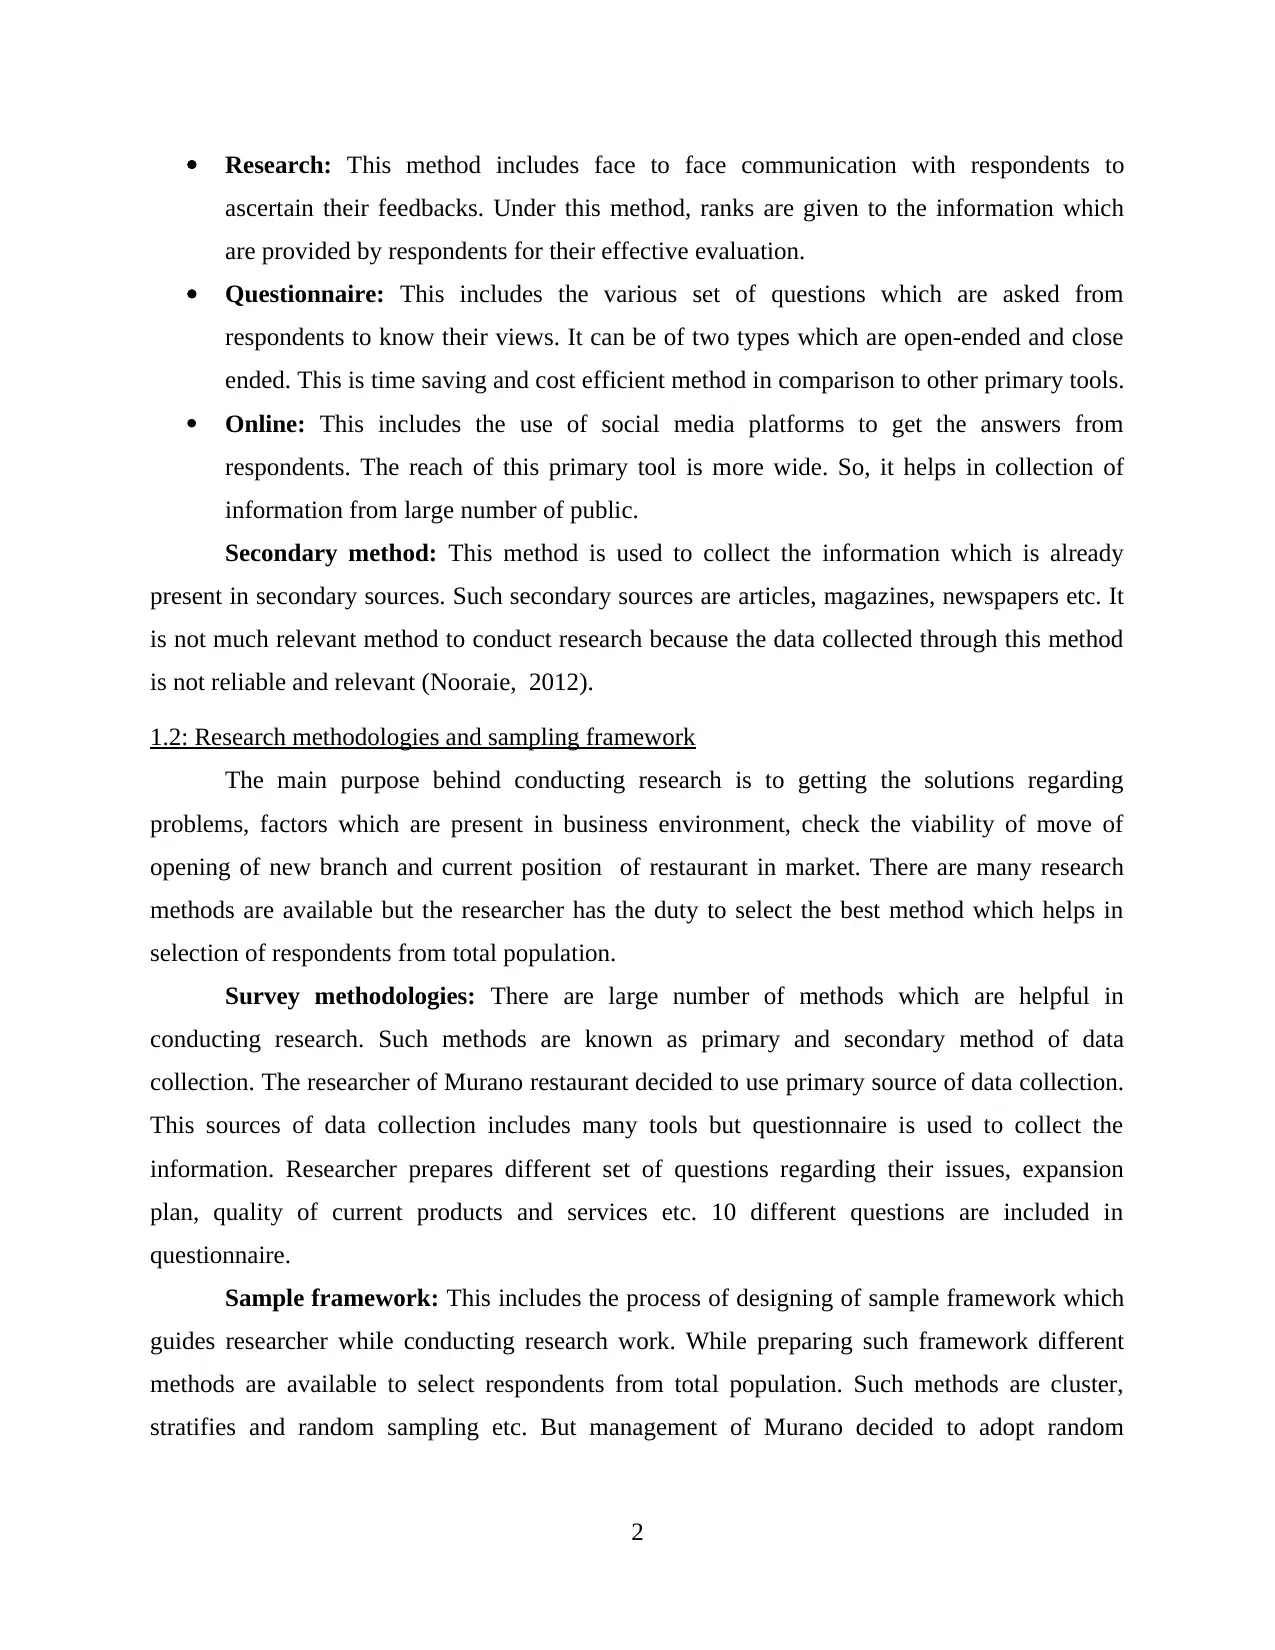
Research: This method includes face to face communication with respondents to
ascertain their feedbacks. Under this method, ranks are given to the information which
are provided by respondents for their effective evaluation.
Questionnaire: This includes the various set of questions which are asked from
respondents to know their views. It can be of two types which are open-ended and close
ended. This is time saving and cost efficient method in comparison to other primary tools.
Online: This includes the use of social media platforms to get the answers from
respondents. The reach of this primary tool is more wide. So, it helps in collection of
information from large number of public.
Secondary method: This method is used to collect the information which is already
present in secondary sources. Such secondary sources are articles, magazines, newspapers etc. It
is not much relevant method to conduct research because the data collected through this method
is not reliable and relevant (Nooraie, 2012).
1.2: Research methodologies and sampling framework
The main purpose behind conducting research is to getting the solutions regarding
problems, factors which are present in business environment, check the viability of move of
opening of new branch and current position of restaurant in market. There are many research
methods are available but the researcher has the duty to select the best method which helps in
selection of respondents from total population.
Survey methodologies: There are large number of methods which are helpful in
conducting research. Such methods are known as primary and secondary method of data
collection. The researcher of Murano restaurant decided to use primary source of data collection.
This sources of data collection includes many tools but questionnaire is used to collect the
information. Researcher prepares different set of questions regarding their issues, expansion
plan, quality of current products and services etc. 10 different questions are included in
questionnaire.
Sample framework: This includes the process of designing of sample framework which
guides researcher while conducting research work. While preparing such framework different
methods are available to select respondents from total population. Such methods are cluster,
stratifies and random sampling etc. But management of Murano decided to adopt random
2
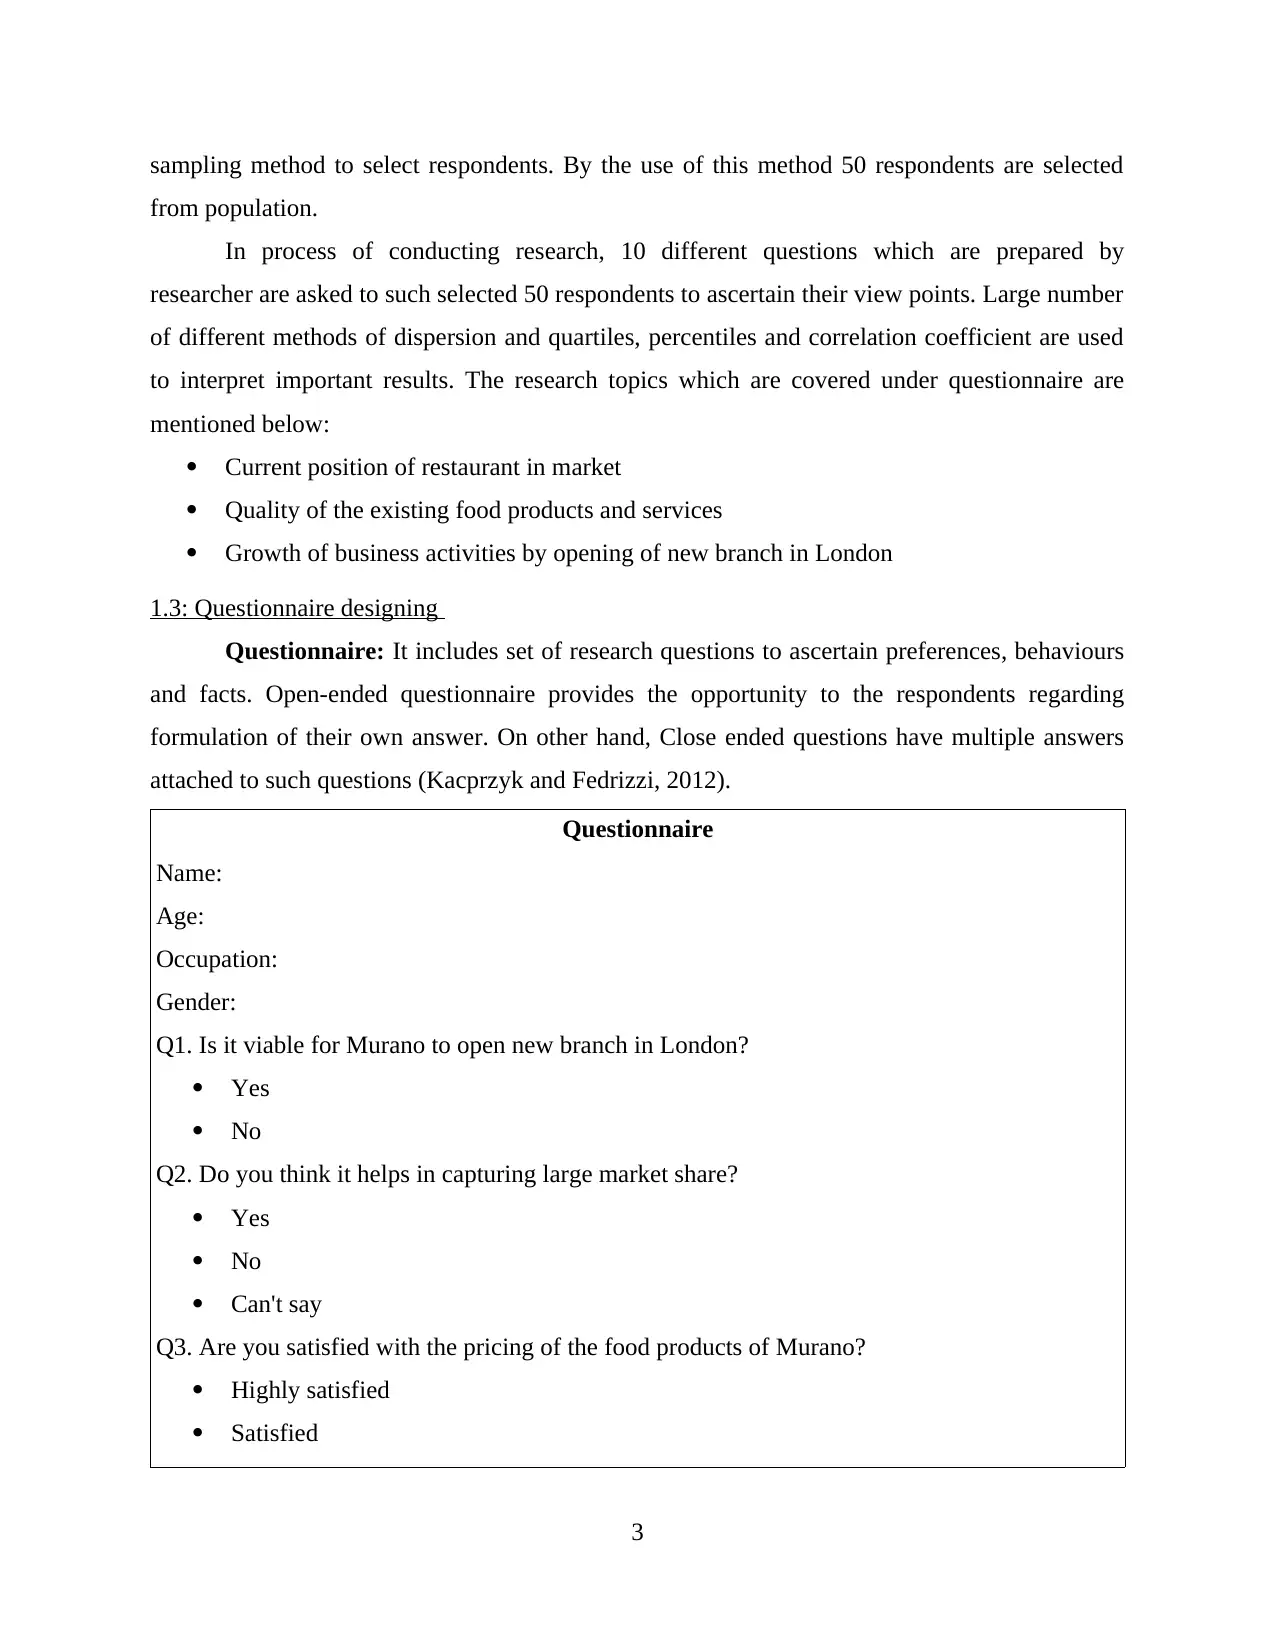
sampling method to select respondents. By the use of this method 50 respondents are selected
from population.
In process of conducting research, 10 different questions which are prepared by
researcher are asked to such selected 50 respondents to ascertain their view points. Large number
of different methods of dispersion and quartiles, percentiles and correlation coefficient are used
to interpret important results. The research topics which are covered under questionnaire are
mentioned below:
Current position of restaurant in market
Quality of the existing food products and services
Growth of business activities by opening of new branch in London
1.3: Questionnaire designing
Questionnaire: It includes set of research questions to ascertain preferences, behaviours
and facts. Open-ended questionnaire provides the opportunity to the respondents regarding
formulation of their own answer. On other hand, Close ended questions have multiple answers
attached to such questions (Kacprzyk and Fedrizzi, 2012).
Questionnaire
Name:
Age:
Occupation:
Gender:
Q1. Is it viable for Murano to open new branch in London?
Yes
No
Q2. Do you think it helps in capturing large market share?
Yes
No
Can't say
Q3. Are you satisfied with the pricing of the food products of Murano?
Highly satisfied
Satisfied
3
⊘ This is a preview!⊘
Do you want full access?
Subscribe today to unlock all pages.
Trusted by 1+ million students worldwide
Dissatisfied
Q4. What kind of dish you like most in Murano restaurant?
Italian
Thai
Seafood
Q5. What attracts you most in Murano restaurant?
Food
Services
Surroundings
Q6. Do you want some changes in existing services of Murano restaurant?
Yes
No
Q7. Are you satisfied with the quality of food items of Murano restaurant?
Highly satisfied
Satisfied
Dissatisfied
Q8. What place do you think best to open new branch of restaurant in London?
In city
Countryside
Near tourist destinations
Q9. Do you think adequate amounts of funds are available with the management of Murano
restaurant?
Yes
No
Q10. What you want to recommend to Murano restaurant to expand their busienss operations?
4
Paraphrase This Document
Need a fresh take? Get an instant paraphrase of this document with our AI Paraphraser
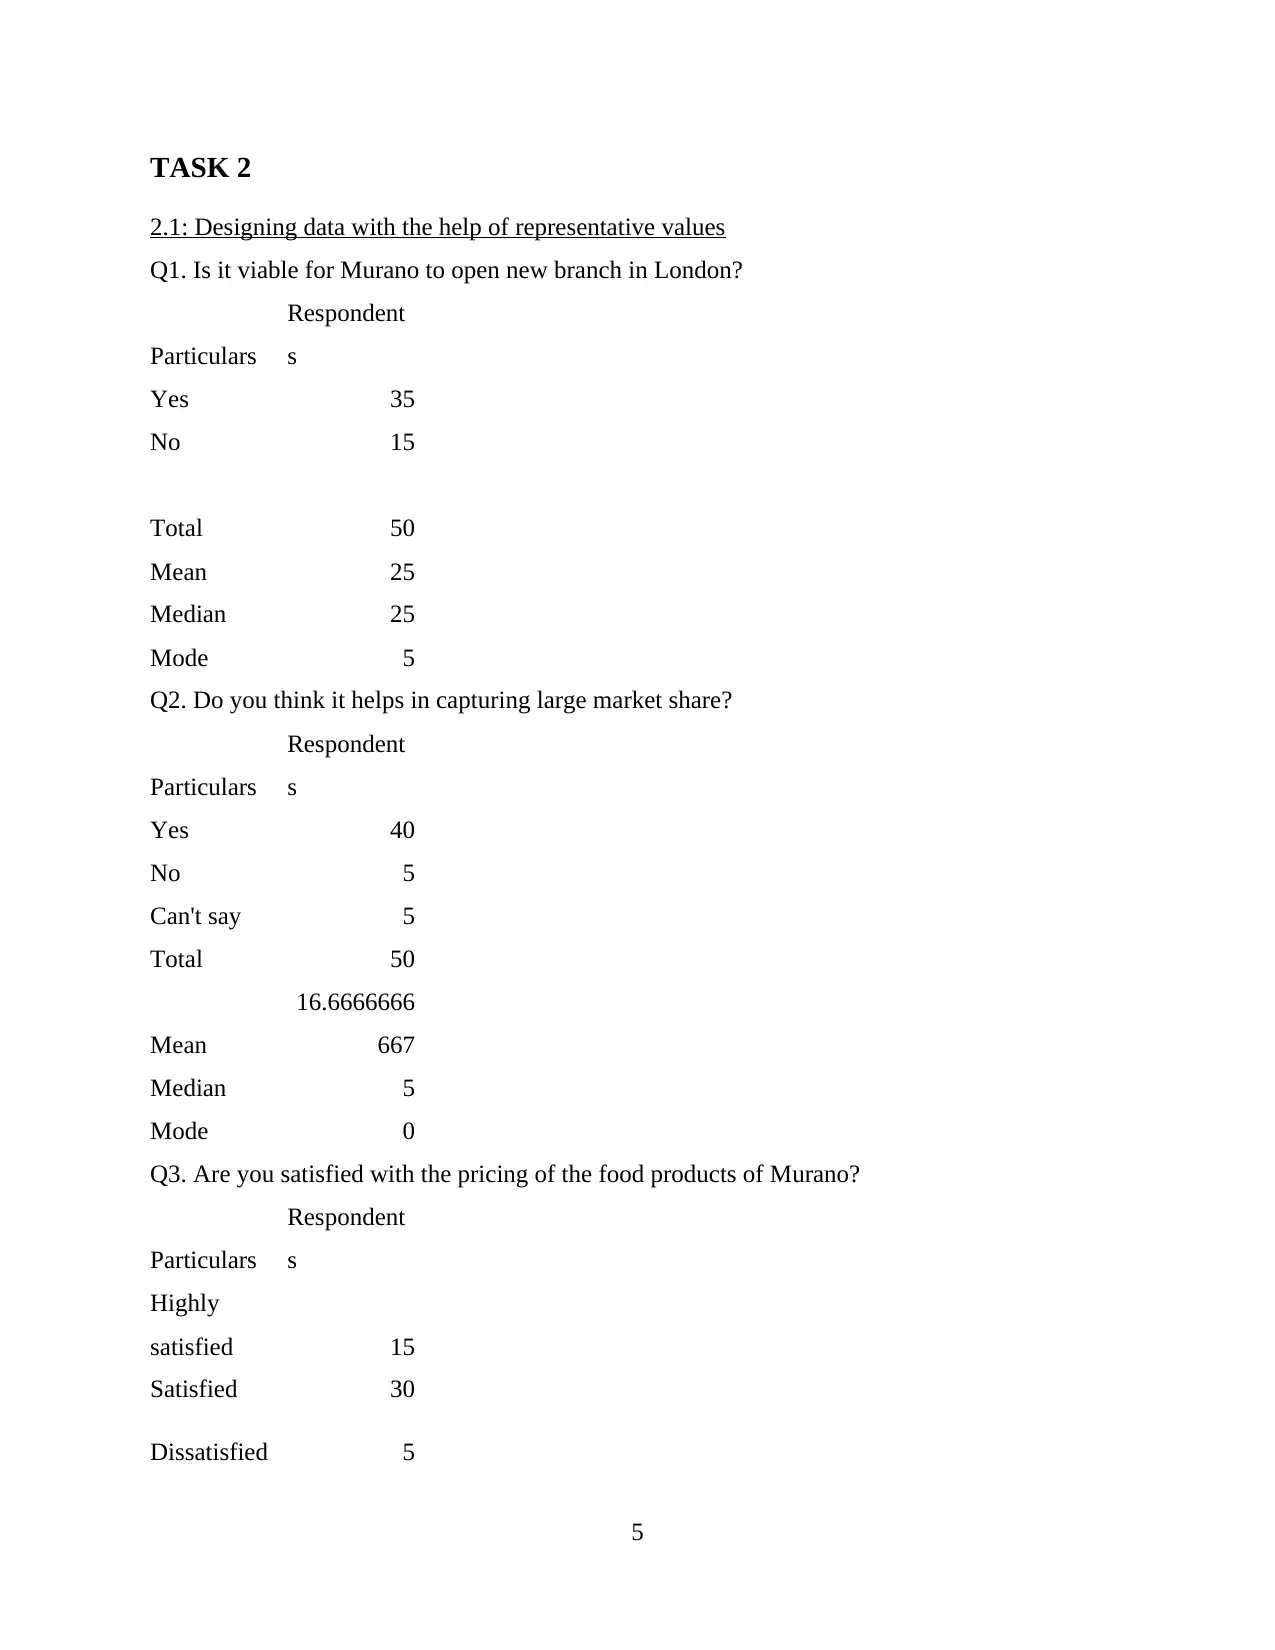
TASK 2
2.1: Designing data with the help of representative values
Q1. Is it viable for Murano to open new branch in London?
Particulars
Respondent
s
Yes 35
No 15
Total 50
Mean 25
Median 25
Mode 5
Q2. Do you think it helps in capturing large market share?
Particulars
Respondent
s
Yes 40
No 5
Can't say 5
Total 50
Mean
16.6666666
667
Median 5
Mode 0
Q3. Are you satisfied with the pricing of the food products of Murano?
Particulars
Respondent
s
Highly
satisfied 15
Satisfied 30
Dissatisfied 5
5
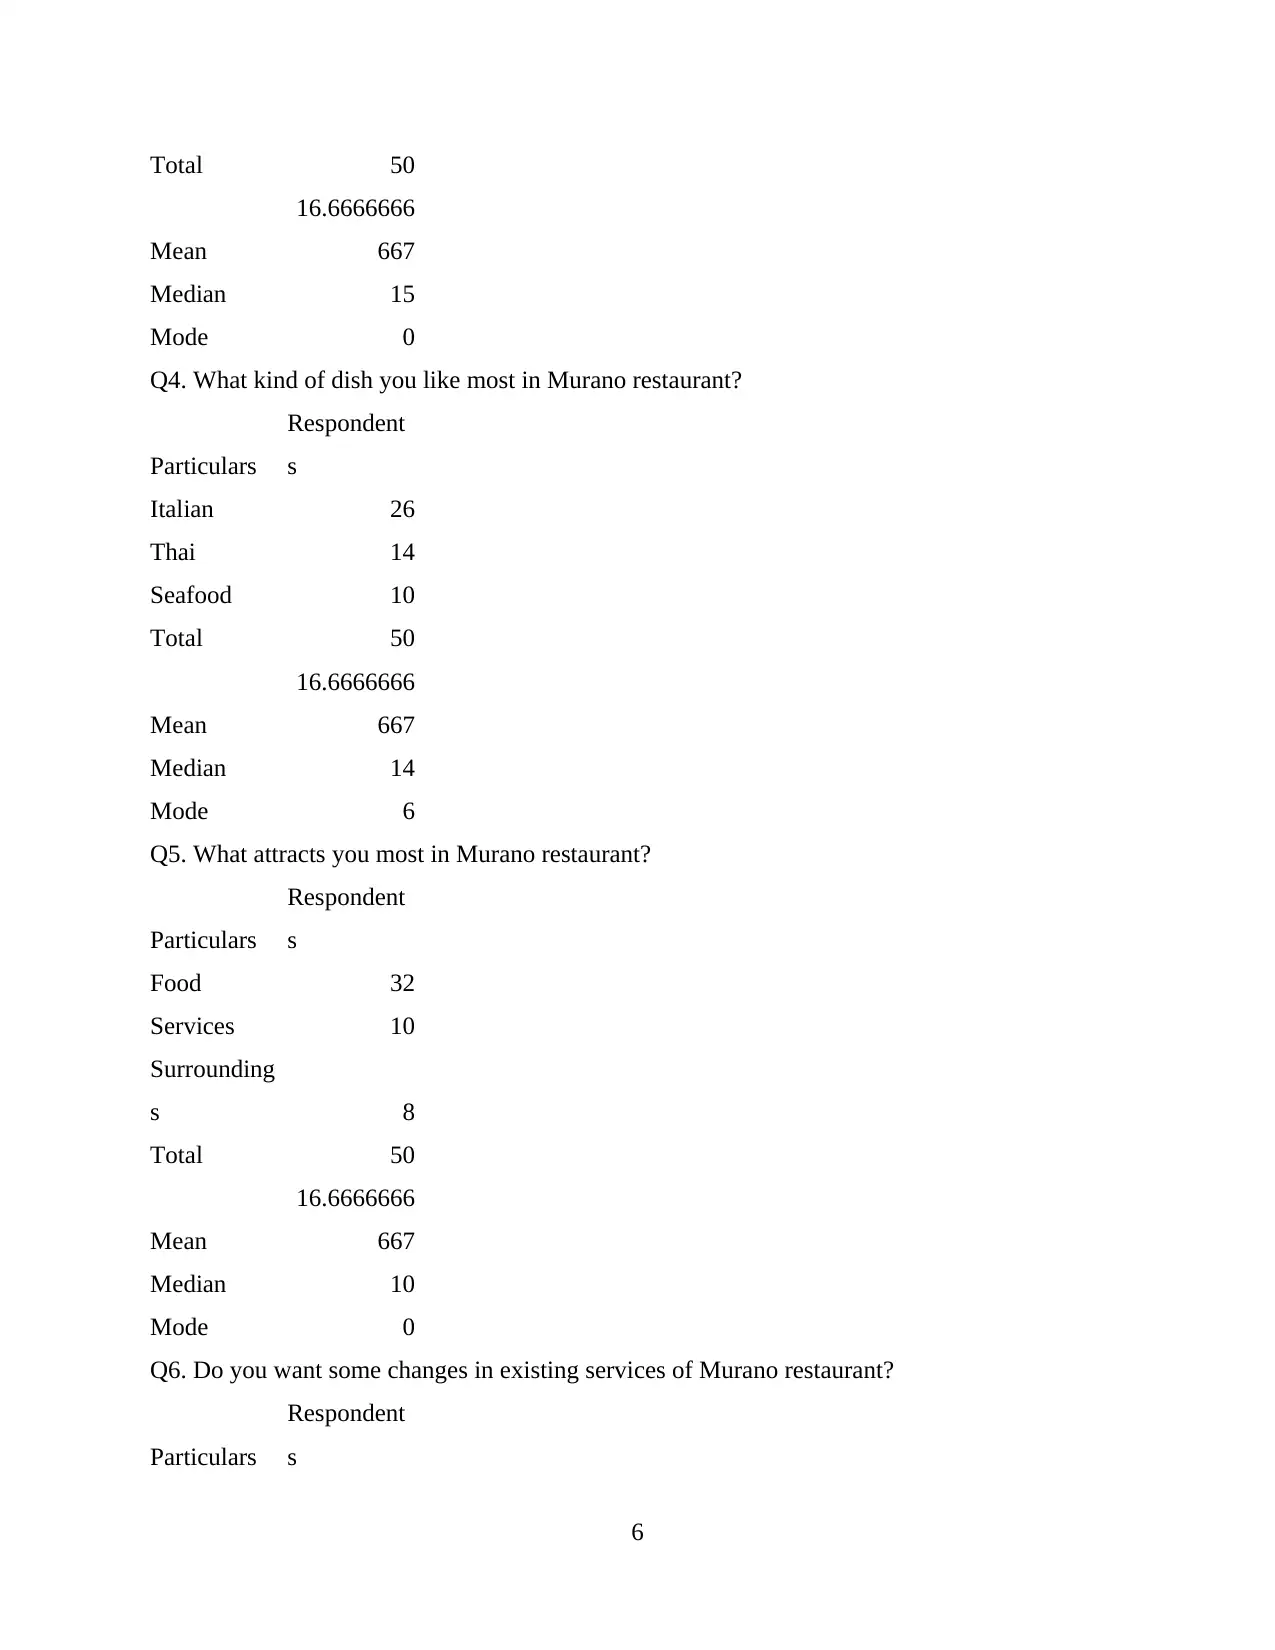
Total 50
Mean
16.6666666
667
Median 15
Mode 0
Q4. What kind of dish you like most in Murano restaurant?
Particulars
Respondent
s
Italian 26
Thai 14
Seafood 10
Total 50
Mean
16.6666666
667
Median 14
Mode 6
Q5. What attracts you most in Murano restaurant?
Particulars
Respondent
s
Food 32
Services 10
Surrounding
s 8
Total 50
Mean
16.6666666
667
Median 10
Mode 0
Q6. Do you want some changes in existing services of Murano restaurant?
Particulars
Respondent
s
6
Mean
16.6666666
667
Median 15
Mode 0
Q4. What kind of dish you like most in Murano restaurant?
Particulars
Respondent
s
Italian 26
Thai 14
Seafood 10
Total 50
Mean
16.6666666
667
Median 14
Mode 6
Q5. What attracts you most in Murano restaurant?
Particulars
Respondent
s
Food 32
Services 10
Surrounding
s 8
Total 50
Mean
16.6666666
667
Median 10
Mode 0
Q6. Do you want some changes in existing services of Murano restaurant?
Particulars
Respondent
s
6
⊘ This is a preview!⊘
Do you want full access?
Subscribe today to unlock all pages.
Trusted by 1+ million students worldwide
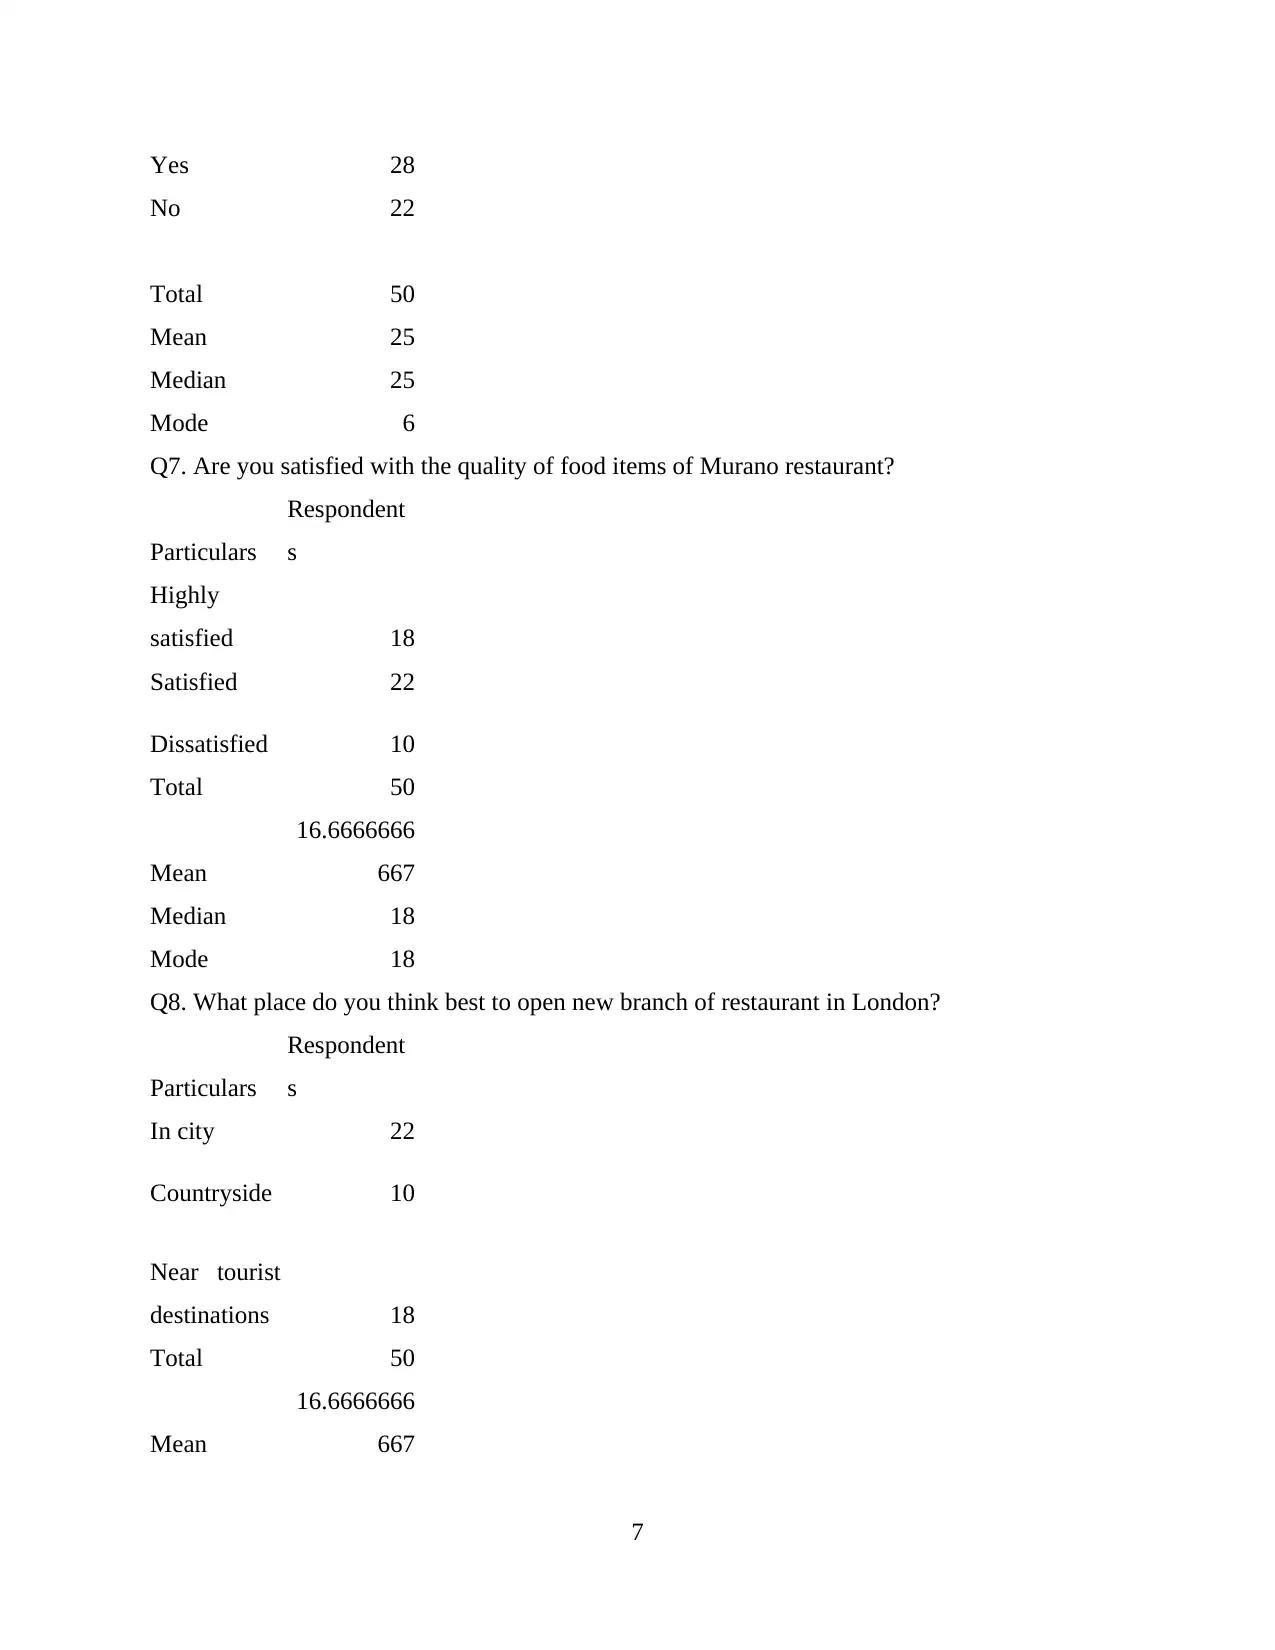
Yes 28
No 22
Total 50
Mean 25
Median 25
Mode 6
Q7. Are you satisfied with the quality of food items of Murano restaurant?
Particulars
Respondent
s
Highly
satisfied 18
Satisfied 22
Dissatisfied 10
Total 50
Mean
16.6666666
667
Median 18
Mode 18
Q8. What place do you think best to open new branch of restaurant in London?
Particulars
Respondent
s
In city 22
Countryside 10
Near tourist
destinations 18
Total 50
Mean
16.6666666
667
7
Paraphrase This Document
Need a fresh take? Get an instant paraphrase of this document with our AI Paraphraser
Median 18
Mode 2
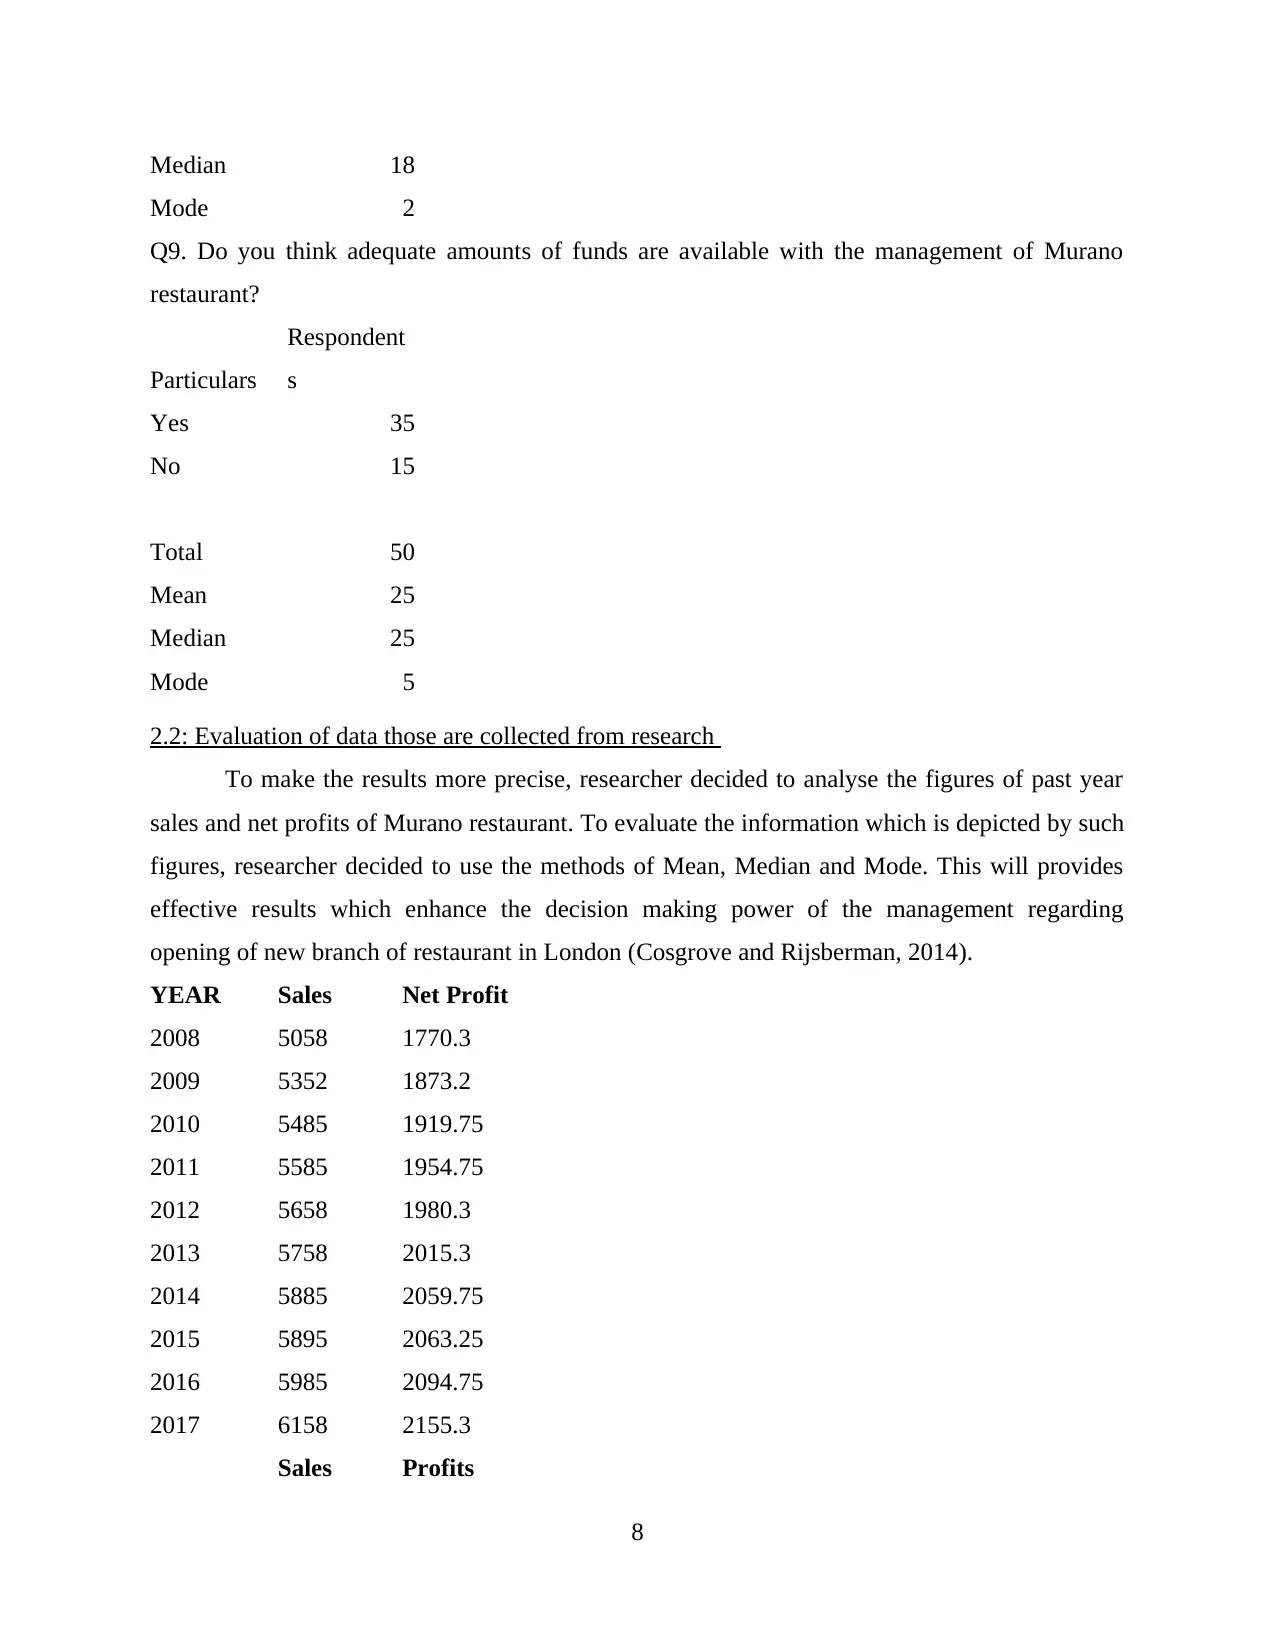
Q9. Do you think adequate amounts of funds are available with the management of Murano
restaurant?
Particulars
Respondent
s
Yes 35
No 15
Total 50
Mean 25
Median 25
Mode 5
2.2: Evaluation of data those are collected from research
To make the results more precise, researcher decided to analyse the figures of past year
sales and net profits of Murano restaurant. To evaluate the information which is depicted by such
figures, researcher decided to use the methods of Mean, Median and Mode. This will provides
effective results which enhance the decision making power of the management regarding
opening of new branch of restaurant in London (Cosgrove and Rijsberman, 2014).
YEAR Sales Net Profit
2008 5058 1770.3
2009 5352 1873.2
2010 5485 1919.75
2011 5585 1954.75
2012 5658 1980.3
2013 5758 2015.3
2014 5885 2059.75
2015 5895 2063.25
2016 5985 2094.75
2017 6158 2155.3
Sales Profits
8
Mode 2
Q9. Do you think adequate amounts of funds are available with the management of Murano
restaurant?
Particulars
Respondent
s
Yes 35
No 15
Total 50
Mean 25
Median 25
Mode 5
2.2: Evaluation of data those are collected from research
To make the results more precise, researcher decided to analyse the figures of past year
sales and net profits of Murano restaurant. To evaluate the information which is depicted by such
figures, researcher decided to use the methods of Mean, Median and Mode. This will provides
effective results which enhance the decision making power of the management regarding
opening of new branch of restaurant in London (Cosgrove and Rijsberman, 2014).
YEAR Sales Net Profit
2008 5058 1770.3
2009 5352 1873.2
2010 5485 1919.75
2011 5585 1954.75
2012 5658 1980.3
2013 5758 2015.3
2014 5885 2059.75
2015 5895 2063.25
2016 5985 2094.75
2017 6158 2155.3
Sales Profits
8
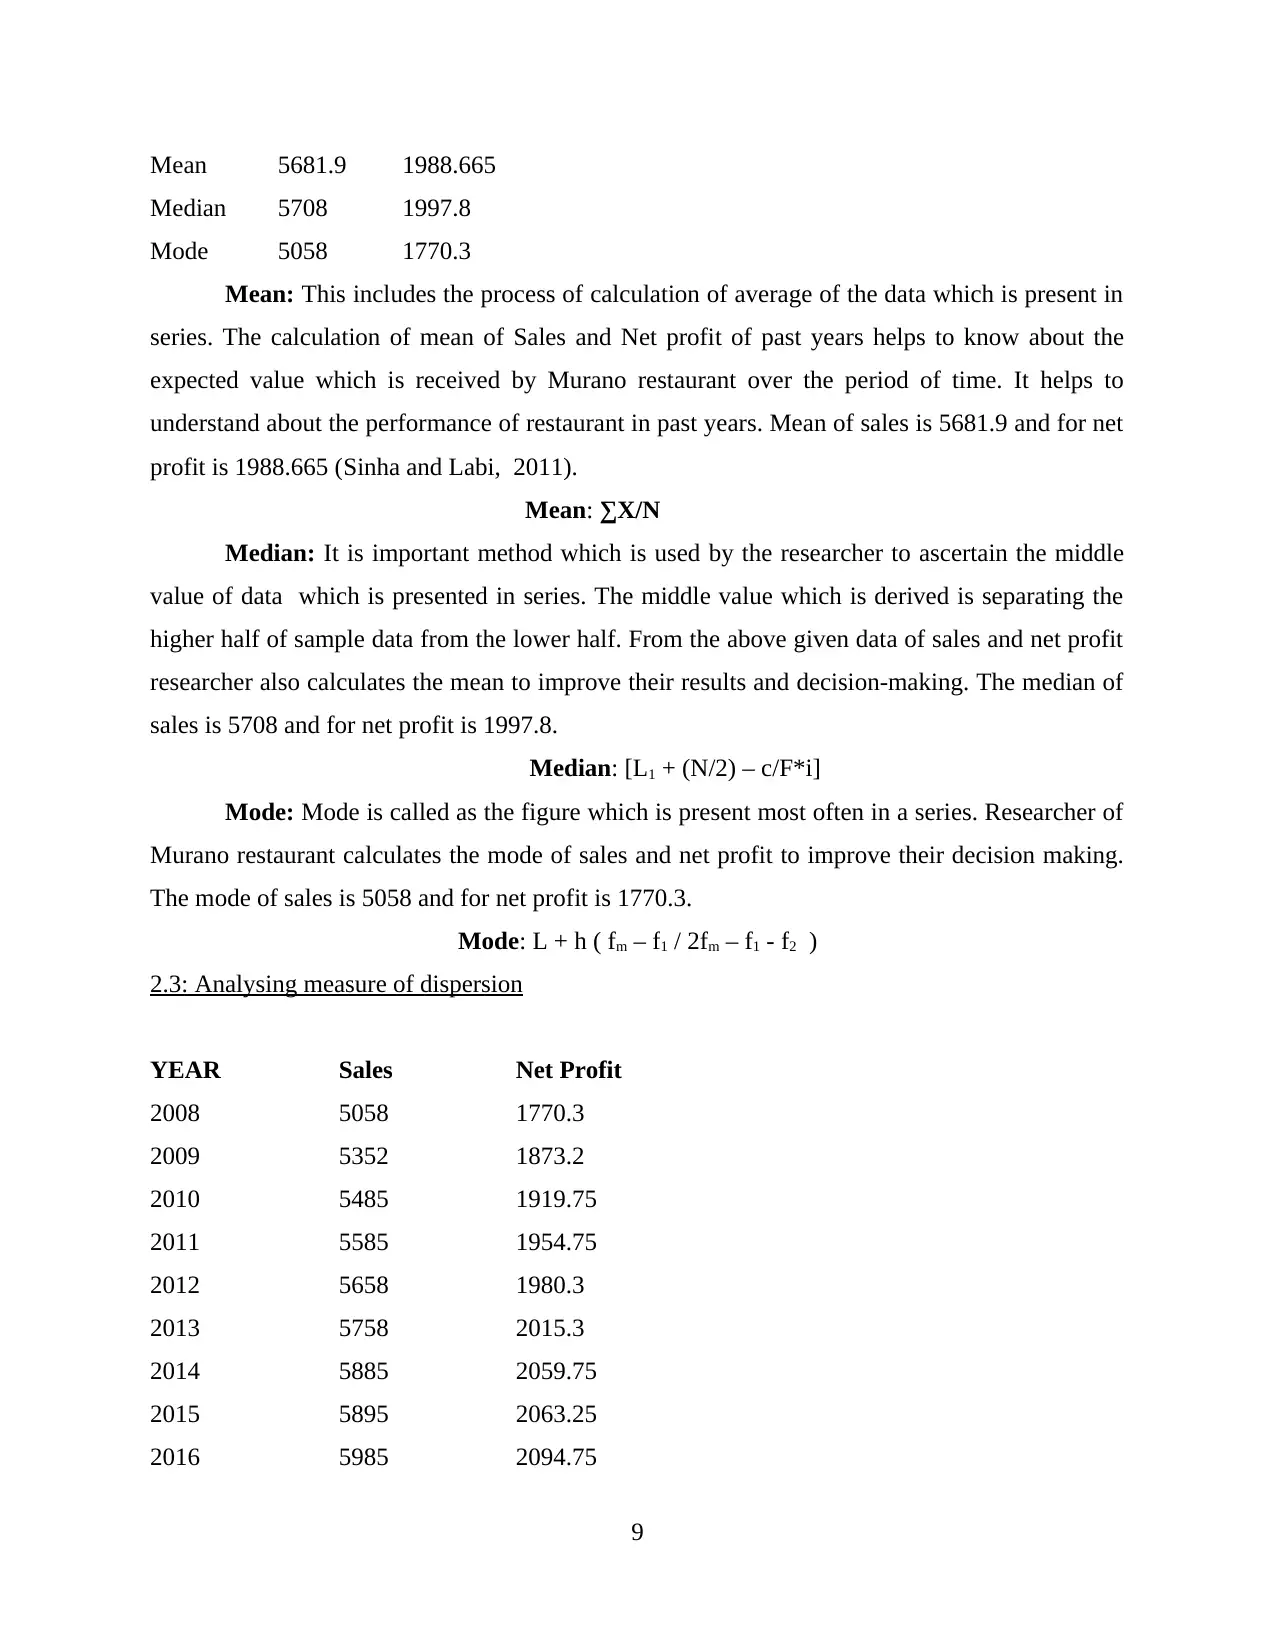
Mean 5681.9 1988.665
Median 5708 1997.8
Mode 5058 1770.3
Mean: This includes the process of calculation of average of the data which is present in
series. The calculation of mean of Sales and Net profit of past years helps to know about the
expected value which is received by Murano restaurant over the period of time. It helps to
understand about the performance of restaurant in past years. Mean of sales is 5681.9 and for net
profit is 1988.665 (Sinha and Labi, 2011).
Mean: ∑X/N
Median: It is important method which is used by the researcher to ascertain the middle
value of data which is presented in series. The middle value which is derived is separating the
higher half of sample data from the lower half. From the above given data of sales and net profit
researcher also calculates the mean to improve their results and decision-making. The median of
sales is 5708 and for net profit is 1997.8.
Median: [L1 + (N/2) – c/F*i]
Mode: Mode is called as the figure which is present most often in a series. Researcher of
Murano restaurant calculates the mode of sales and net profit to improve their decision making.
The mode of sales is 5058 and for net profit is 1770.3.
Mode: L + h ( fm – f1 / 2fm – f1 - f2 )
2.3: Analysing measure of dispersion
YEAR Sales Net Profit
2008 5058 1770.3
2009 5352 1873.2
2010 5485 1919.75
2011 5585 1954.75
2012 5658 1980.3
2013 5758 2015.3
2014 5885 2059.75
2015 5895 2063.25
2016 5985 2094.75
9
⊘ This is a preview!⊘
Do you want full access?
Subscribe today to unlock all pages.
Trusted by 1+ million students worldwide
1 out of 22
Related Documents


Your All-in-One AI-Powered Toolkit for Academic Success.
+13062052269
info@desklib.com
Available 24*7 on WhatsApp / Email
![[object Object]](/_next/static/media/star-bottom.7253800d.svg)
Unlock your academic potential
Copyright © 2020–2026 A2Z Services. All Rights Reserved. Developed and managed by ZUCOL.