Business Decision Making Report for Food for Friends Restaurant
VerifiedAdded on 2020/09/08
|22
|3483
|33
Report
AI Summary
This report focuses on business decision-making processes for a restaurant, Food for Friends, situated in London. It explores both primary and secondary data collection methods, including questionnaires and analysis of customer feedback. The report delves into statistical analysis, representative values, dispersion measurement, and correlation to draw valid conclusions. Furthermore, it includes the presentation of graphs, trend line forecasting, and the use of financial tools to support effective business decisions. The study also covers the importance of innovation, including new food items and physical changes within the restaurant, to attract more customers and improve profitability. The report concludes with recommendations for the restaurant's management to enhance its business strategies and customer satisfaction.

BUSINESS DECISION MAKING
Paraphrase This Document
Need a fresh take? Get an instant paraphrase of this document with our AI Paraphraser
Table of contents
Introduction......................................................................................................................................3
AC1.1: Plan to collect primary and secondary data........................................................................3
AC1.2: Methodology and sampling frame.....................................................................................3
AC1.3: questionnaire to identify business issue..............................................................................4
AC2.1: decision making by the summarizing representative value................................................5
AC2.2: analyzing of representative value along with valid conclusion..........................................6
AC2.3: Analysis of collected data by measuring dispersion...........................................................7
AC2.4: Value of quartile, percentile and correlation in drawing useful conclusion.......................7
AC3.1: graphs drawing valid conclusions.......................................................................................8
AC3.2: trend line forecasting future of business...........................................................................13
AC3.3: business presentation for disseminating information........................................................17
AC3.4 formal business report........................................................................................................18
AC4.1: Use correct information processing tool...........................................................................18
AC4.2: Establishing of project plan and determination of its critical path...................................18
AC4.3: utility of financial tools to make business decision..........................................................20
Conclusion.....................................................................................................................................21
References......................................................................................................................................22
2
Introduction
This is essential to establish effective business plan for conducting efficient and effective
business, taking financial stability as the major concern by the organization taking right and
effective business decision is very crucial work to consider. For this study Food for Friends has
been chosen which is a restaurant situated in London. Thus, this study focuses on business
decision-making processes for the business organization. This study further provides possible
questionnaire based on research topic where the people’s responses are analyzed utilizing the
statistics. In addition to this, there are presentation of graphs and perfect financial tool use for
making effective business decision.
AC1.1: Plan to collect primary and secondary data
There are two methods to collect data for the research topic. These methods comprises of
primary as well as secondary data collection method. The primary data are the collective of
people’s responses. This kind of data is gathered from people who had prior experience in using
particular product (Zsambok, 2014). This is generally based on questionnaire, surveys and
interviews. The secondary data are the collection of information received from journals, books
and websites. These data are utilized for analyzing the previous works of different scholars to
realize the concept of the chosen topic. In this study, the primary source of data collection has
been opted since raw data are necessary for making business decision decisions related to the
preferences of price, product quality and location of the restaurant by the customers.
AC1.2: Methodology and sampling frame
For conducting survey on public responses, the researcher may use the questionnaire and
interview methods. The method of interview allows getting people’s feedbacks from talking face
to face. This process is done for managers and is basing over the qualitative method for data
collection. The questionnaire survey process is open ended which allow getting pinpoint
responses of the people. The collected data in this method are used to make statistical analysis.
The sampling method generally contains probability and non-probability method (García-
Peñalvo, and Conde, 2014). Where the probability method enables the scope of every people that
can be selected within the sample size. Non-probability method does select some people from
target sample range for conducting the survey. For the purpose of this study the open ended
3
⊘ This is a preview!⊘
Do you want full access?
Subscribe today to unlock all pages.
Trusted by 1+ million students worldwide
survey questionnaire has been provided towards the people for analyzing their feedbacks. The
audience has been chosen by using non-probability techniques of sampling since the size of
sample is larger. The sample size in this study has been taken as 75 customers those visit
frequently to Food for Friends.
AC1.3: questionnaire to identify business issue
Questionnaire providing understanding of the feedbacks from the customers of Food for Friends
Q1. Do you often visit Food for Friends?
i. Yes
ii. No
Q2. What do you believe on the prices of their foods?
i. Extremely expensive
ii. Reasonable
iii. Pocket-permitted
Q3. How much pleased you are with the food quality?
i. Strongly satisfied
ii. Satisfied
iii. Neutral
iv. Dissatisfied
v. Strongly dissatisfied
Q4. Does the price go with the food quality?
i. Yes
ii. No
Q5. Are you contented with the present location of Food for Friends?
i. Yes
ii. No
Q6. What new food items you would akin to to bring in into the restaurant?
i. Mushroom with choco pie
ii. Ham and Sausage rolls with salads
iii. Crispy fried mushroom tikka
iv. Tofu Steak
4
Paraphrase This Document
Need a fresh take? Get an instant paraphrase of this document with our AI Paraphraser
Q7. What changes you would like make in the restaurant?
i. Get better lightning
ii. Persuade the music play
iii. Introduce with the facility for soft drinks
iv. Make innovations to sitting arrangements
Q8. On a range of 1 to 5, how you rate Food for Friends with different vegetarian restaurants?
i. One
ii. Two
iii. Three
iv. Four
v. Five
Q9. Would you suggest this restaurant to your friends or families?
i. Yes
ii. No
Q10. How extent you agree that Food for Friends serves their customers by providing
customized food?
i. Strongly agree
ii. Agree
iii. Neutral
iv. Disagree
v. Strongly disagree
AC2.1: decision making by the summarizing representative value
For understanding the processes of restaurant, the researcher required reading different books
and journals. This did help researcher to know with the policies that every restaurant have in
establishing brand reputation. Researcher did access restaurant websites for gaining an insight of
the food types that restaurants serves and the feedbacks, which was provided by the customers.
The secondary data analysis has helped researcher in framing research questions as well as
analyzing the feedbacks of customers in respect of Food for friends. The primary research did
help to analyze customer responses. Based over the primary research questionnaire this can be
5
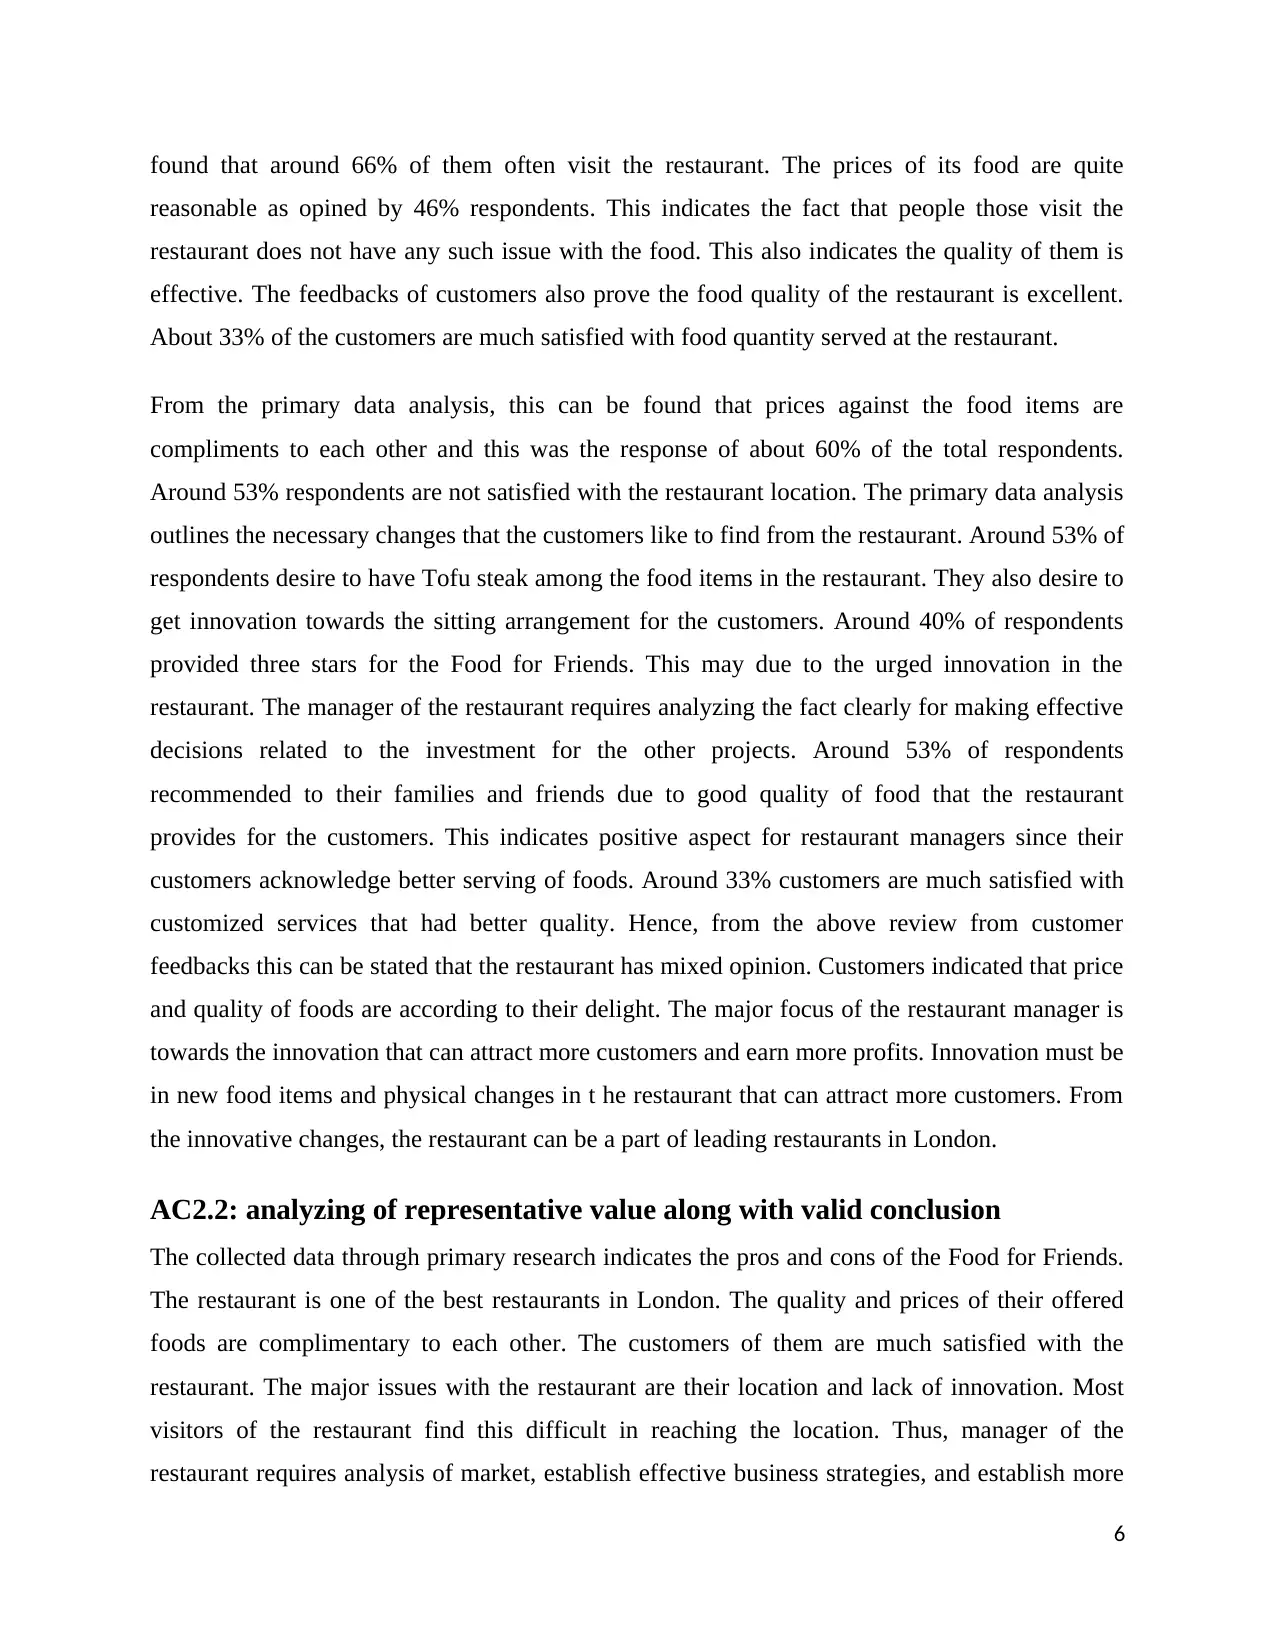
found that around 66% of them often visit the restaurant. The prices of its food are quite
reasonable as opined by 46% respondents. This indicates the fact that people those visit the
restaurant does not have any such issue with the food. This also indicates the quality of them is
effective. The feedbacks of customers also prove the food quality of the restaurant is excellent.
About 33% of the customers are much satisfied with food quantity served at the restaurant.
From the primary data analysis, this can be found that prices against the food items are
compliments to each other and this was the response of about 60% of the total respondents.
Around 53% respondents are not satisfied with the restaurant location. The primary data analysis
outlines the necessary changes that the customers like to find from the restaurant. Around 53% of
respondents desire to have Tofu steak among the food items in the restaurant. They also desire to
get innovation towards the sitting arrangement for the customers. Around 40% of respondents
provided three stars for the Food for Friends. This may due to the urged innovation in the
restaurant. The manager of the restaurant requires analyzing the fact clearly for making effective
decisions related to the investment for the other projects. Around 53% of respondents
recommended to their families and friends due to good quality of food that the restaurant
provides for the customers. This indicates positive aspect for restaurant managers since their
customers acknowledge better serving of foods. Around 33% customers are much satisfied with
customized services that had better quality. Hence, from the above review from customer
feedbacks this can be stated that the restaurant has mixed opinion. Customers indicated that price
and quality of foods are according to their delight. The major focus of the restaurant manager is
towards the innovation that can attract more customers and earn more profits. Innovation must be
in new food items and physical changes in t he restaurant that can attract more customers. From
the innovative changes, the restaurant can be a part of leading restaurants in London.
AC2.2: analyzing of representative value along with valid conclusion
The collected data through primary research indicates the pros and cons of the Food for Friends.
The restaurant is one of the best restaurants in London. The quality and prices of their offered
foods are complimentary to each other. The customers of them are much satisfied with the
restaurant. The major issues with the restaurant are their location and lack of innovation. Most
visitors of the restaurant find this difficult in reaching the location. Thus, manager of the
restaurant requires analysis of market, establish effective business strategies, and establish more
6
⊘ This is a preview!⊘
Do you want full access?
Subscribe today to unlock all pages.
Trusted by 1+ million students worldwide
restaurant outlets, which can be convenient for the customers. Restaurant also provides
customized services to their customers. This factor is essential in order to provide the correct
food products to the customers (Pettigrew, 2014). This also provides the restaurant with
competitive advantages.
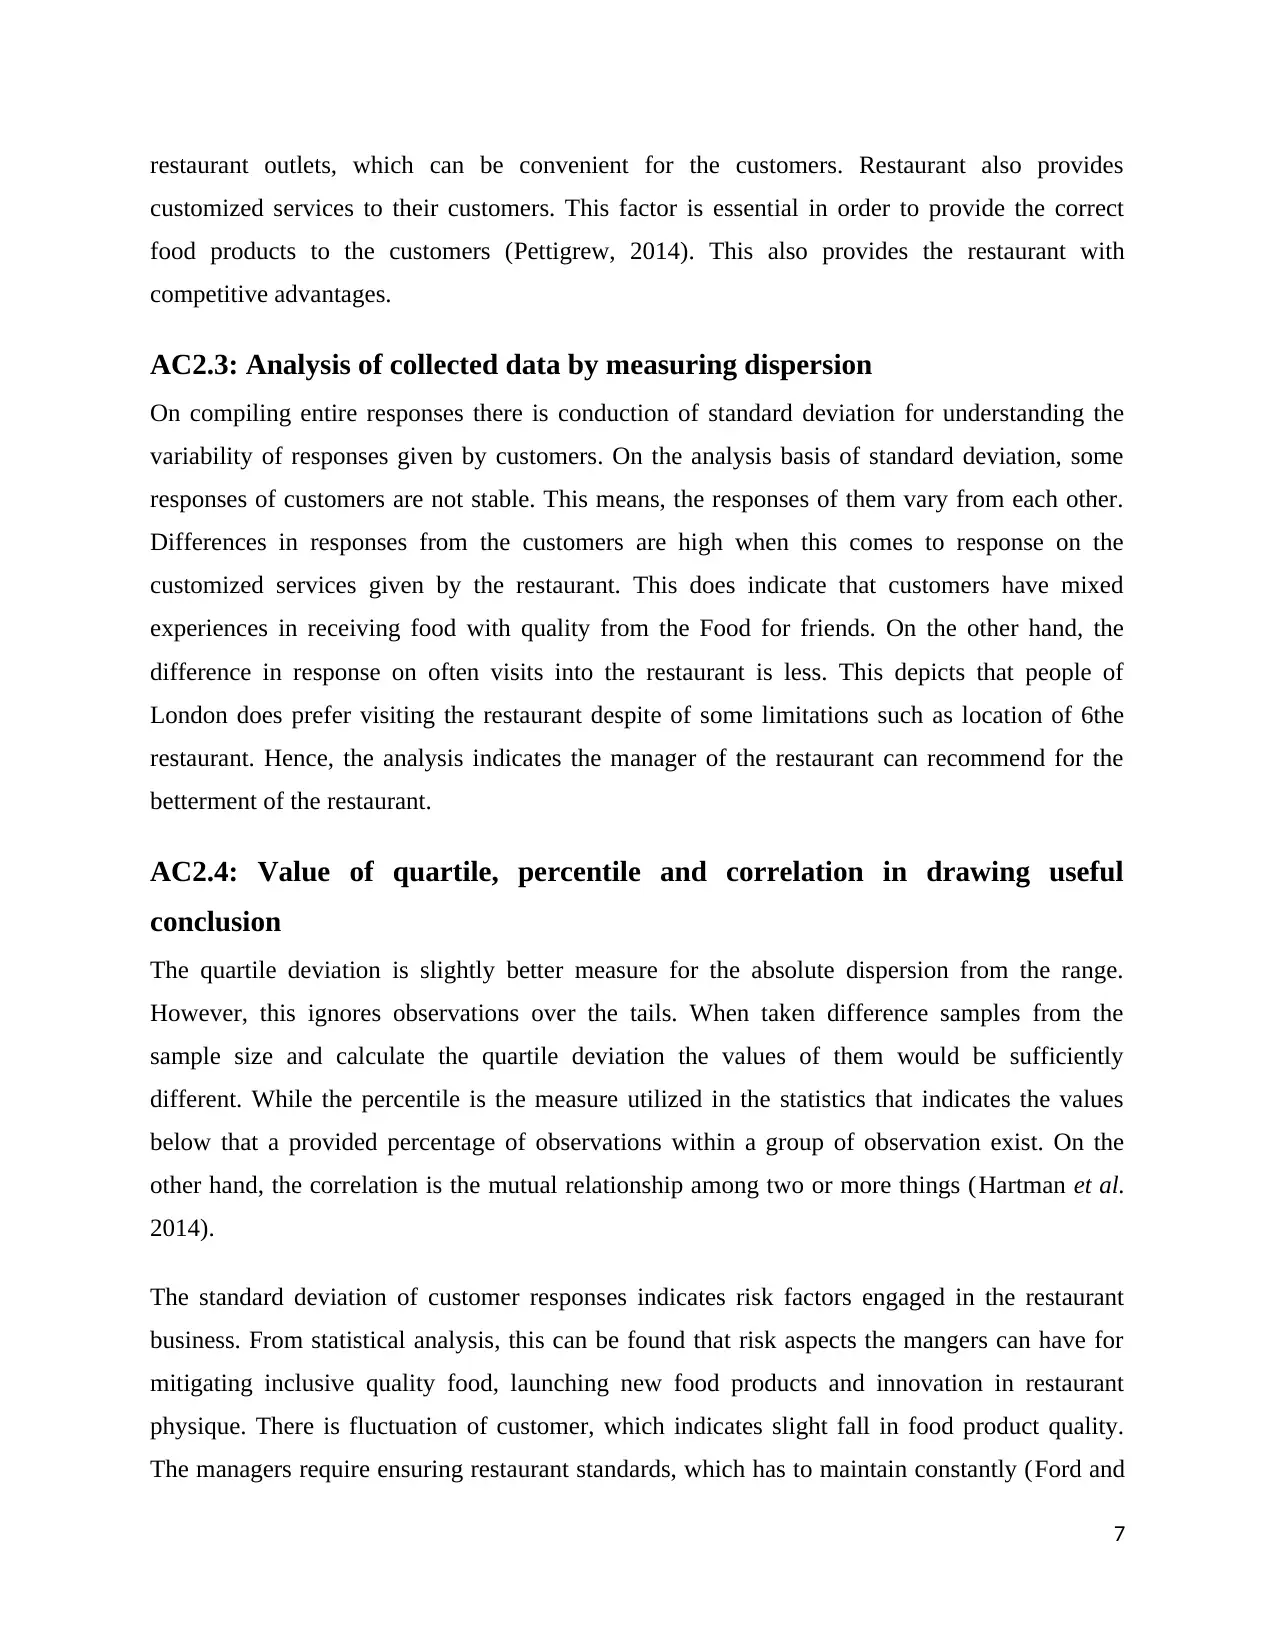
AC2.3: Analysis of collected data by measuring dispersion
On compiling entire responses there is conduction of standard deviation for understanding the
variability of responses given by customers. On the analysis basis of standard deviation, some
responses of customers are not stable. This means, the responses of them vary from each other.
Differences in responses from the customers are high when this comes to response on the
customized services given by the restaurant. This does indicate that customers have mixed
experiences in receiving food with quality from the Food for friends. On the other hand, the
difference in response on often visits into the restaurant is less. This depicts that people of
London does prefer visiting the restaurant despite of some limitations such as location of 6the
restaurant. Hence, the analysis indicates the manager of the restaurant can recommend for the
betterment of the restaurant.
AC2.4: Value of quartile, percentile and correlation in drawing useful
conclusion
The quartile deviation is slightly better measure for the absolute dispersion from the range.
However, this ignores observations over the tails. When taken difference samples from the
sample size and calculate the quartile deviation the values of them would be sufficiently
different. While the percentile is the measure utilized in the statistics that indicates the values
below that a provided percentage of observations within a group of observation exist. On the
other hand, the correlation is the mutual relationship among two or more things (Hartman et al.
2014).
The standard deviation of customer responses indicates risk factors engaged in the restaurant
business. From statistical analysis, this can be found that risk aspects the mangers can have for
mitigating inclusive quality food, launching new food products and innovation in restaurant
physique. There is fluctuation of customer, which indicates slight fall in food product quality.
The managers require ensuring restaurant standards, which has to maintain constantly (Ford and
7
customized services to their customers. This factor is essential in order to provide the correct
food products to the customers (Pettigrew, 2014). This also provides the restaurant with
competitive advantages.
AC2.3: Analysis of collected data by measuring dispersion
On compiling entire responses there is conduction of standard deviation for understanding the
variability of responses given by customers. On the analysis basis of standard deviation, some
responses of customers are not stable. This means, the responses of them vary from each other.
Differences in responses from the customers are high when this comes to response on the
customized services given by the restaurant. This does indicate that customers have mixed
experiences in receiving food with quality from the Food for friends. On the other hand, the
difference in response on often visits into the restaurant is less. This depicts that people of
London does prefer visiting the restaurant despite of some limitations such as location of 6the
restaurant. Hence, the analysis indicates the manager of the restaurant can recommend for the
betterment of the restaurant.
AC2.4: Value of quartile, percentile and correlation in drawing useful
conclusion
The quartile deviation is slightly better measure for the absolute dispersion from the range.
However, this ignores observations over the tails. When taken difference samples from the
sample size and calculate the quartile deviation the values of them would be sufficiently
different. While the percentile is the measure utilized in the statistics that indicates the values
below that a provided percentage of observations within a group of observation exist. On the
other hand, the correlation is the mutual relationship among two or more things (Hartman et al.
2014).
The standard deviation of customer responses indicates risk factors engaged in the restaurant
business. From statistical analysis, this can be found that risk aspects the mangers can have for
mitigating inclusive quality food, launching new food products and innovation in restaurant
physique. There is fluctuation of customer, which indicates slight fall in food product quality.
The managers require ensuring restaurant standards, which has to maintain constantly (Ford and
7
Paraphrase This Document
Need a fresh take? Get an instant paraphrase of this document with our AI Paraphraser
Richardson, 2013). The fluctuation suggests the requirements in improvement and necessity of
innovation so as to reduce huge deviation.
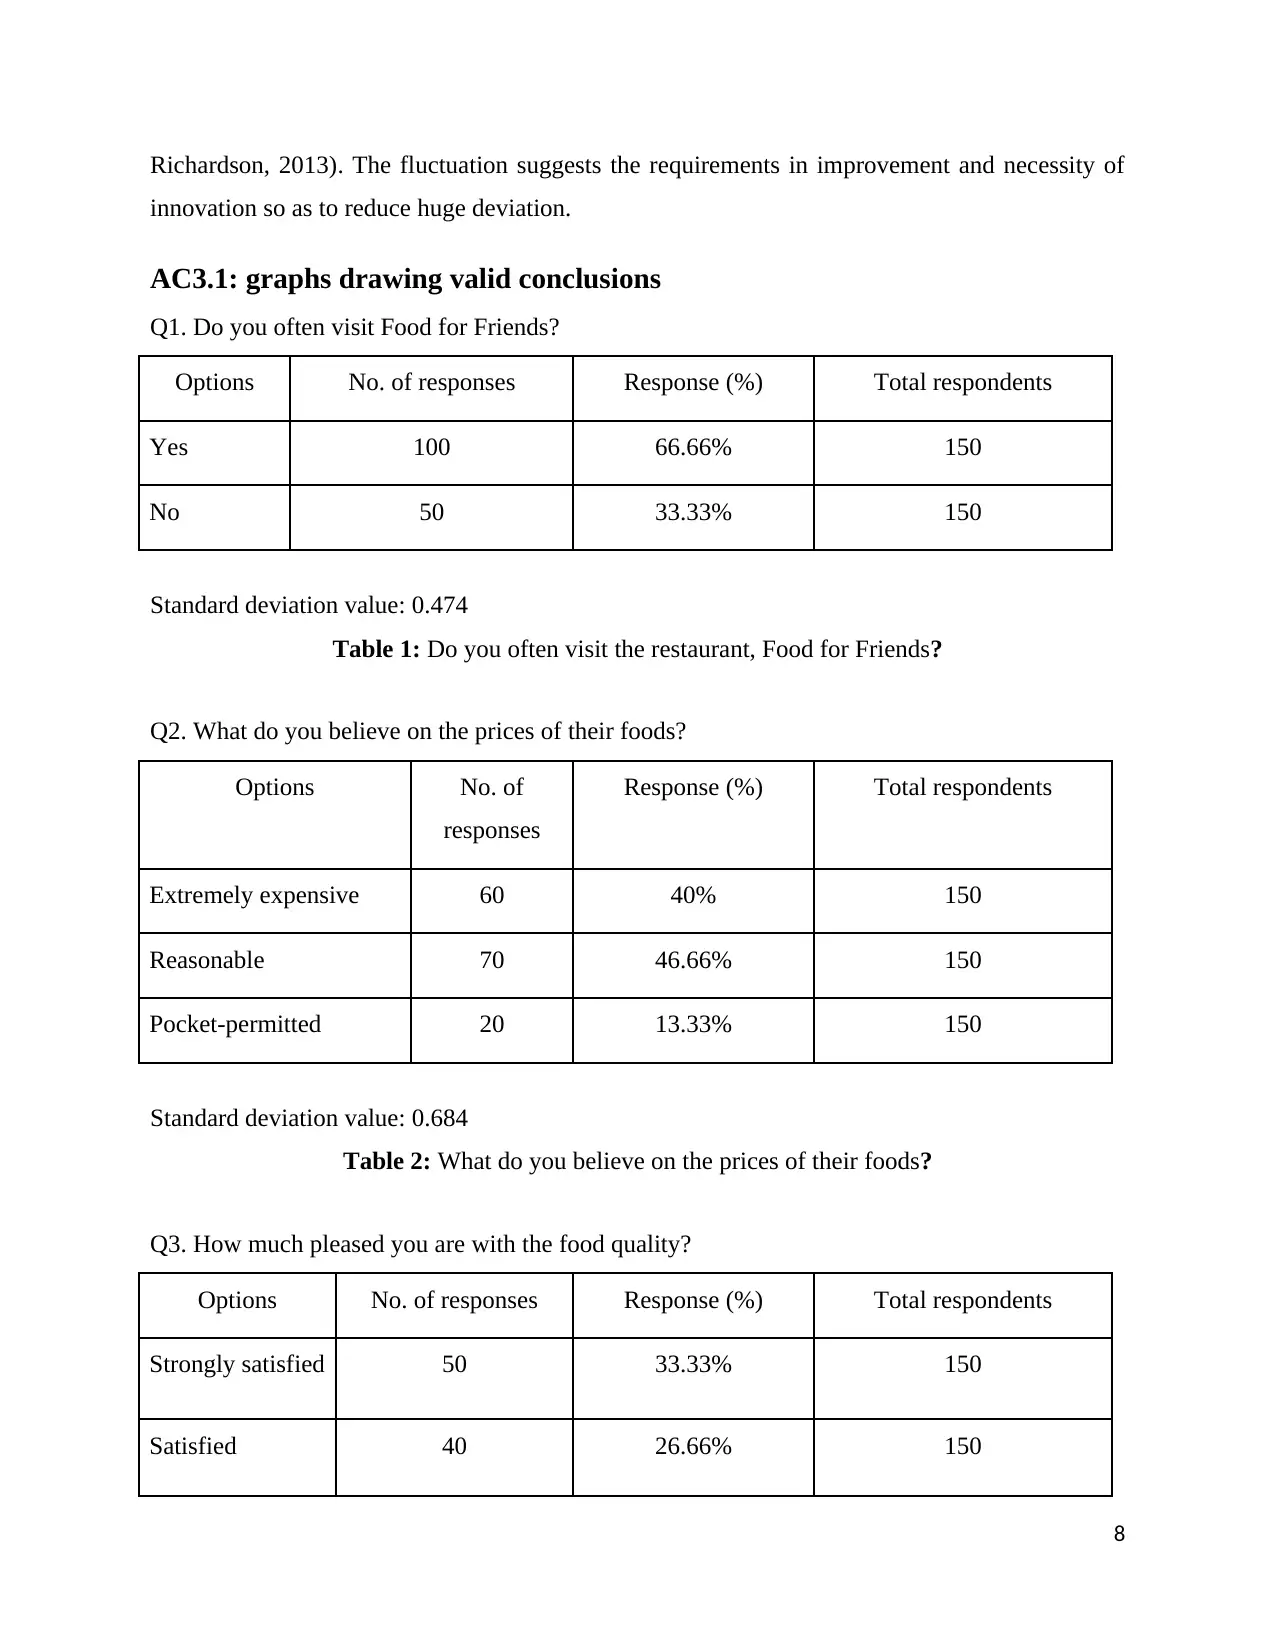
AC3.1: graphs drawing valid conclusions
Q1. Do you often visit Food for Friends?
Options No. of responses Response (%) Total respondents
Yes 100 66.66% 150
No 50 33.33% 150
Standard deviation value: 0.474
Table 1: Do you often visit the restaurant, Food for Friends?
Q2. What do you believe on the prices of their foods?
Options No. of
responses
Response (%) Total respondents
Extremely expensive 60 40% 150
Reasonable 70 46.66% 150
Pocket-permitted 20 13.33% 150
Standard deviation value: 0.684
Table 2: What do you believe on the prices of their foods?
Q3. How much pleased you are with the food quality?
Options No. of responses Response (%) Total respondents
Strongly satisfied 50 33.33% 150
Satisfied 40 26.66% 150
8
innovation so as to reduce huge deviation.
AC3.1: graphs drawing valid conclusions
Q1. Do you often visit Food for Friends?
Options No. of responses Response (%) Total respondents
Yes 100 66.66% 150
No 50 33.33% 150
Standard deviation value: 0.474
Table 1: Do you often visit the restaurant, Food for Friends?
Q2. What do you believe on the prices of their foods?
Options No. of
responses
Response (%) Total respondents
Extremely expensive 60 40% 150
Reasonable 70 46.66% 150
Pocket-permitted 20 13.33% 150
Standard deviation value: 0.684
Table 2: What do you believe on the prices of their foods?
Q3. How much pleased you are with the food quality?
Options No. of responses Response (%) Total respondents
Strongly satisfied 50 33.33% 150
Satisfied 40 26.66% 150
8
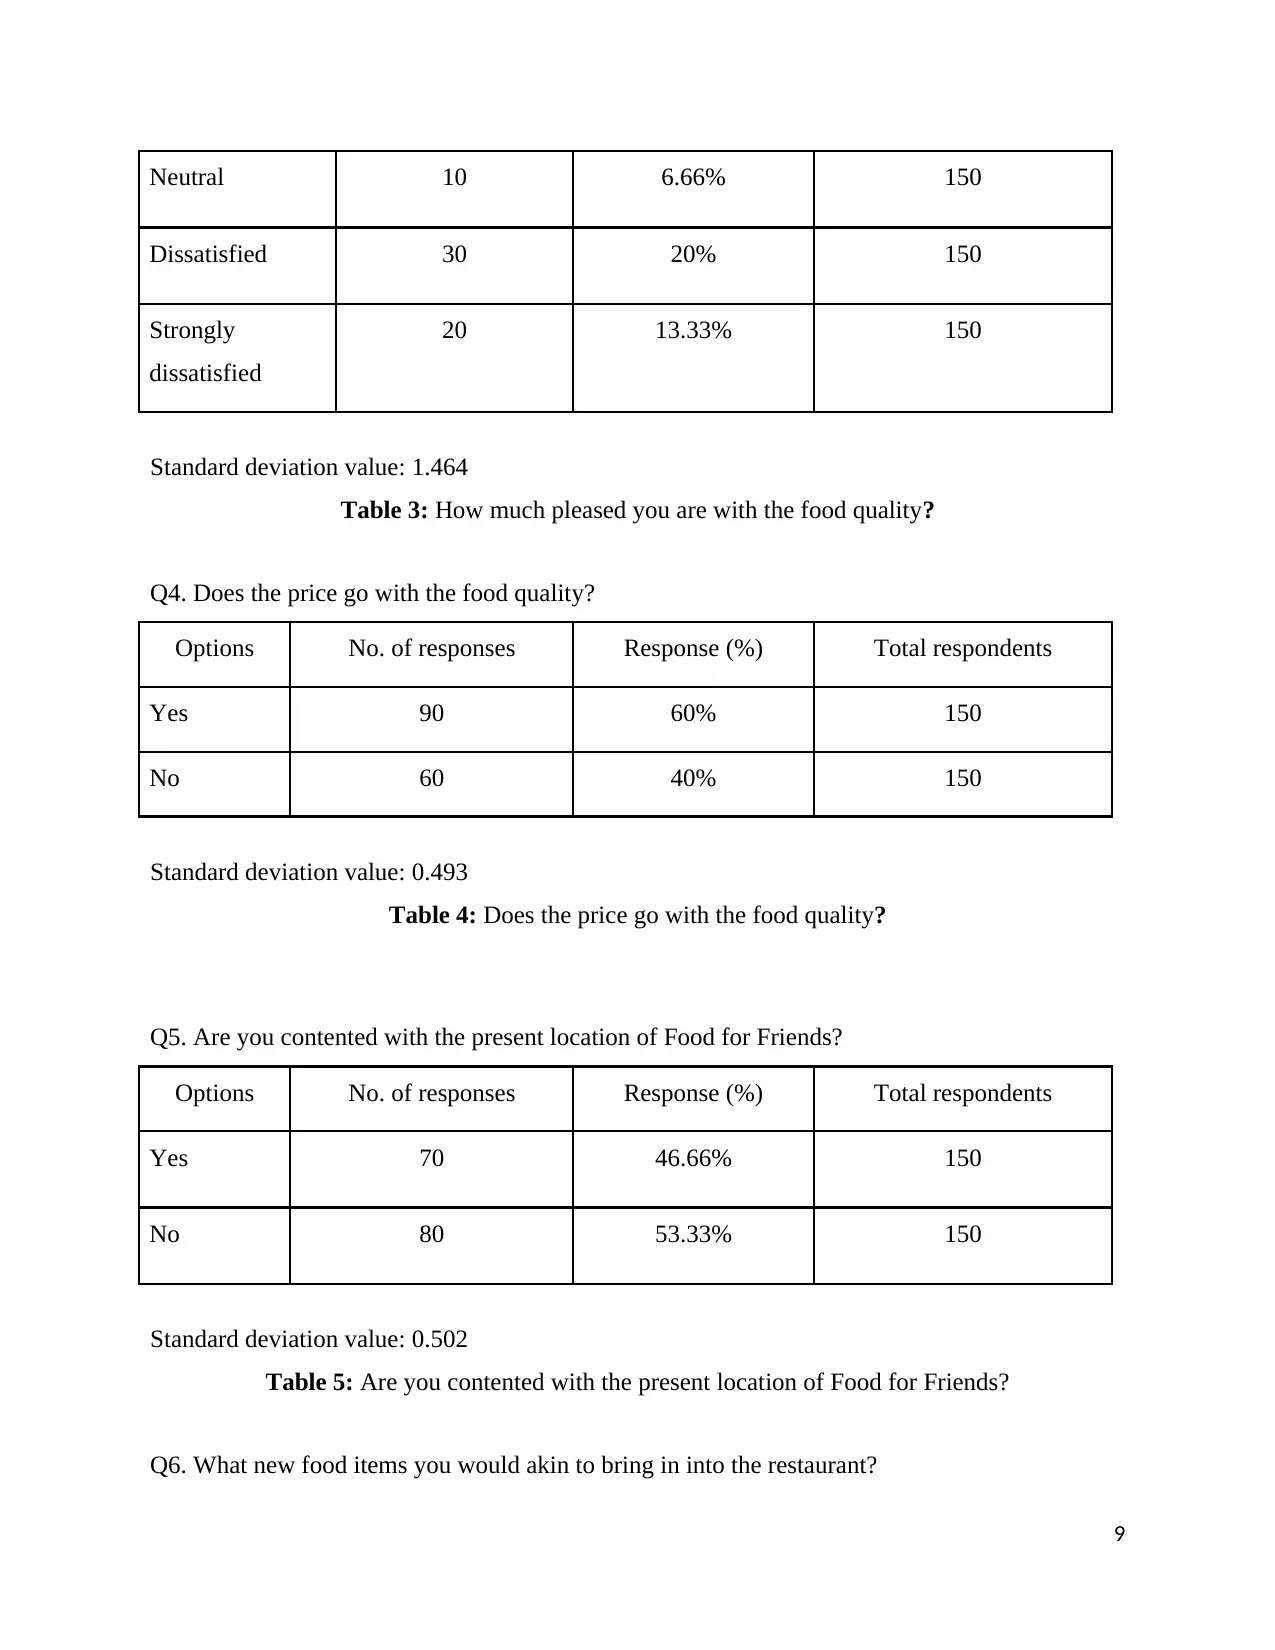
Neutral 10 6.66% 150
Dissatisfied 30 20% 150
Strongly
dissatisfied
20 13.33% 150
Standard deviation value: 1.464
Table 3: How much pleased you are with the food quality?
Q4. Does the price go with the food quality?
Options No. of responses Response (%) Total respondents
Yes 90 60% 150
No 60 40% 150
Standard deviation value: 0.493
Table 4: Does the price go with the food quality?
Q5. Are you contented with the present location of Food for Friends?
Options No. of responses Response (%) Total respondents
Yes 70 46.66% 150
No 80 53.33% 150
Standard deviation value: 0.502
Table 5: Are you contented with the present location of Food for Friends?
Q6. What new food items you would akin to bring in into the restaurant?
9
⊘ This is a preview!⊘
Do you want full access?
Subscribe today to unlock all pages.
Trusted by 1+ million students worldwide
Options No. of responses Response (%) Total respondents
Mushroom and
choco pie
40 26.66% 150
Sausage rolls
with salads
10 6.66% 150
Crispy fried
mushroom tikka
20 13.33% 150
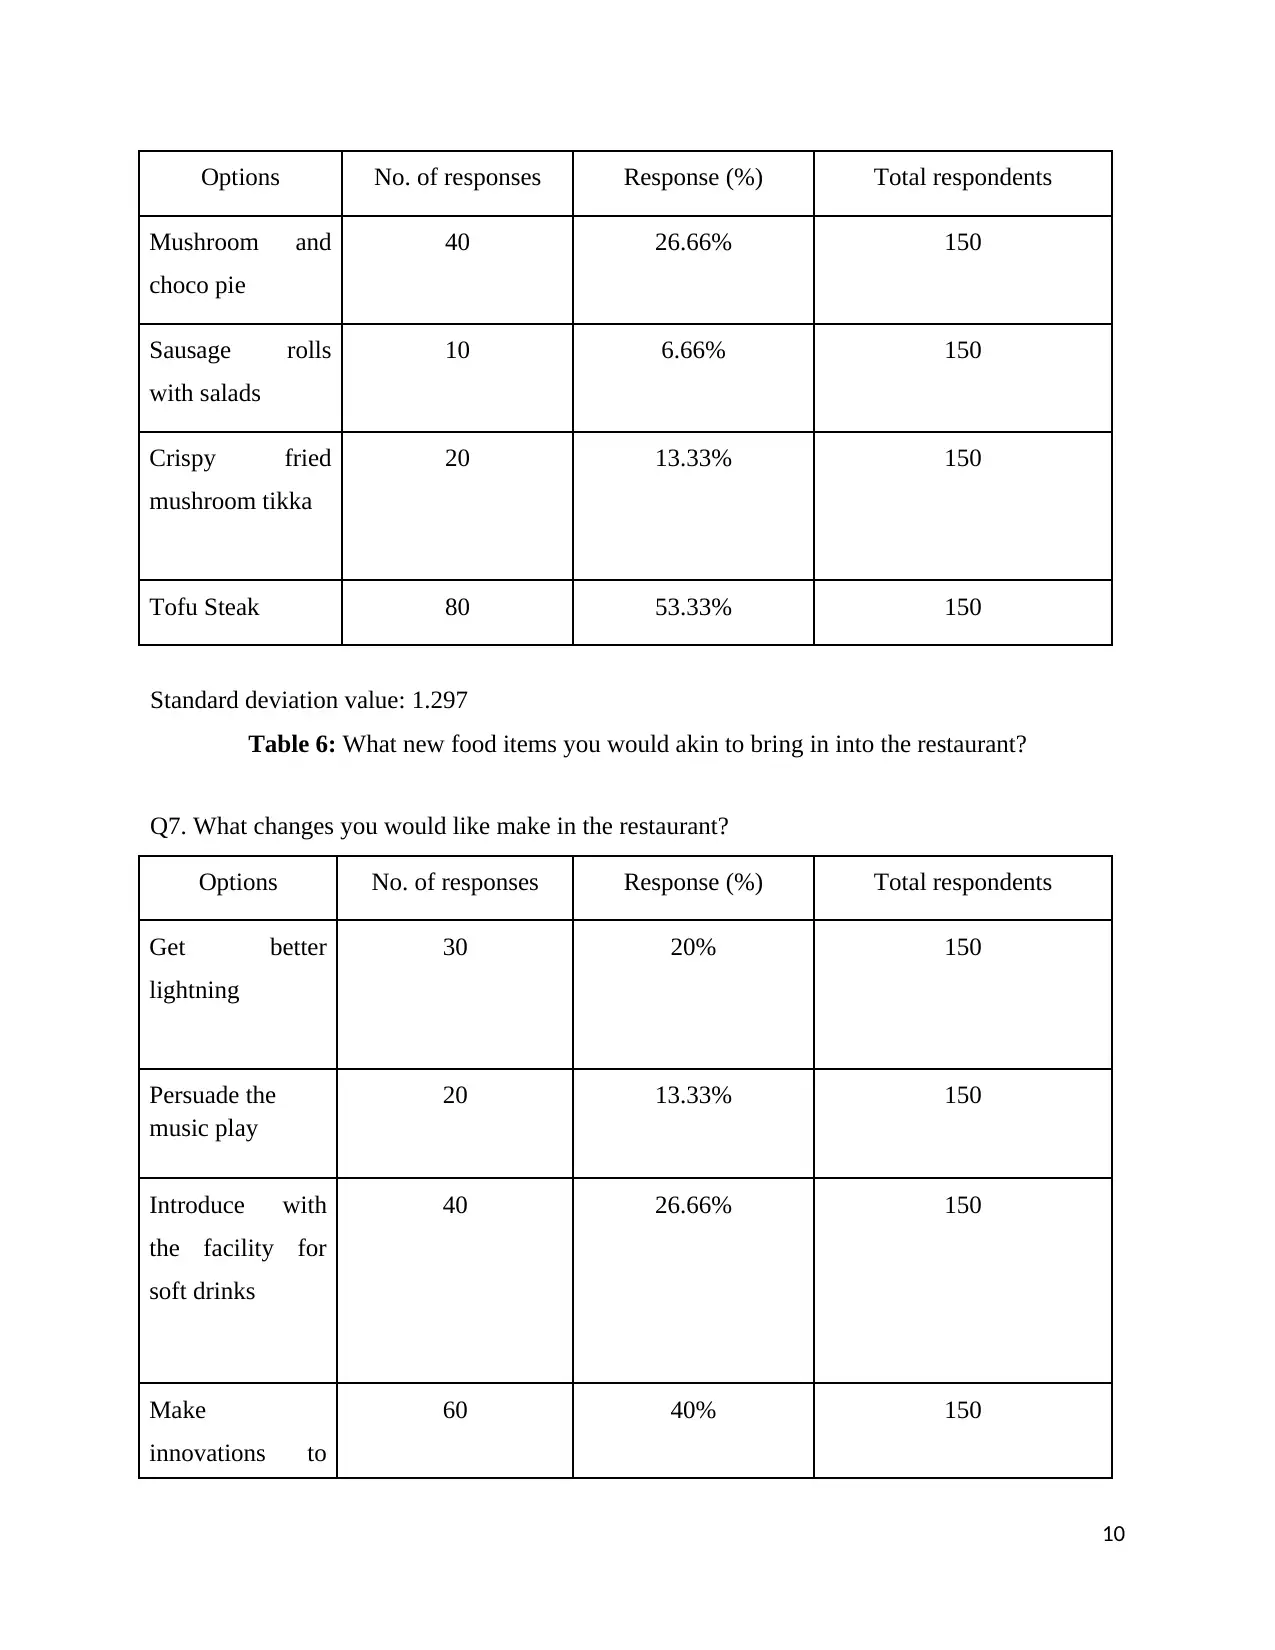
Tofu Steak 80 53.33% 150
Standard deviation value: 1.297
Table 6: What new food items you would akin to bring in into the restaurant?
Q7. What changes you would like make in the restaurant?
Options No. of responses Response (%) Total respondents
Get better
lightning
30 20% 150
Persuade the
music play
20 13.33% 150
Introduce with
the facility for
soft drinks
40 26.66% 150
Make
innovations to
60 40% 150
10
Mushroom and
choco pie
40 26.66% 150
Sausage rolls
with salads
10 6.66% 150
Crispy fried
mushroom tikka
20 13.33% 150
Tofu Steak 80 53.33% 150
Standard deviation value: 1.297
Table 6: What new food items you would akin to bring in into the restaurant?
Q7. What changes you would like make in the restaurant?
Options No. of responses Response (%) Total respondents
Get better
lightning
30 20% 150
Persuade the
music play
20 13.33% 150
Introduce with
the facility for
soft drinks
40 26.66% 150
Make
innovations to
60 40% 150
10
Paraphrase This Document
Need a fresh take? Get an instant paraphrase of this document with our AI Paraphraser
sitting
arrangements
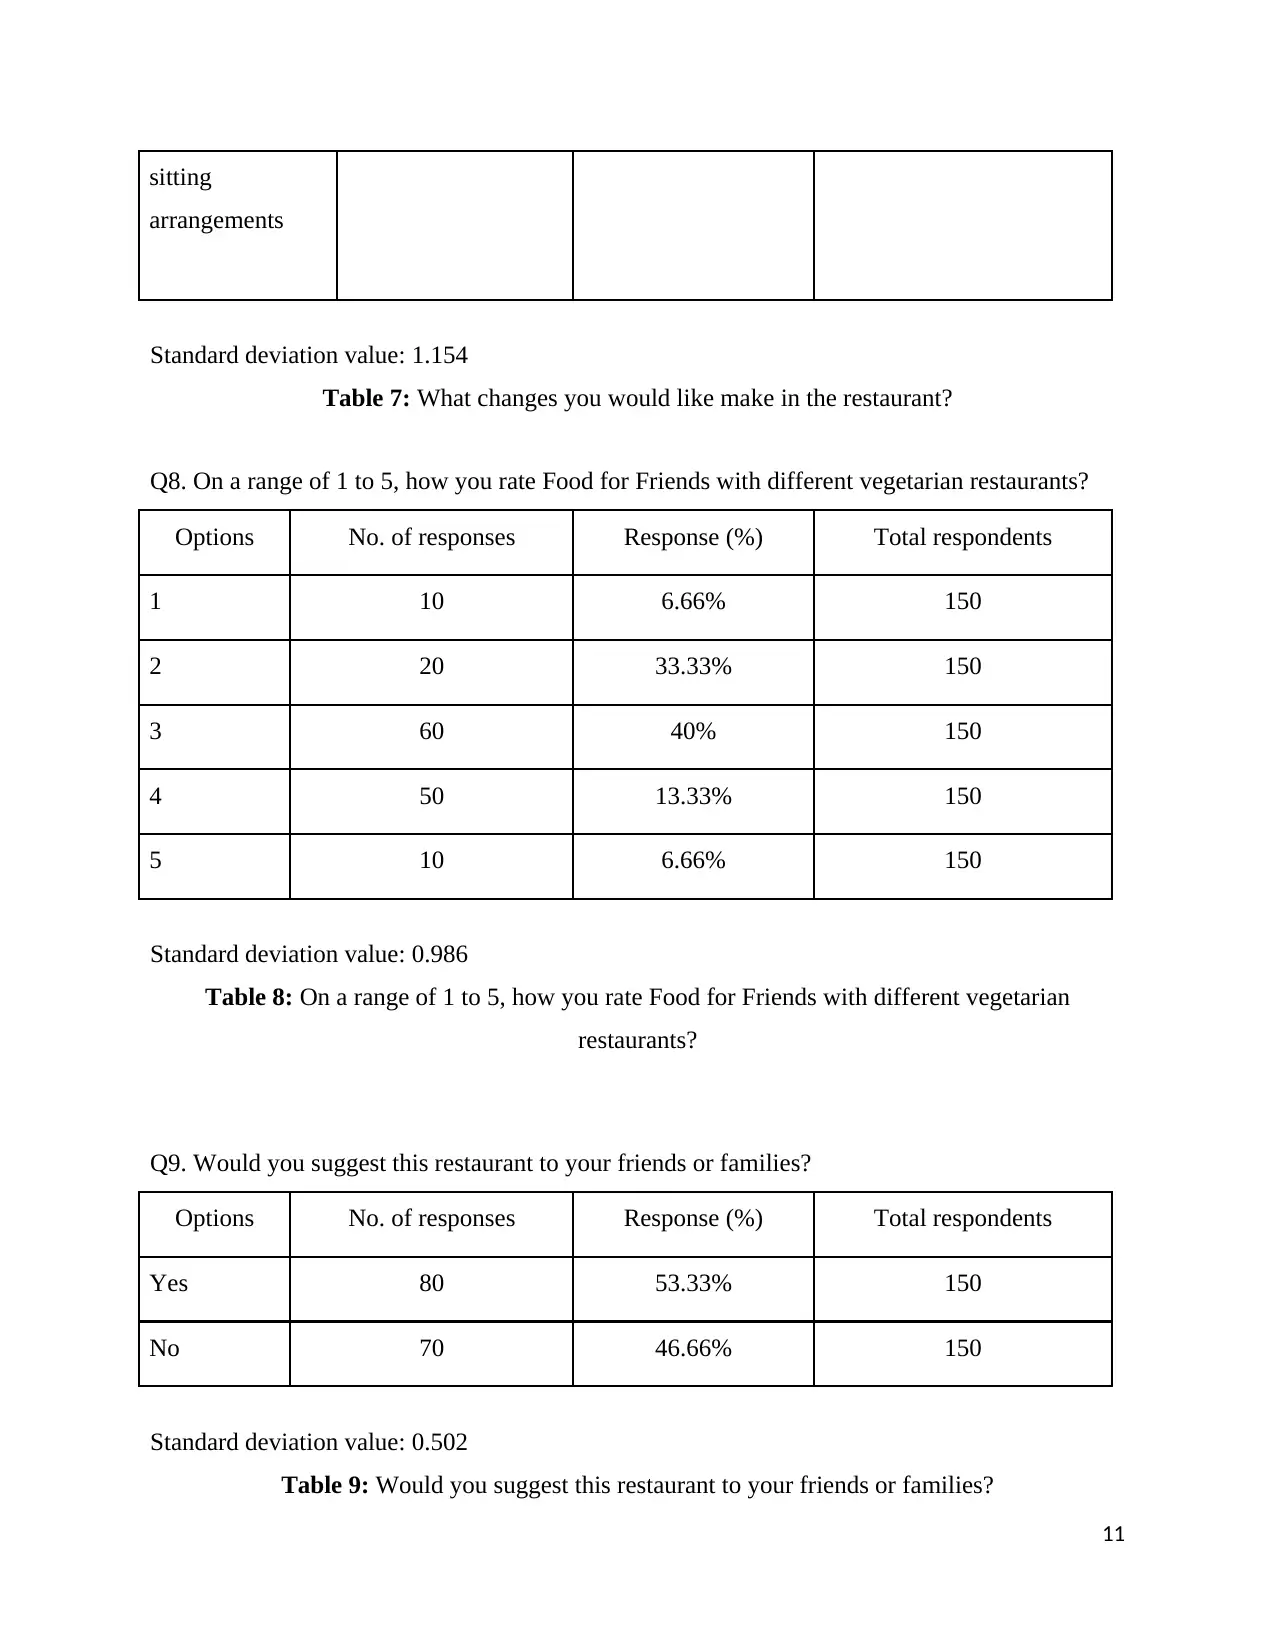
Standard deviation value: 1.154
Table 7: What changes you would like make in the restaurant?
Q8. On a range of 1 to 5, how you rate Food for Friends with different vegetarian restaurants?
Options No. of responses Response (%) Total respondents
1 10 6.66% 150
2 20 33.33% 150
3 60 40% 150
4 50 13.33% 150
5 10 6.66% 150
Standard deviation value: 0.986
Table 8: On a range of 1 to 5, how you rate Food for Friends with different vegetarian
restaurants?
Q9. Would you suggest this restaurant to your friends or families?
Options No. of responses Response (%) Total respondents
Yes 80 53.33% 150
No 70 46.66% 150
Standard deviation value: 0.502
Table 9: Would you suggest this restaurant to your friends or families?
11
arrangements
Standard deviation value: 1.154
Table 7: What changes you would like make in the restaurant?
Q8. On a range of 1 to 5, how you rate Food for Friends with different vegetarian restaurants?
Options No. of responses Response (%) Total respondents
1 10 6.66% 150
2 20 33.33% 150
3 60 40% 150
4 50 13.33% 150
5 10 6.66% 150
Standard deviation value: 0.986
Table 8: On a range of 1 to 5, how you rate Food for Friends with different vegetarian
restaurants?
Q9. Would you suggest this restaurant to your friends or families?
Options No. of responses Response (%) Total respondents
Yes 80 53.33% 150
No 70 46.66% 150
Standard deviation value: 0.502
Table 9: Would you suggest this restaurant to your friends or families?
11
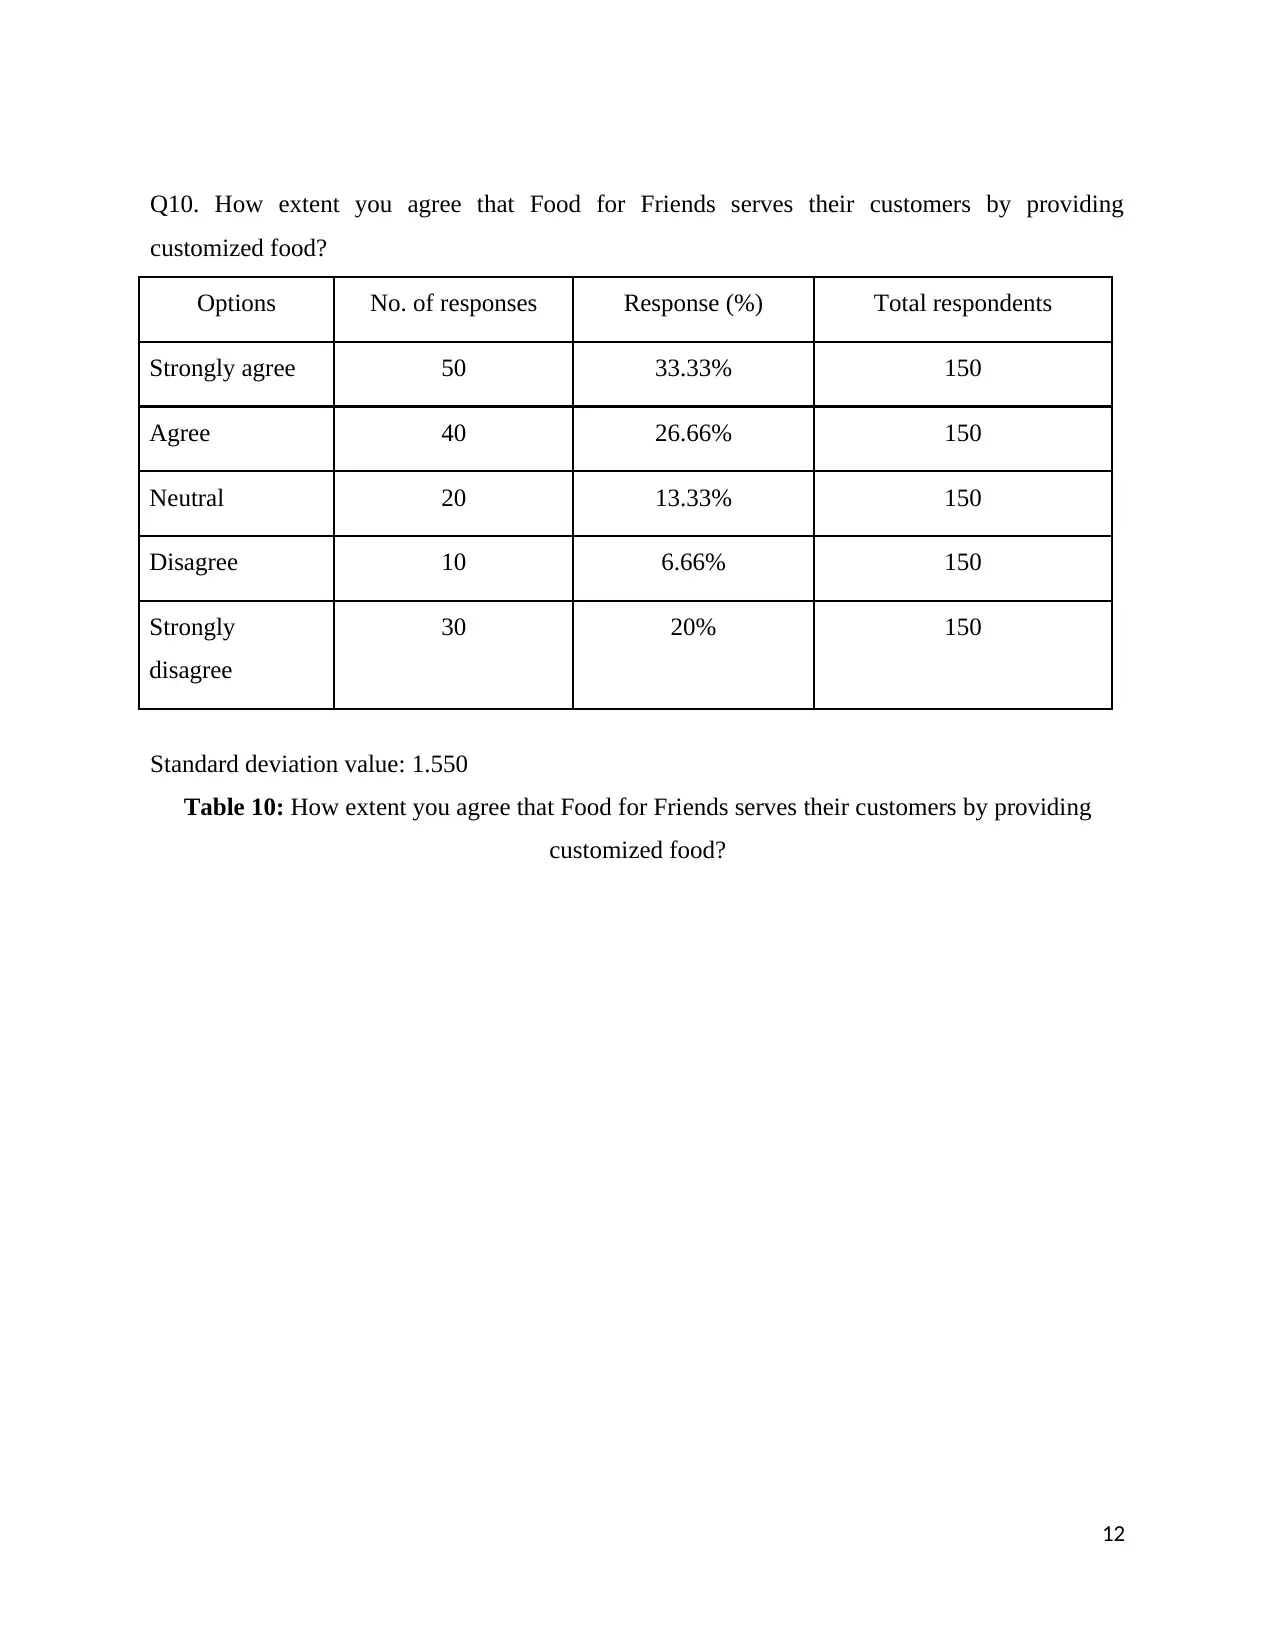
Q10. How extent you agree that Food for Friends serves their customers by providing
customized food?
Options No. of responses Response (%) Total respondents
Strongly agree 50 33.33% 150
Agree 40 26.66% 150
Neutral 20 13.33% 150
Disagree 10 6.66% 150
Strongly
disagree
30 20% 150
Standard deviation value: 1.550
Table 10: How extent you agree that Food for Friends serves their customers by providing
customized food?
12
customized food?
Options No. of responses Response (%) Total respondents
Strongly agree 50 33.33% 150
Agree 40 26.66% 150
Neutral 20 13.33% 150
Disagree 10 6.66% 150
Strongly
disagree
30 20% 150
Standard deviation value: 1.550
Table 10: How extent you agree that Food for Friends serves their customers by providing
customized food?
12
⊘ This is a preview!⊘
Do you want full access?
Subscribe today to unlock all pages.
Trusted by 1+ million students worldwide
1 out of 22
Related Documents


Your All-in-One AI-Powered Toolkit for Academic Success.
+13062052269
info@desklib.com
Available 24*7 on WhatsApp / Email
![[object Object]](/_next/static/media/star-bottom.7253800d.svg)
Unlock your academic potential
Copyright © 2020–2026 A2Z Services. All Rights Reserved. Developed and managed by ZUCOL.