Business Decision Making Unit: UKCBC Student Satisfaction Report
VerifiedAdded on 2020/02/03
|15
|4645
|41
Report
AI Summary
This report, prepared for UK College of Business and Computing (UKCBC), details a student survey conducted to assess student experience and satisfaction, crucial for a Quality Assurance Agency (QAA) review. The report outlines the data collection plan, emphasizing primary and secondary data sources, including questionnaires and various survey methodologies like personal interviews and telephonic surveys. The core of the report involves analyzing data collected from 200 students using statistical tools such as mean, median, and mode to gauge satisfaction levels, alongside measures of dispersion including variance, standard deviation, quartiles, percentiles, and correlation coefficients. It includes graphical representations and trend line analysis, and also discusses information processing and financial tools for decision-making within the context of the college. The survey results provide insights into student perceptions of the college environment, teacher behavior, hostel facilities, library resources, security, and desired course offerings, all aimed at informing improvements and strategic decisions for UKCBC.
Business Decision Making
Paraphrase This Document
Need a fresh take? Get an instant paraphrase of this document with our AI Paraphraser
Table of Contents
INTRODUCTION...........................................................................................................................3
TASK 1............................................................................................................................................3
1.1 Plan for gathering data..........................................................................................................3
1.2 Survey methodology.............................................................................................................4
1.3 Questionnaire........................................................................................................................4
TASK 2............................................................................................................................................6
2.1 & 2.2 Data collected through survey and analyse results ....................................................6
2.3 Analyse data via measures of dispersion..............................................................................7
2.4 Explain of quartile, percentile and coefficient correlation....................................................7
TASK 3............................................................................................................................................9
3.1 Graph.....................................................................................................................................9
3.2 Trend line............................................................................................................................11
3.3 Covered in PPT...................................................................................................................11
3.4 Formal report.......................................................................................................................11
TASK 4..........................................................................................................................................12
4.1 Different information processing tools...............................................................................12
4.2 Project plan and framing critical path.................................................................................13
4.3 Financial tools for decision making....................................................................................14
CONCLUSION..............................................................................................................................15
REFERENCES..............................................................................................................................16
INTRODUCTION
Decision making is necessary and essential in the firm so that they can not face any issues
in attaining the success in the competitive market. Decision making is the process of making
choices by identifying a decision, gathering or collecting the information as well as assessing the
alternative resolutions. It helps in reaping the success and targets (Barry and Edgman-Levitan,
2012). The employees of the business entity have to do proper research and have to identify the
needs and wants of consumers and on the basis of that they have to attain the advantage in the
market. To attain the best results proper decisions needs to be taken by using the appropriate and
innovative technology. The present report is based on UK college of business as well as
computing. In every college, documents of the students required as it helps in getting the
information so that they can get satisfied (Quartiles, percentiles and correlation coefficients,
2017). In the below mentioned assignment, employees of the business entity have to do proper
analysis by using the appropriate techniques whether it is primary or secondary data. They have
to attain the good results, data collection process needs to be done in a proper and efficient
manner so that they can accomplish the goals and objectives.
TASK 1
1.1 Plan for gathering data
For gathering the actual data or information the employees of UK college have to maker
a plan and have to use that plan which succour in accurate information or data so that they can
attain the success in the competitive market. They have to use primary or secondary data which
includes:
Primary data: It is the data which is collect first hand information and it is helps in
specific projects. It includes the different tools and techniques which include the questionnaire,
interviews, direct observations etc. interviews helps in collecting the information directly from
the students and by using the appropriate knowledge and skills. The employees can make
questionnaire and filled by the students which helps in finding and analysing the area which
needs to be developed. Along with this they can use observation method which helps in
collecting data by observing the particular respondent but it is time consuming method so that it
takes lot of time to gather the information (Cronan and et. al., 2011).
⊘ This is a preview!⊘
Do you want full access?
Subscribe today to unlock all pages.
Trusted by 1+ million students worldwide
Secondary data: It is the second hand collected data as it means that the information or
data are not directly collected by the user. It can be collected by the some other person. In this
data can be collected by using quantitative and qualitative technique. It can be classified into two
parts that is internal and external source. In internal source it includes sales report, financial
statements, reports and feedbacks etc. but on the other side external includes libraries, business
journals, articles along with the internet which helps in attaining the knowledge from the
different sources.
1.2 Survey methodology
There are different methodology which helps in doing the survey. It is a field which helps
in applying the statistics of the survey related to human research. Along with this they have to do
sampling for the individual units from the population by using the distinctive collection
technique which involves the questionnaire, interviews etc. The employees of UK college by
making the questionnaire as well as survey can be done by them. Distinctive questions asked by
the students and the answers which are given by them helps in doing data evaluation and present
that data or information into statistical form. This methodology are classified into three types
which includes personal interview, mail survey, telephonic survey etc. Personal interview is the
method which helps in doing the proper survey of the students and it helps in collecting or
gathering the accurate information by observing the facial expressions of respondent (Fassin and
Buelens, 2011). They also can conduct the mail as well as telephonic survey and it should be
done randomly as it helps in collecting data or information in a specific time limit. By doing the
survey, they have to do sample framing process which helps in selecting the group which are
different from each other. In this task, quality assurance agency have to use random sampling
method in which employees of UK college have to prepare questionnaire and filled up by
students which helps in attaining or accomplishing the best outcome.
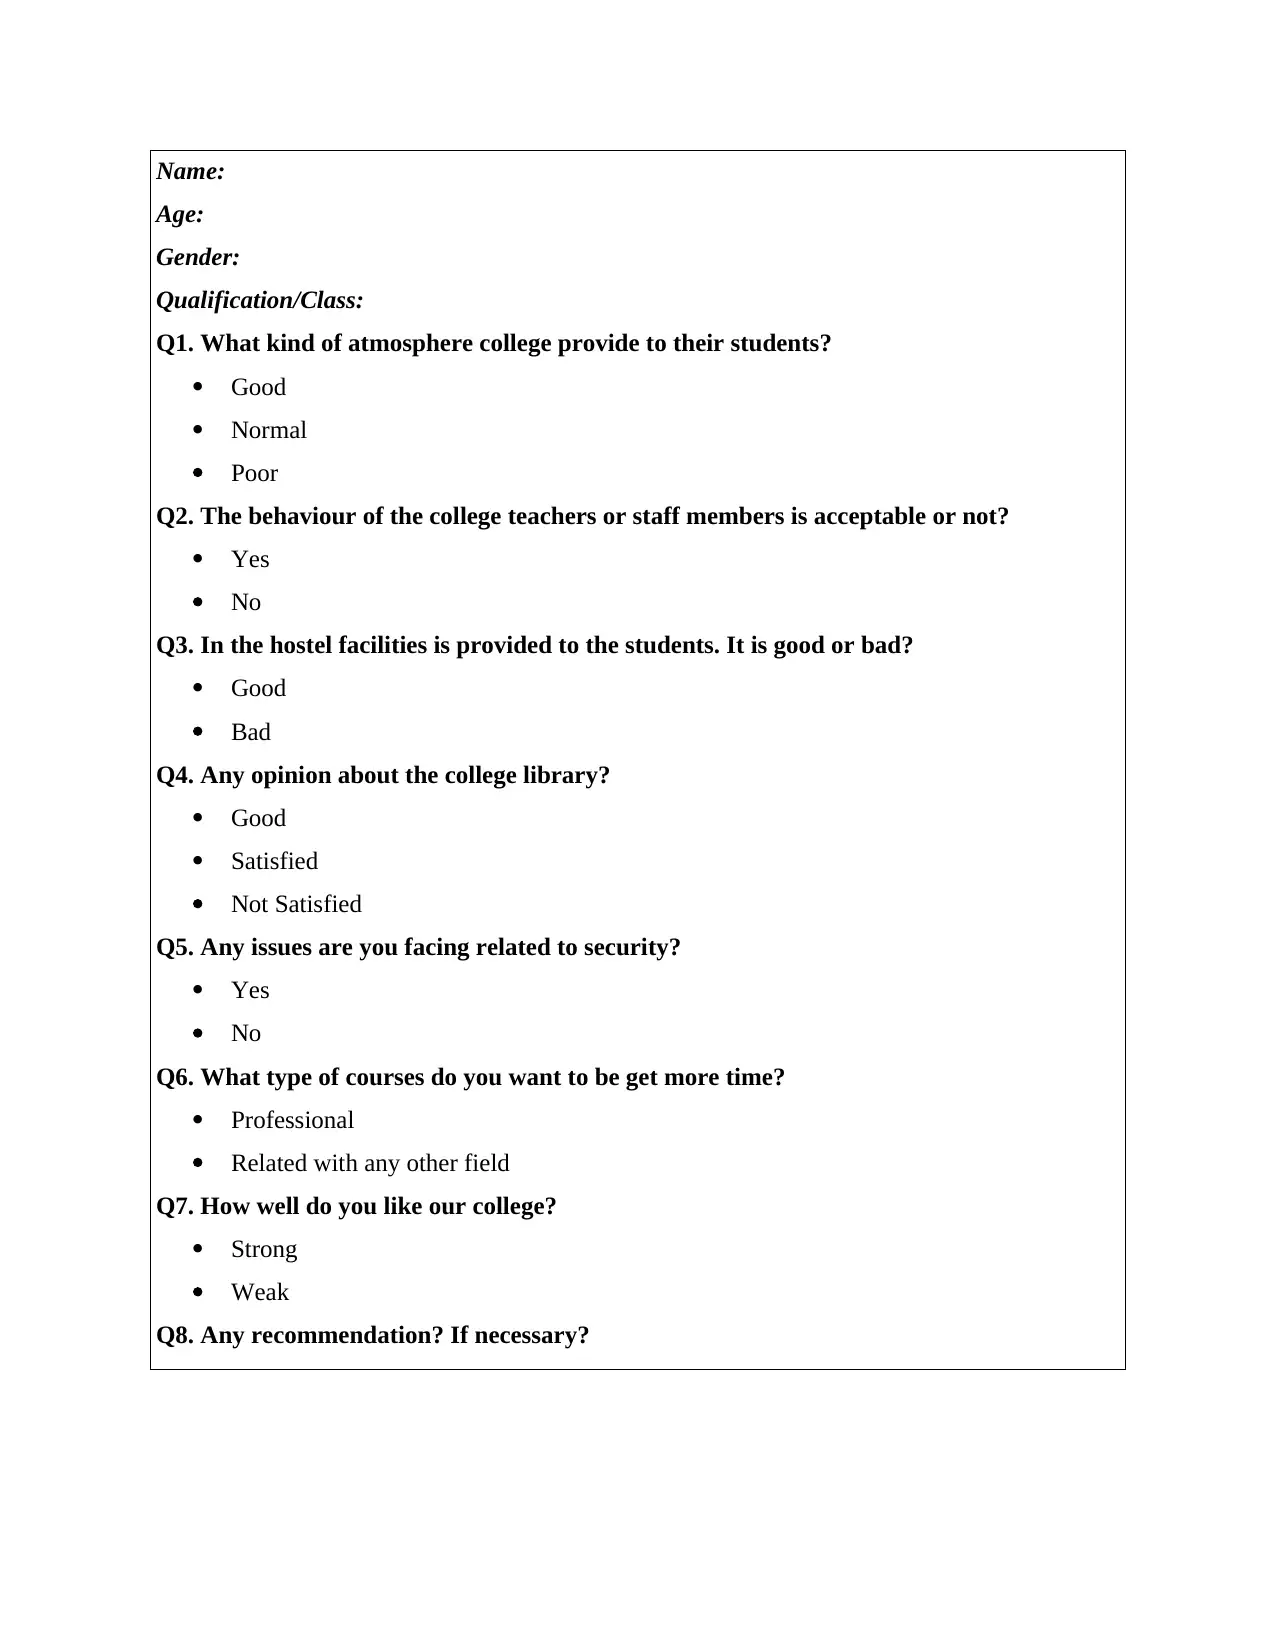
1.3 Questionnaire
The employees of UK college have to make questionnaire which includes the different
questions and on the basis of that they can collect the accurate information and this questionnaire
is based on the 200 students and they have to do random sampling (Ford and Richardson, 2013).
It helps the college of UK in calculation in attaining the actual information or data so that all the
students helps in providing the proper satisfaction along with the experience.
data are not directly collected by the user. It can be collected by the some other person. In this
data can be collected by using quantitative and qualitative technique. It can be classified into two
parts that is internal and external source. In internal source it includes sales report, financial
statements, reports and feedbacks etc. but on the other side external includes libraries, business
journals, articles along with the internet which helps in attaining the knowledge from the
different sources.
1.2 Survey methodology
There are different methodology which helps in doing the survey. It is a field which helps
in applying the statistics of the survey related to human research. Along with this they have to do
sampling for the individual units from the population by using the distinctive collection
technique which involves the questionnaire, interviews etc. The employees of UK college by
making the questionnaire as well as survey can be done by them. Distinctive questions asked by
the students and the answers which are given by them helps in doing data evaluation and present
that data or information into statistical form. This methodology are classified into three types
which includes personal interview, mail survey, telephonic survey etc. Personal interview is the
method which helps in doing the proper survey of the students and it helps in collecting or
gathering the accurate information by observing the facial expressions of respondent (Fassin and
Buelens, 2011). They also can conduct the mail as well as telephonic survey and it should be
done randomly as it helps in collecting data or information in a specific time limit. By doing the
survey, they have to do sample framing process which helps in selecting the group which are
different from each other. In this task, quality assurance agency have to use random sampling
method in which employees of UK college have to prepare questionnaire and filled up by
students which helps in attaining or accomplishing the best outcome.
1.3 Questionnaire
The employees of UK college have to make questionnaire which includes the different
questions and on the basis of that they can collect the accurate information and this questionnaire
is based on the 200 students and they have to do random sampling (Ford and Richardson, 2013).
It helps the college of UK in calculation in attaining the actual information or data so that all the
students helps in providing the proper satisfaction along with the experience.
Paraphrase This Document
Need a fresh take? Get an instant paraphrase of this document with our AI Paraphraser
Name:
Age:
Gender:
Qualification/Class:
Q1. What kind of atmosphere college provide to their students?
Good
Normal
Poor
Q2. The behaviour of the college teachers or staff members is acceptable or not?
Yes
No
Q3. In the hostel facilities is provided to the students. It is good or bad?
Good
Bad
Q4. Any opinion about the college library?
Good
Satisfied
Not Satisfied
Q5. Any issues are you facing related to security?
Yes
No
Q6. What type of courses do you want to be get more time?
Professional
Related with any other field
Q7. How well do you like our college?
Strong
Weak
Q8. Any recommendation? If necessary?
TASK 2
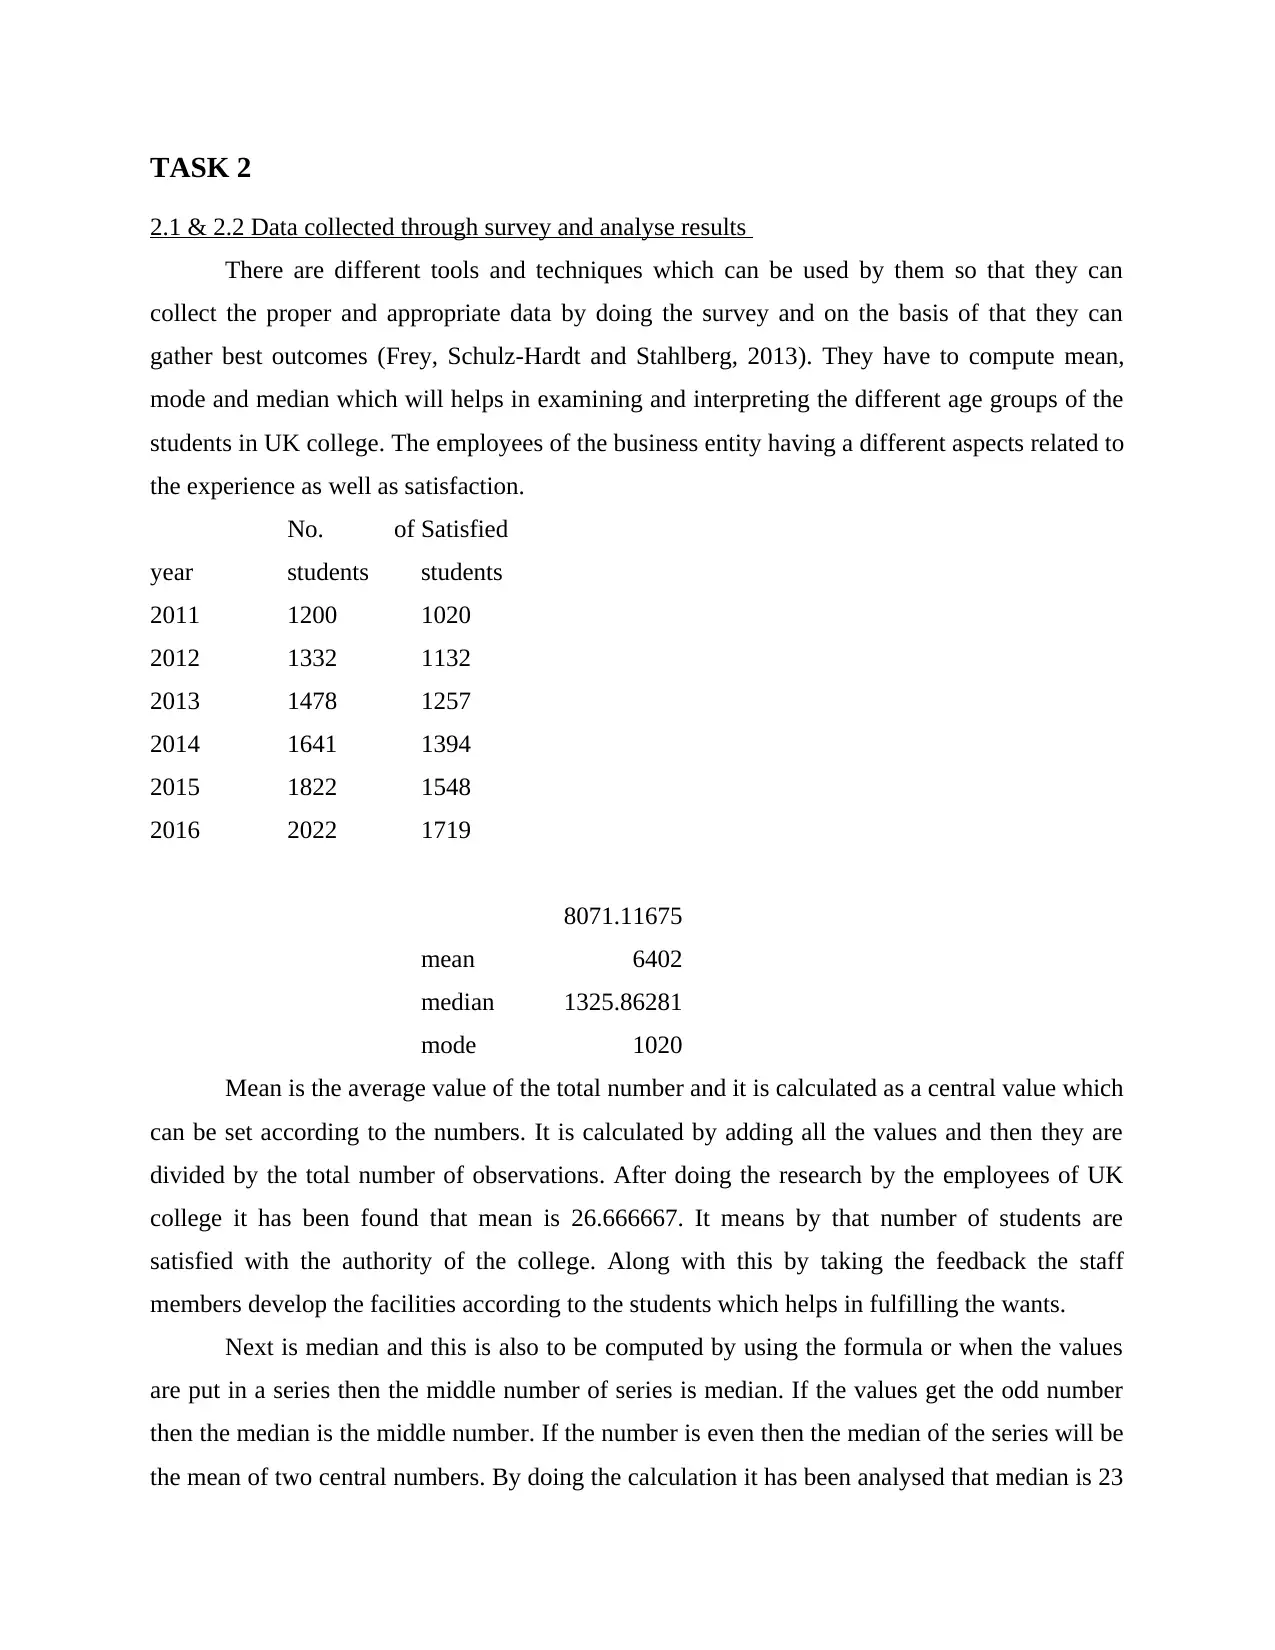
2.1 & 2.2 Data collected through survey and analyse results
There are different tools and techniques which can be used by them so that they can
collect the proper and appropriate data by doing the survey and on the basis of that they can
gather best outcomes (Frey, Schulz-Hardt and Stahlberg, 2013). They have to compute mean,
mode and median which will helps in examining and interpreting the different age groups of the
students in UK college. The employees of the business entity having a different aspects related to
the experience as well as satisfaction.
year
No. of
students
Satisfied
students
2011 1200 1020
2012 1332 1132
2013 1478 1257
2014 1641 1394
2015 1822 1548
2016 2022 1719
mean
8071.11675
6402
median 1325.86281
mode 1020
Mean is the average value of the total number and it is calculated as a central value which
can be set according to the numbers. It is calculated by adding all the values and then they are
divided by the total number of observations. After doing the research by the employees of UK
college it has been found that mean is 26.666667. It means by that number of students are
satisfied with the authority of the college. Along with this by taking the feedback the staff
members develop the facilities according to the students which helps in fulfilling the wants.
Next is median and this is also to be computed by using the formula or when the values
are put in a series then the middle number of series is median. If the values get the odd number
then the median is the middle number. If the number is even then the median of the series will be
the mean of two central numbers. By doing the calculation it has been analysed that median is 23
⊘ This is a preview!⊘
Do you want full access?
Subscribe today to unlock all pages.
Trusted by 1+ million students worldwide
and it denotes that the students are more satisfied by filling the questionnaire (Gabrielsson and
Gabrielsson, 2013).
Another is mode and it also helps in finding and analysing the survey as it includes the
value which helps in appearing the set of data which is the mode of discrete probability
distribution is the value x at which its probability mass function which is to be taken at a
maximum value. By doing the calculation mode is 25 and by this it has been identify that 25
number of students are satisfied by the authority of the college and on the basis of that they can
attain the success in the competitive market.
2.3 Analyse data via measures of dispersion
In the statistics, measures of dispersion also known as variability, scatter as well as
spread which is the extent to which a distribution is stretched which helps in extent to which a
distribution should be stretched and squeezed. It includes the variance and standard deviation. A
variance measures the degree of spread in a variable values. A population variance is the average
squared which is having a difference between the variable's values as well as mean for that
variable. The squared residual is random as well as they have to calculate the mean which is
based on population. They have to provide the proper distribution so that stretch level can occur
in a proper manner. It helps in attaining aims by stretching the data to the extent level
(Gigerenzer and Gaissmaier, 2011). The most common phrases of the measures of dispersion
includes range and standard deviation. It includes the non negative number which includes the
real number as well as value which highlights the zero so that they can increase accordingly.
Measures of dispersion is classified into three different terms which named as standard deviation,
in quartile range as well as range. The fractions which are related to the variance explained as a
coefficient of determination. Standard deviation is a quantity which is expressing by how much
members of a group differ from the mean value for the group so that they can compute the data
in a proper manner and on the basis of that they can not face any obstacles and attain the goals
and objectives as well as reap the success (Isik, Jonesand Sidorova, 2013).
2.4 Explain of quartile, percentile and coefficient correlation
Quartile, percentile along with the correlation coefficient is a part of measures of
dispersion. It aid in computing the statistical data which helps in doing the more expansion as
well as elaboration of the data which help employees in understand the information or data in a
easy way. They can evaluate the data and information in a proper way by using three terms:
Paraphrase This Document
Need a fresh take? Get an instant paraphrase of this document with our AI Paraphraser
Quartile: It is a statistical term which helps in describing a division of observations into
four defined the intervals which is based on the values of the data as well as they have to
compare the entire data of observations so that they can attain the success in the competitive
market. The first quartile is to be considered as a middle between the smallest number as well as
medium set. The second quartile (Q2) is the median of the data. The third Quartile(Q3) is the
medium value between the highest value and medium set (Zimmerman and Yahya-Zadeh, 2011).
Percentile: It is the number as well as the value which helps in indicating the number as
well as percentage of the position in a list. It helps in signifying and analysing the percentage the
value of a number from the data or information. Percentile help in describing the variables by
doing the distributing the other value frequency. It also to be considered that distributing the each
value into the frequency according to the equal level.
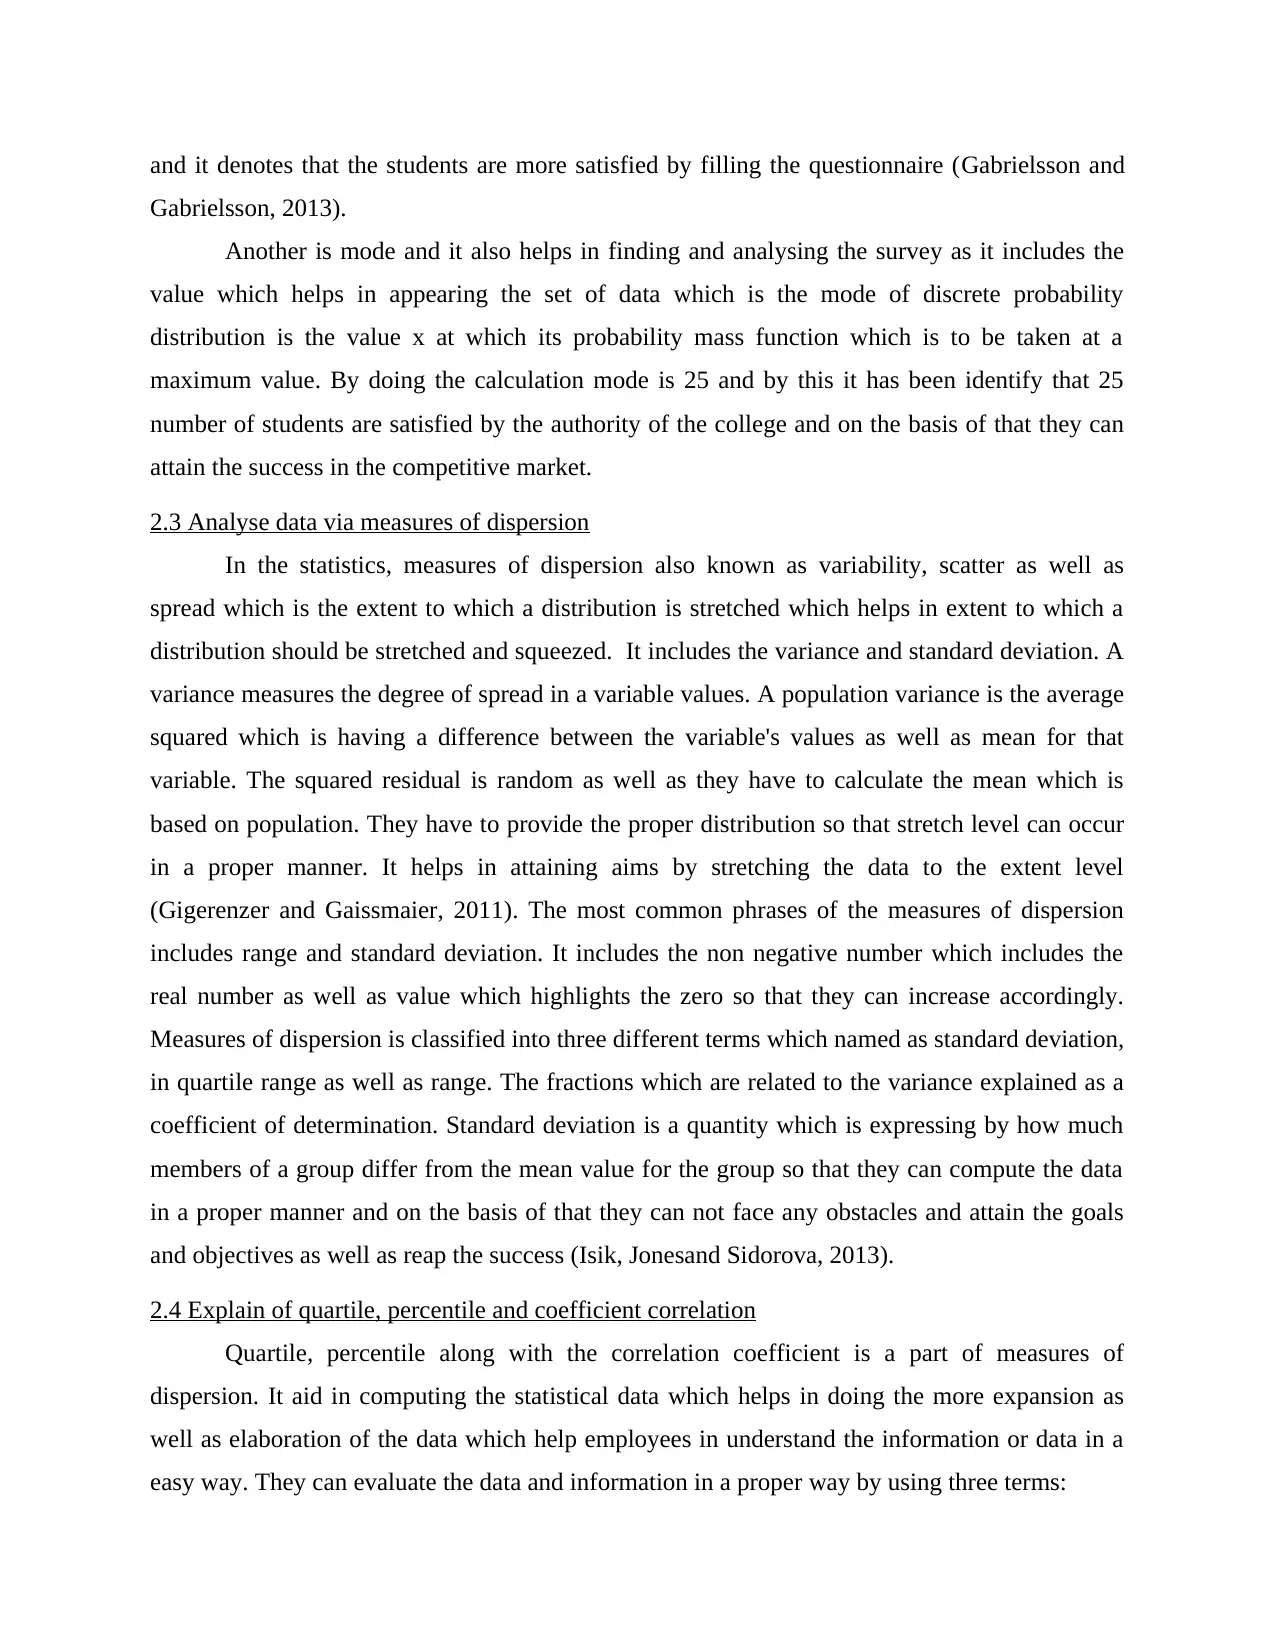
Coefficient correlation: It is also a part of measure of dispersion and it is considered as a
parameter which helps in determining the degree in which two variables are located and they are
interrelated with each other.
year
No. of
students Satisfied students
2011 1200 1020
2012 1332 1132.2
2013 1478.52 1256.742
2014 1641.1572 1394.98362
2015
1821.68449
2 1548.4318182
2016
2022.06978
612 1718.759318202
standard deviation
261.639829
3738
coefficient of
correlation 1
1st quartile 1020
2nd quartile 1020
four defined the intervals which is based on the values of the data as well as they have to
compare the entire data of observations so that they can attain the success in the competitive
market. The first quartile is to be considered as a middle between the smallest number as well as
medium set. The second quartile (Q2) is the median of the data. The third Quartile(Q3) is the
medium value between the highest value and medium set (Zimmerman and Yahya-Zadeh, 2011).
Percentile: It is the number as well as the value which helps in indicating the number as
well as percentage of the position in a list. It helps in signifying and analysing the percentage the
value of a number from the data or information. Percentile help in describing the variables by
doing the distributing the other value frequency. It also to be considered that distributing the each
value into the frequency according to the equal level.
Coefficient correlation: It is also a part of measure of dispersion and it is considered as a
parameter which helps in determining the degree in which two variables are located and they are
interrelated with each other.
year
No. of
students Satisfied students
2011 1200 1020
2012 1332 1132.2
2013 1478.52 1256.742
2014 1641.1572 1394.98362
2015
1821.68449
2 1548.4318182
2016
2022.06978
612 1718.759318202
standard deviation
261.639829
3738
coefficient of
correlation 1
1st quartile 1020
2nd quartile 1020
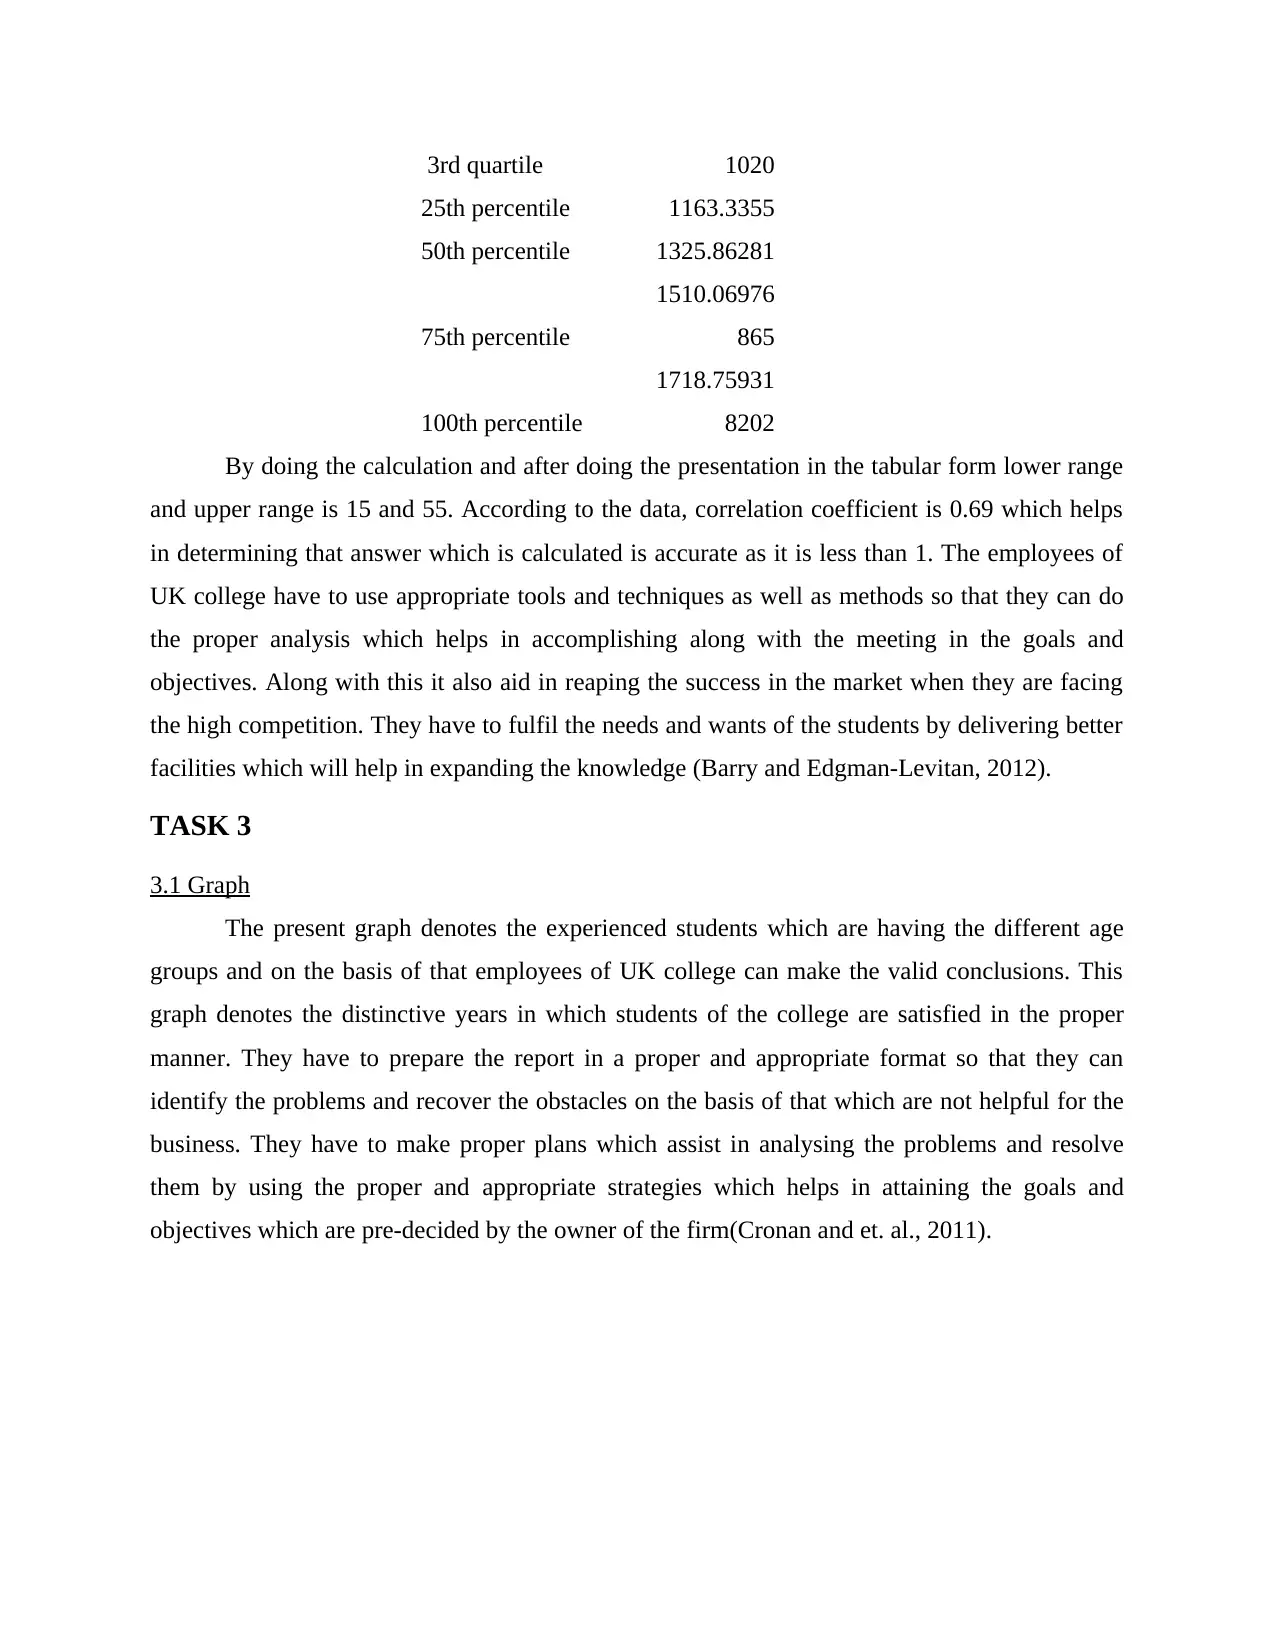
3rd quartile 1020
25th percentile 1163.3355
50th percentile 1325.86281
75th percentile
1510.06976
865
100th percentile
1718.75931
8202
By doing the calculation and after doing the presentation in the tabular form lower range
and upper range is 15 and 55. According to the data, correlation coefficient is 0.69 which helps
in determining that answer which is calculated is accurate as it is less than 1. The employees of
UK college have to use appropriate tools and techniques as well as methods so that they can do
the proper analysis which helps in accomplishing along with the meeting in the goals and
objectives. Along with this it also aid in reaping the success in the market when they are facing
the high competition. They have to fulfil the needs and wants of the students by delivering better
facilities which will help in expanding the knowledge (Barry and Edgman-Levitan, 2012).
TASK 3
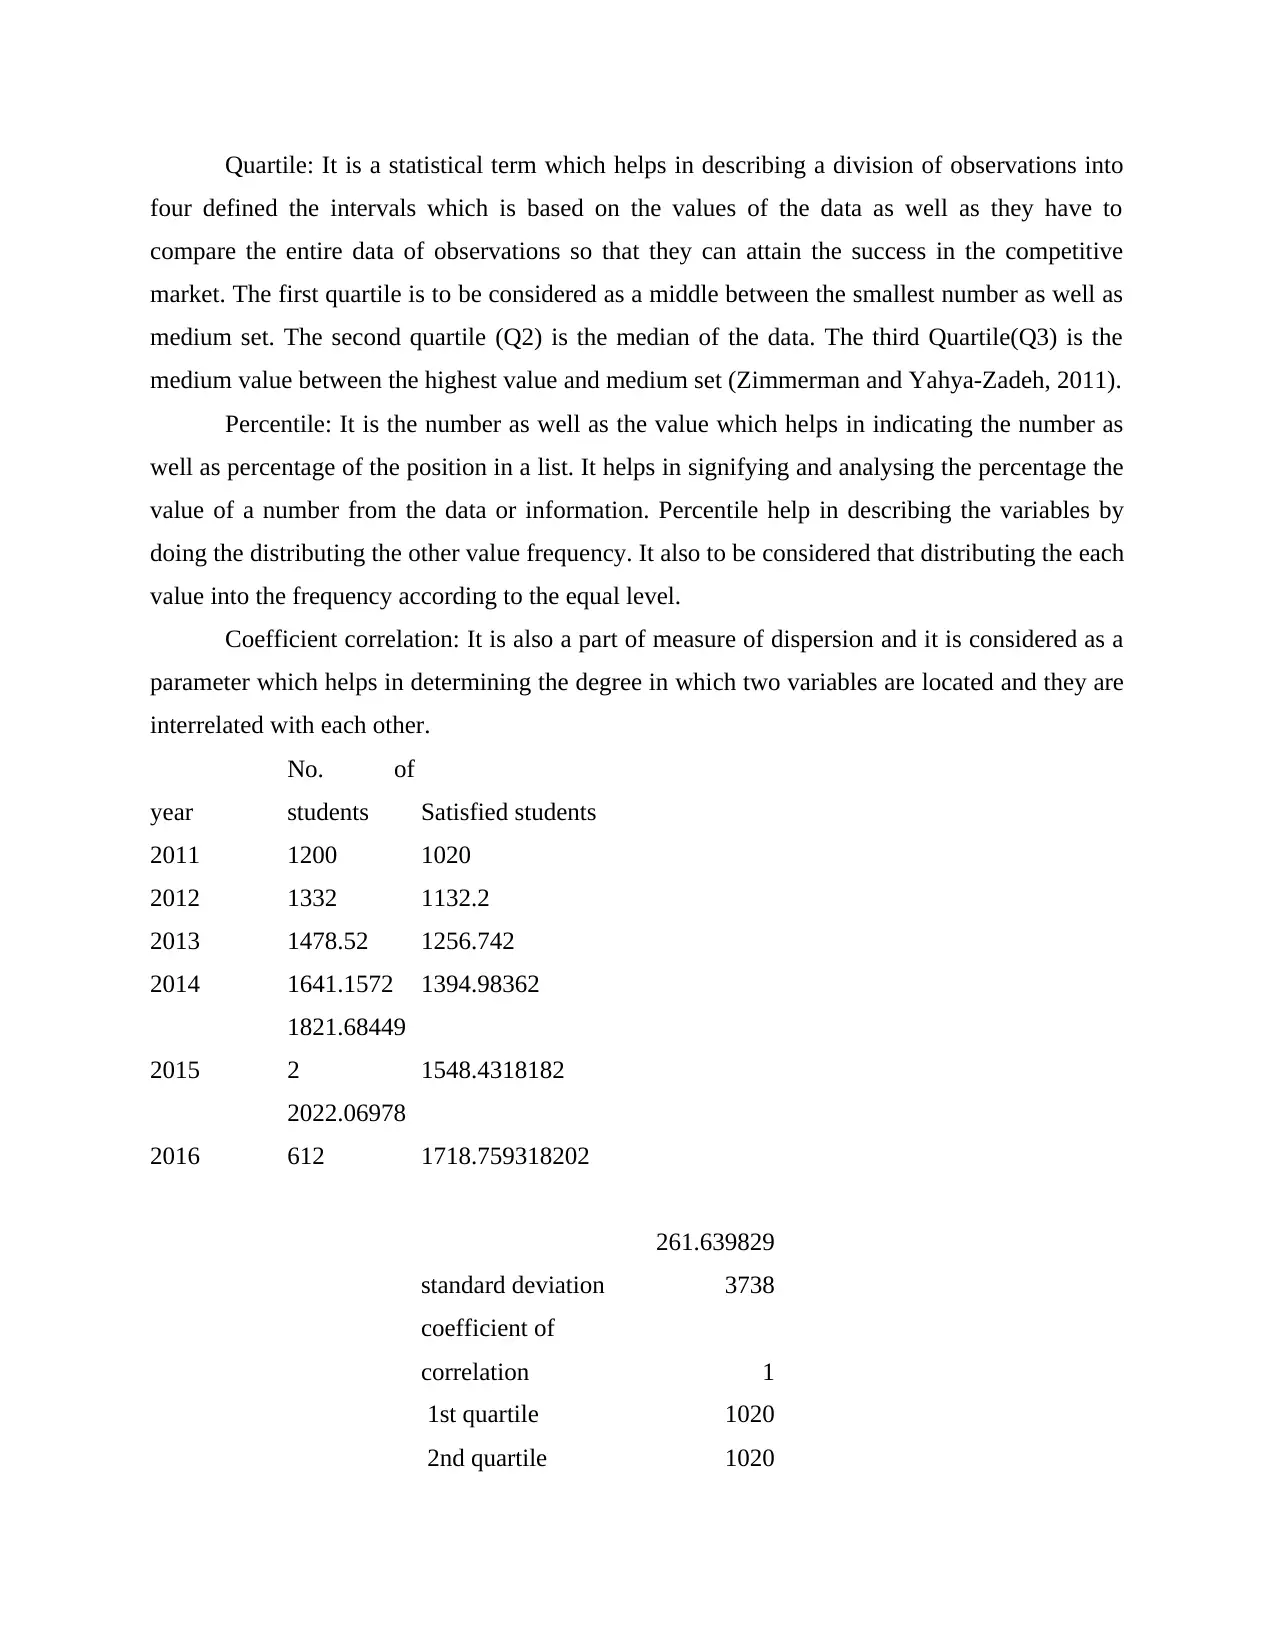
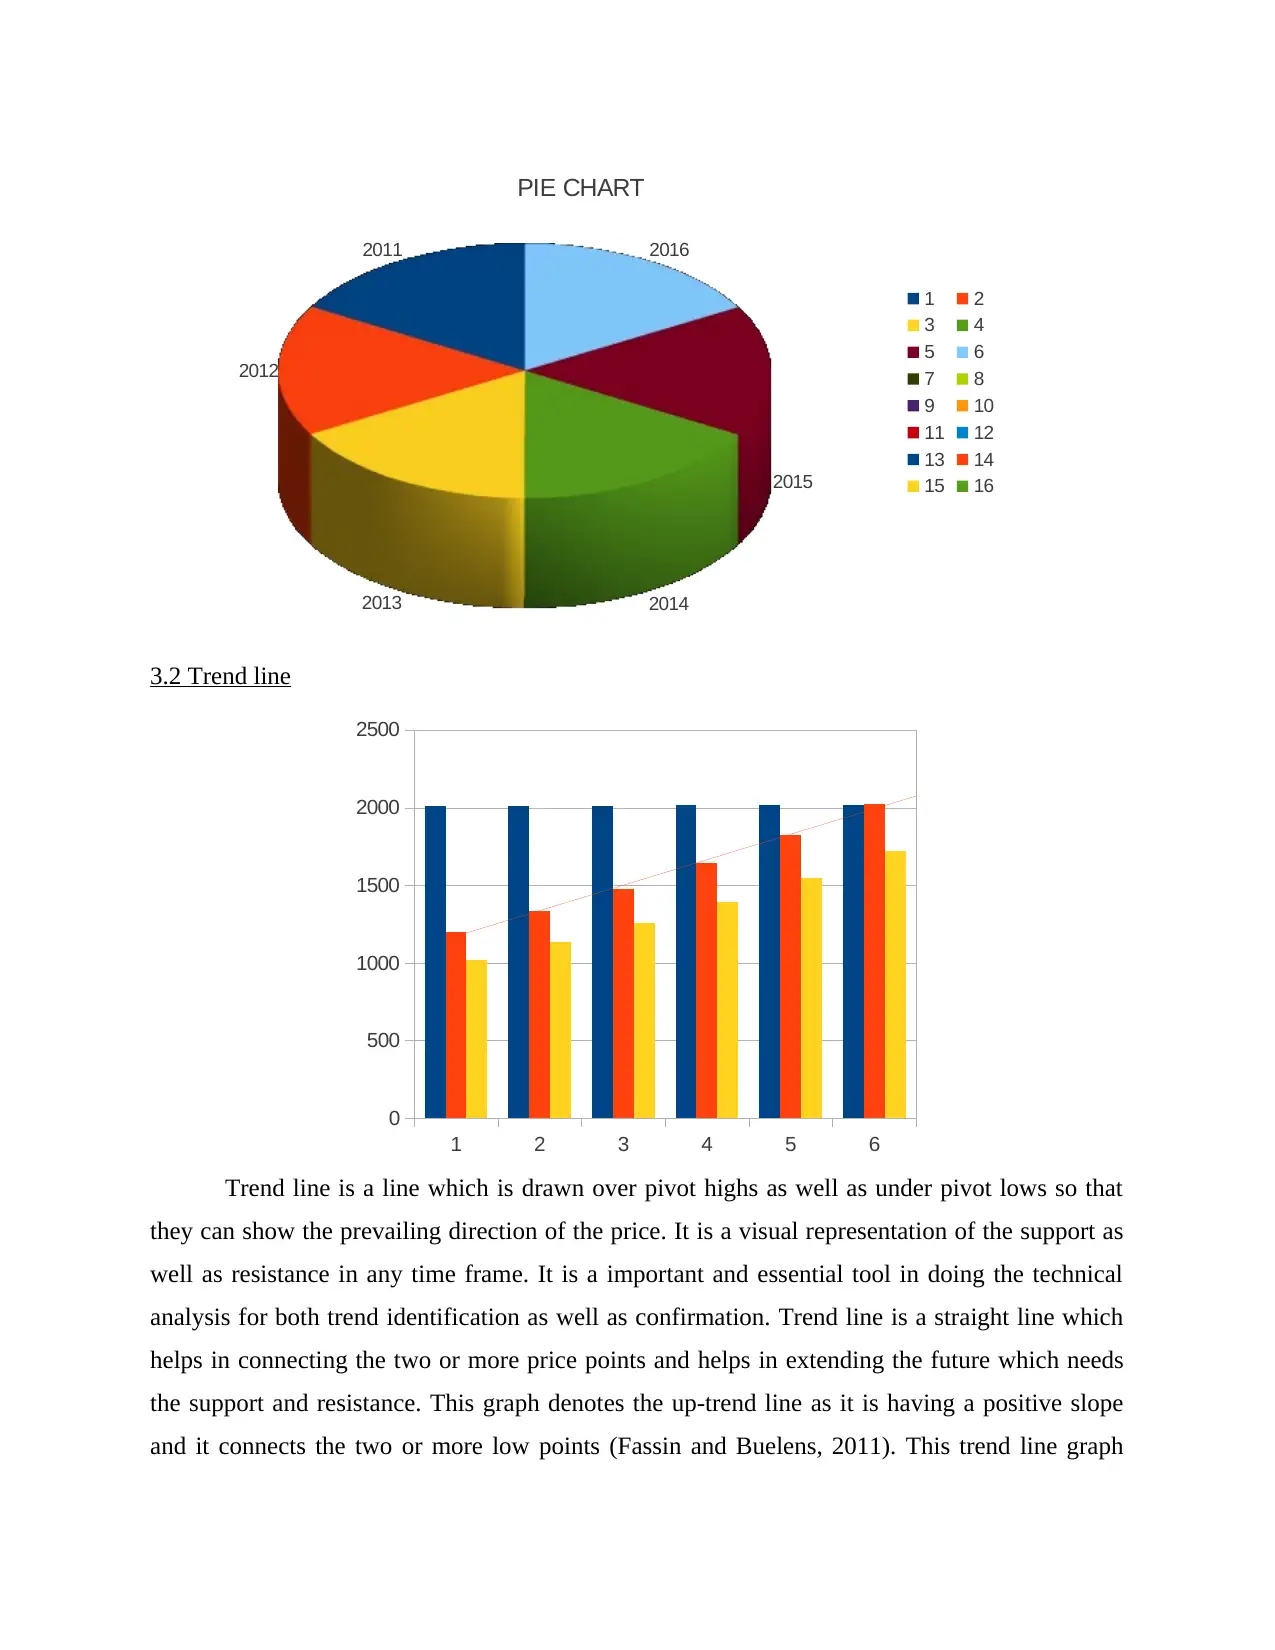
3.1 Graph
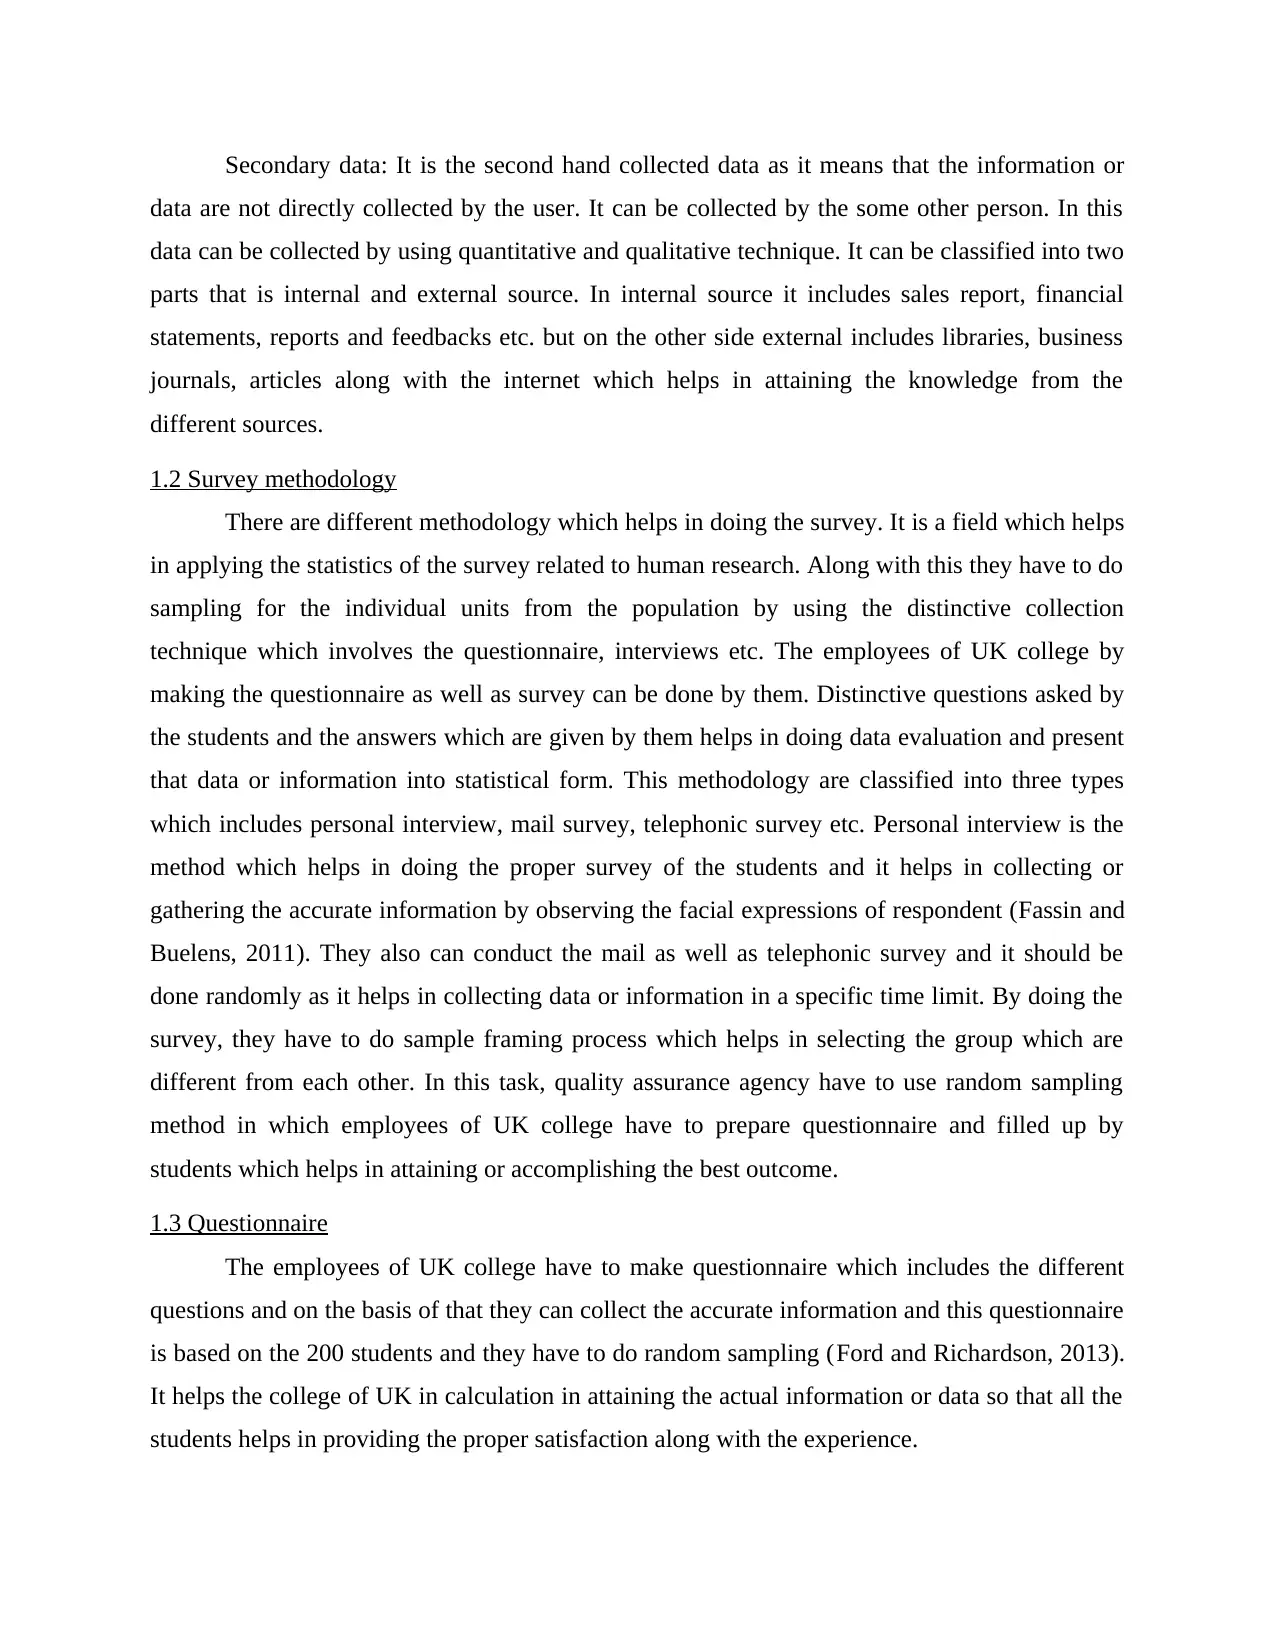
The present graph denotes the experienced students which are having the different age
groups and on the basis of that employees of UK college can make the valid conclusions. This
graph denotes the distinctive years in which students of the college are satisfied in the proper
manner. They have to prepare the report in a proper and appropriate format so that they can
identify the problems and recover the obstacles on the basis of that which are not helpful for the
business. They have to make proper plans which assist in analysing the problems and resolve
them by using the proper and appropriate strategies which helps in attaining the goals and
objectives which are pre-decided by the owner of the firm(Cronan and et. al., 2011).
25th percentile 1163.3355
50th percentile 1325.86281
75th percentile
1510.06976
865
100th percentile
1718.75931
8202
By doing the calculation and after doing the presentation in the tabular form lower range
and upper range is 15 and 55. According to the data, correlation coefficient is 0.69 which helps
in determining that answer which is calculated is accurate as it is less than 1. The employees of
UK college have to use appropriate tools and techniques as well as methods so that they can do
the proper analysis which helps in accomplishing along with the meeting in the goals and
objectives. Along with this it also aid in reaping the success in the market when they are facing
the high competition. They have to fulfil the needs and wants of the students by delivering better
facilities which will help in expanding the knowledge (Barry and Edgman-Levitan, 2012).
TASK 3
3.1 Graph
The present graph denotes the experienced students which are having the different age
groups and on the basis of that employees of UK college can make the valid conclusions. This
graph denotes the distinctive years in which students of the college are satisfied in the proper
manner. They have to prepare the report in a proper and appropriate format so that they can
identify the problems and recover the obstacles on the basis of that which are not helpful for the
business. They have to make proper plans which assist in analysing the problems and resolve
them by using the proper and appropriate strategies which helps in attaining the goals and
objectives which are pre-decided by the owner of the firm(Cronan and et. al., 2011).
⊘ This is a preview!⊘
Do you want full access?
Subscribe today to unlock all pages.
Trusted by 1+ million students worldwide
2011
2012
2013 2014
2015
2016
PIE CHART
1 2
3 4
5 6
7 8
9 10
11 12
13 14
15 16
3.2 Trend line
Trend line is a line which is drawn over pivot highs as well as under pivot lows so that
they can show the prevailing direction of the price. It is a visual representation of the support as
well as resistance in any time frame. It is a important and essential tool in doing the technical
analysis for both trend identification as well as confirmation. Trend line is a straight line which
helps in connecting the two or more price points and helps in extending the future which needs
the support and resistance. This graph denotes the up-trend line as it is having a positive slope
and it connects the two or more low points (Fassin and Buelens, 2011). This trend line graph
1 2 3 4 5 6
0
500
1000
1500
2000
2500
Paraphrase This Document
Need a fresh take? Get an instant paraphrase of this document with our AI Paraphraser
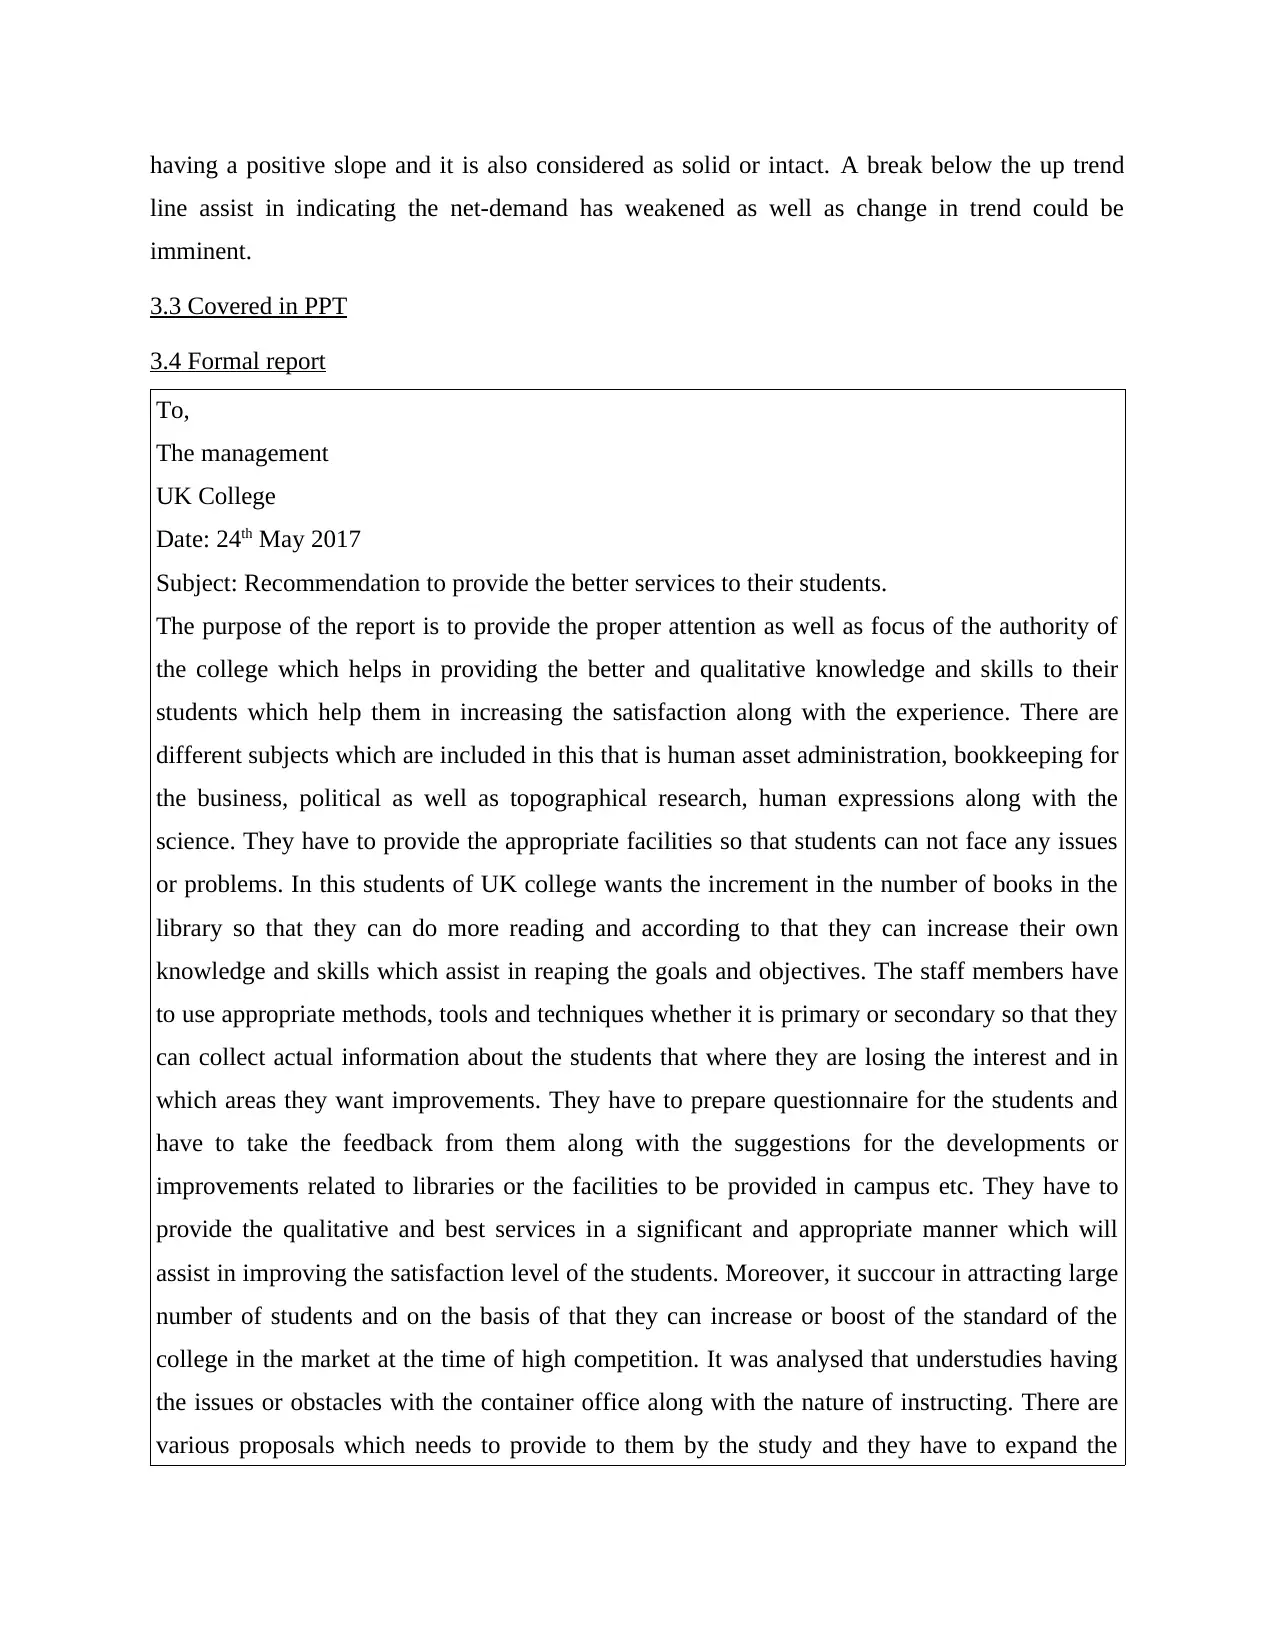
having a positive slope and it is also considered as solid or intact. A break below the up trend
line assist in indicating the net-demand has weakened as well as change in trend could be
imminent.
3.3 Covered in PPT
3.4 Formal report
To,
The management
UK College
Date: 24th May 2017
Subject: Recommendation to provide the better services to their students.
The purpose of the report is to provide the proper attention as well as focus of the authority of
the college which helps in providing the better and qualitative knowledge and skills to their
students which help them in increasing the satisfaction along with the experience. There are
different subjects which are included in this that is human asset administration, bookkeeping for
the business, political as well as topographical research, human expressions along with the
science. They have to provide the appropriate facilities so that students can not face any issues
or problems. In this students of UK college wants the increment in the number of books in the
library so that they can do more reading and according to that they can increase their own
knowledge and skills which assist in reaping the goals and objectives. The staff members have
to use appropriate methods, tools and techniques whether it is primary or secondary so that they
can collect actual information about the students that where they are losing the interest and in
which areas they want improvements. They have to prepare questionnaire for the students and
have to take the feedback from them along with the suggestions for the developments or
improvements related to libraries or the facilities to be provided in campus etc. They have to
provide the qualitative and best services in a significant and appropriate manner which will
assist in improving the satisfaction level of the students. Moreover, it succour in attracting large
number of students and on the basis of that they can increase or boost of the standard of the
college in the market at the time of high competition. It was analysed that understudies having
the issues or obstacles with the container office along with the nature of instructing. There are
various proposals which needs to provide to them by the study and they have to expand the
office in the school. They have to conduct the different programs to them which assist in
providing the satisfaction and which will helps in attracting the large number of students which
assist in generating more and more revenue.
TASK 4
4.1 Different information processing tools
The employees of the firm have to use appropriate information tools which includes
computers or software's and they are helpful to them in managing the data or information. The
staff members have to use appropriate and updated technologies which help the employees in
recording or analysing the data. If they are using or adopting computer technology which
includes internet which helps in doing the easy development or improvement of information and
it takes less time consuming process. Along with this they have to improve the communication
panel among the employees of the business entity. The UK college can use different software
programmes which assist in increasing the efficiency for the business as it is a effective tool
which provides the help to them in framing the strategies for each level of the business. These
are the group of programmes which is performed by the business function as it aid in raising the
productivity of the business efficiency in the businesses (Ford and Richardson, 2013).
In the operational level of the business entity have to do the operational activities. The
employees who are working in this level they have to make proper schedule by allocating the
appropriate resources according to the budgets so that they can attain the success. They have to
make appropriate and relevant decision for the operational task.
The employees of tactical level helps in framing the strategies, rules and regulation as
well as policies which are helpful for them in making the correct decisions. The leaders have to
do proper allocation of the work in their teams and on the basis of their allocation they can
measure the performance. It helps in resolving the problems and according to that they can make
appropriate decisions (Frey, Schulz-Hardt and Stahlberg, 2013).
Another level in the organisation is strategic level which helps in framing the goals and
objectives for the firm. This will help in measuring the performance and productivity which
assist in maintaining the efficiency and take appropriate decisions for the betterment of the
business entity.
⊘ This is a preview!⊘
Do you want full access?
Subscribe today to unlock all pages.
Trusted by 1+ million students worldwide
1 out of 15
Related Documents


Your All-in-One AI-Powered Toolkit for Academic Success.
+13062052269
info@desklib.com
Available 24*7 on WhatsApp / Email
![[object Object]](/_next/static/media/star-bottom.7253800d.svg)
Unlock your academic potential
Copyright © 2020–2026 A2Z Services. All Rights Reserved. Developed and managed by ZUCOL.