Business Decision Making Report: Impact of Technology on Retail Sales
VerifiedAdded on 2023/02/10
|19
|3724
|59
Report
AI Summary
This comprehensive report delves into business decision-making within the retail sector, examining the evolving landscape of customer shopping habits and the impact of technological advancements. The report outlines a plan for gathering primary and secondary data, including survey methodology and questionnaire design. It analyzes survey results, interpreting data using measures of dispersion, quartiles, percentiles, and correlation coefficients. The analysis includes spreadsheet representations, graphical representations of sales and profit growth, and a formal report suitable for publication. Furthermore, the report explores the application of information processing and financial tools in the decision-making process, determining a critical path with a network diagram.
Business decision
making
making
Paraphrase This Document
Need a fresh take? Get an instant paraphrase of this document with our AI Paraphraser
TABLE OF CONTENTS
INTRODUCTION...........................................................................................................................1
Task 1...............................................................................................................................................1
1.1 Drawing plan for gathering primary data and secondary data..............................................1
1.2 Survey methodology and sampling frame.............................................................................2
1.3 Framing questionnaire for survey.........................................................................................2
Task 2...............................................................................................................................................3
2.1 Briefing the data which has been gathered from the survey for representing values............3
2.2 Brief analysis of the outcome of survey with conclusions...................................................5
Views of question 2: ...................................................................................................................5
Views of question 3:....................................................................................................................5
Views of question 4:....................................................................................................................5
4.3 Interpreting data by using measures of dispersion................................................................5
4.4 Application of quartiles, percentiles and corelation coefficient with respect to framing
useful conclusions.......................................................................................................................5
Task 3...............................................................................................................................................6
3.1 Providing and conclusion of survey with help of spreadsheet..............................................6
3.2 Drawing a graph with trend line which will be representing sales and profit growth..........8
........................................................................................................................................................10
3.4 Drafting a formal report for Retail Times magazines.........................................................10
Task 4.............................................................................................................................................11
4.1 Application of information processing tools in the context of decision making................11
4.2 Determining the critical path with network diagram..........................................................12
4.3 Application of financial tools with respect to decision making process.............................13
CONCLUSION..............................................................................................................................14
REFERENCES..............................................................................................................................15
INTRODUCTION
In the present era each and every company can gain advantage and success with the
perspective of competitive advantage by taking appropriate decisions and must lay special
emphasis on conducting research by using financial tools. The present report is giving brief
understanding on shopping habit of customers preference is changing and primary and secondary
data has been collected for taking decision of retail stores and online preference with its
methodology.
Task 1
1.1 Drawing plan for gathering primary data and secondary data
The present case is about the advancements due to technological and innovations are
creating rise in retail sector to a great level. It can accomplish its goals and success in business
environment which is competitive and it consists of many recent changes or trends.
Aim: To assess the consequences on basis of technological innovation and multichannel
shopping on high street shopping and malls in the context of sales and customer base.
For giving a deep insight on the present issue there is requirement of gathering both
primary and secondary data by researcher in the respective manner:
Primary Data: On the basis of research, information should be collected via survey,
observation, focus group etc. Usually it is collected for accomplishing the specific aim and
objective of research. It provides some suitable and specific information according to the issue
which has to be investigated and it is very highly effectual. To collect information about
shopping habits along with the changes and shopping preferences by customer and motivation
regarding the changes. Survey technique will be used for observing changes in retail sector.
Purposive sampling will be implemented on the 20 managers of high street retail shops and malls
and in the same series after sampling there is requirement of questionnaire which must include
open ended or close ended questions in context of changing aspects of shopping, multi channel
shopping etc. and after this step that prepared questionnaire should be sent to manager who is
referred as sample from the person who all are related to it. Generally each and every primary
data should be prepared on the basis of plan which has been depicted and must be collected from
scholar.
Secondary Data: All the data which has been already analysed, published, gathered and
evaluated by any researcher is known as secondary data. It consists of journals, books and even
1
⊘ This is a preview!⊘
Do you want full access?
Subscribe today to unlock all pages.
Trusted by 1+ million students worldwide
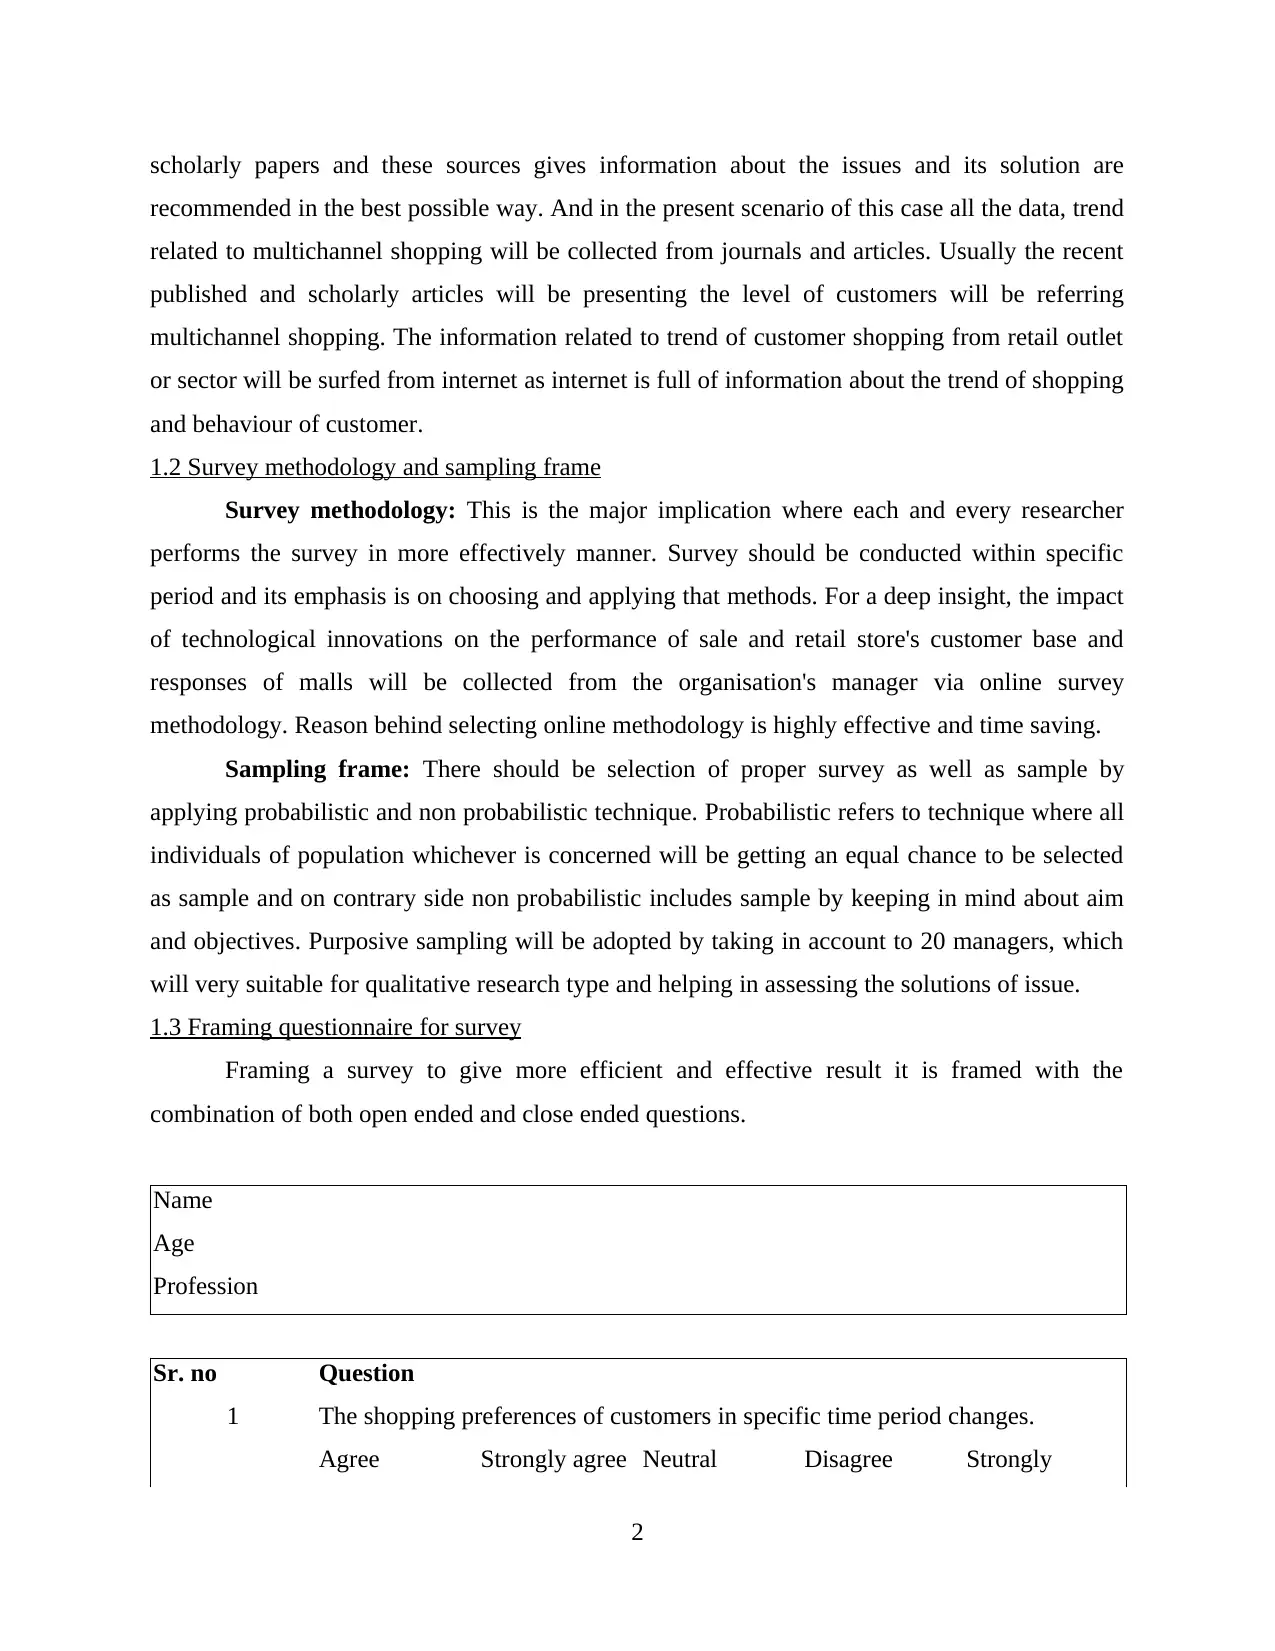
scholarly papers and these sources gives information about the issues and its solution are
recommended in the best possible way. And in the present scenario of this case all the data, trend
related to multichannel shopping will be collected from journals and articles. Usually the recent
published and scholarly articles will be presenting the level of customers will be referring
multichannel shopping. The information related to trend of customer shopping from retail outlet
or sector will be surfed from internet as internet is full of information about the trend of shopping
and behaviour of customer.
1.2 Survey methodology and sampling frame
Survey methodology: This is the major implication where each and every researcher
performs the survey in more effectively manner. Survey should be conducted within specific
period and its emphasis is on choosing and applying that methods. For a deep insight, the impact
of technological innovations on the performance of sale and retail store's customer base and
responses of malls will be collected from the organisation's manager via online survey
methodology. Reason behind selecting online methodology is highly effective and time saving.
Sampling frame: There should be selection of proper survey as well as sample by
applying probabilistic and non probabilistic technique. Probabilistic refers to technique where all
individuals of population whichever is concerned will be getting an equal chance to be selected
as sample and on contrary side non probabilistic includes sample by keeping in mind about aim
and objectives. Purposive sampling will be adopted by taking in account to 20 managers, which
will very suitable for qualitative research type and helping in assessing the solutions of issue.
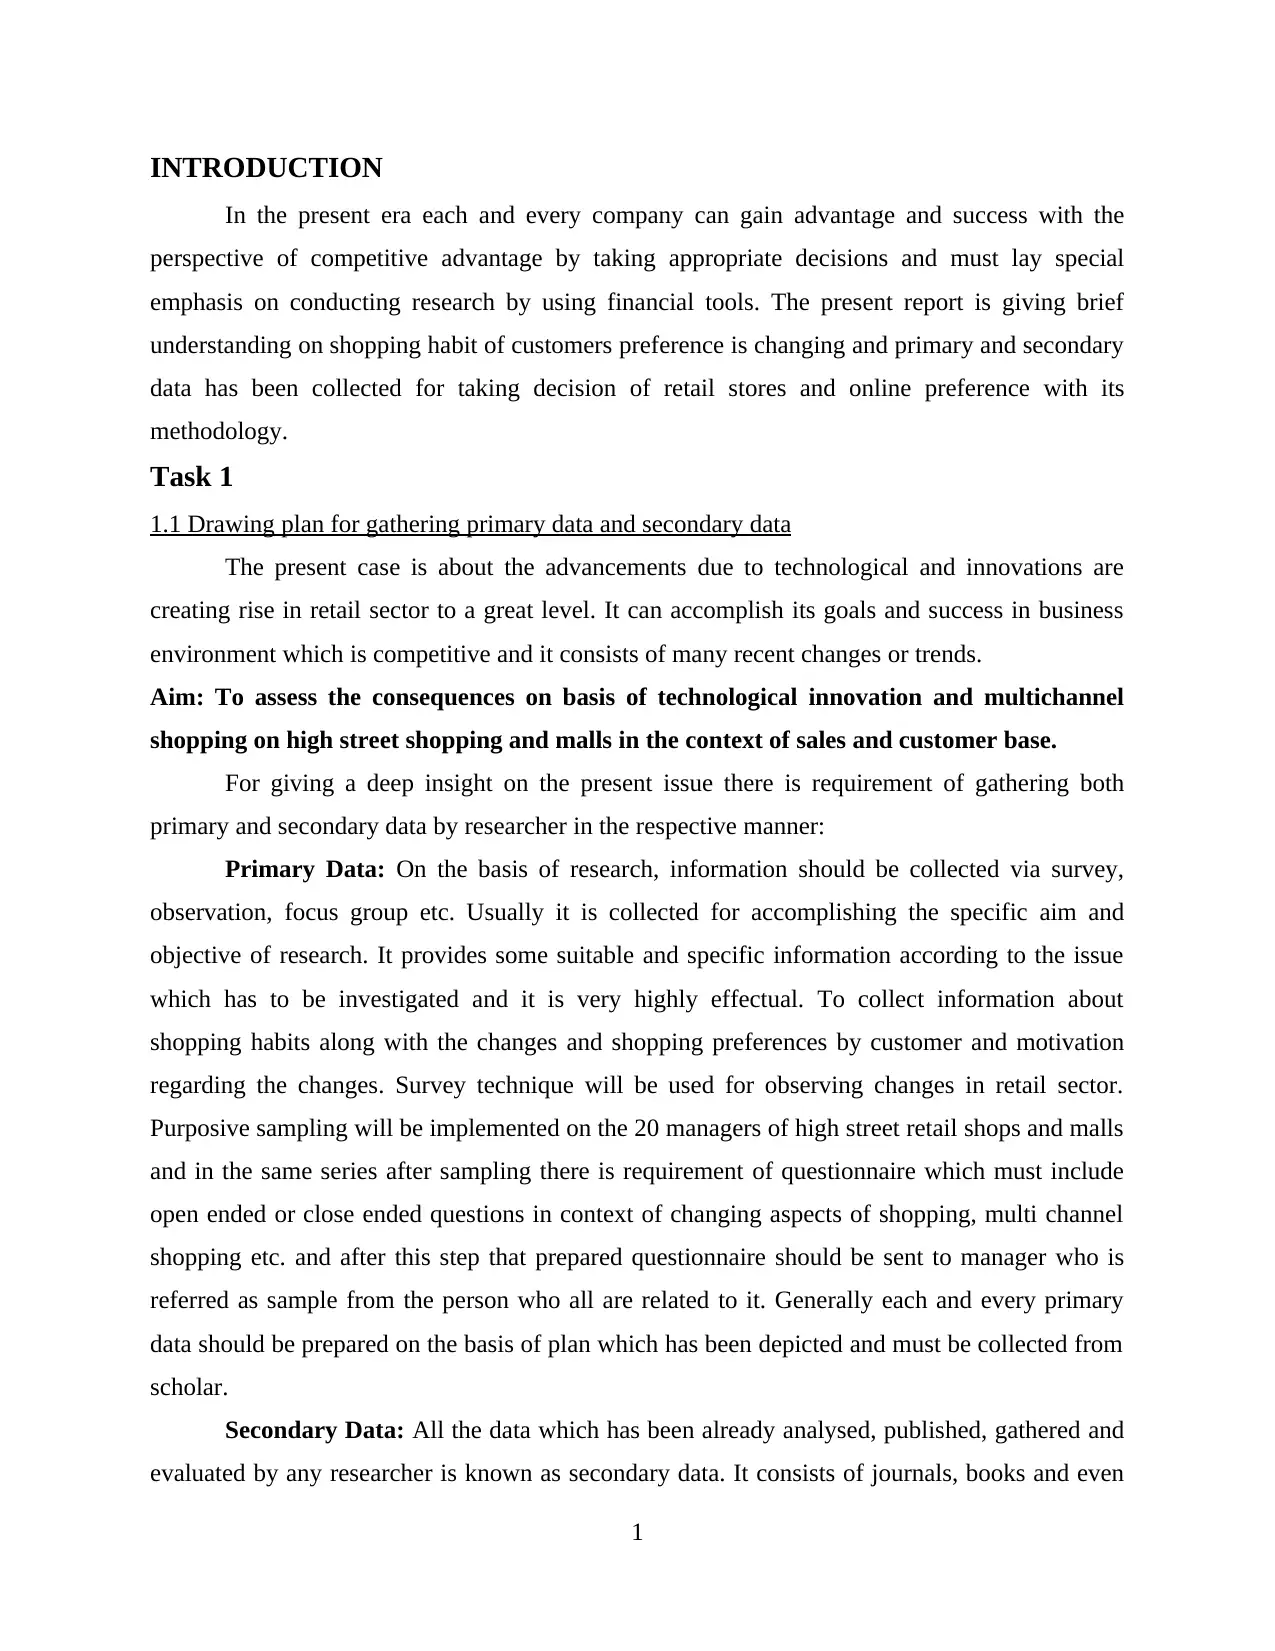
1.3 Framing questionnaire for survey
Framing a survey to give more efficient and effective result it is framed with the
combination of both open ended and close ended questions.
Name
Age
Profession
Sr. no Question
1 The shopping preferences of customers in specific time period changes.
Agree Strongly agree Neutral Disagree Strongly
2
recommended in the best possible way. And in the present scenario of this case all the data, trend
related to multichannel shopping will be collected from journals and articles. Usually the recent
published and scholarly articles will be presenting the level of customers will be referring
multichannel shopping. The information related to trend of customer shopping from retail outlet
or sector will be surfed from internet as internet is full of information about the trend of shopping
and behaviour of customer.
1.2 Survey methodology and sampling frame
Survey methodology: This is the major implication where each and every researcher
performs the survey in more effectively manner. Survey should be conducted within specific
period and its emphasis is on choosing and applying that methods. For a deep insight, the impact
of technological innovations on the performance of sale and retail store's customer base and
responses of malls will be collected from the organisation's manager via online survey
methodology. Reason behind selecting online methodology is highly effective and time saving.
Sampling frame: There should be selection of proper survey as well as sample by
applying probabilistic and non probabilistic technique. Probabilistic refers to technique where all
individuals of population whichever is concerned will be getting an equal chance to be selected
as sample and on contrary side non probabilistic includes sample by keeping in mind about aim
and objectives. Purposive sampling will be adopted by taking in account to 20 managers, which
will very suitable for qualitative research type and helping in assessing the solutions of issue.
1.3 Framing questionnaire for survey
Framing a survey to give more efficient and effective result it is framed with the
combination of both open ended and close ended questions.
Name
Age
Profession
Sr. no Question
1 The shopping preferences of customers in specific time period changes.
Agree Strongly agree Neutral Disagree Strongly
2
Paraphrase This Document
Need a fresh take? Get an instant paraphrase of this document with our AI Paraphraser
disagree
2
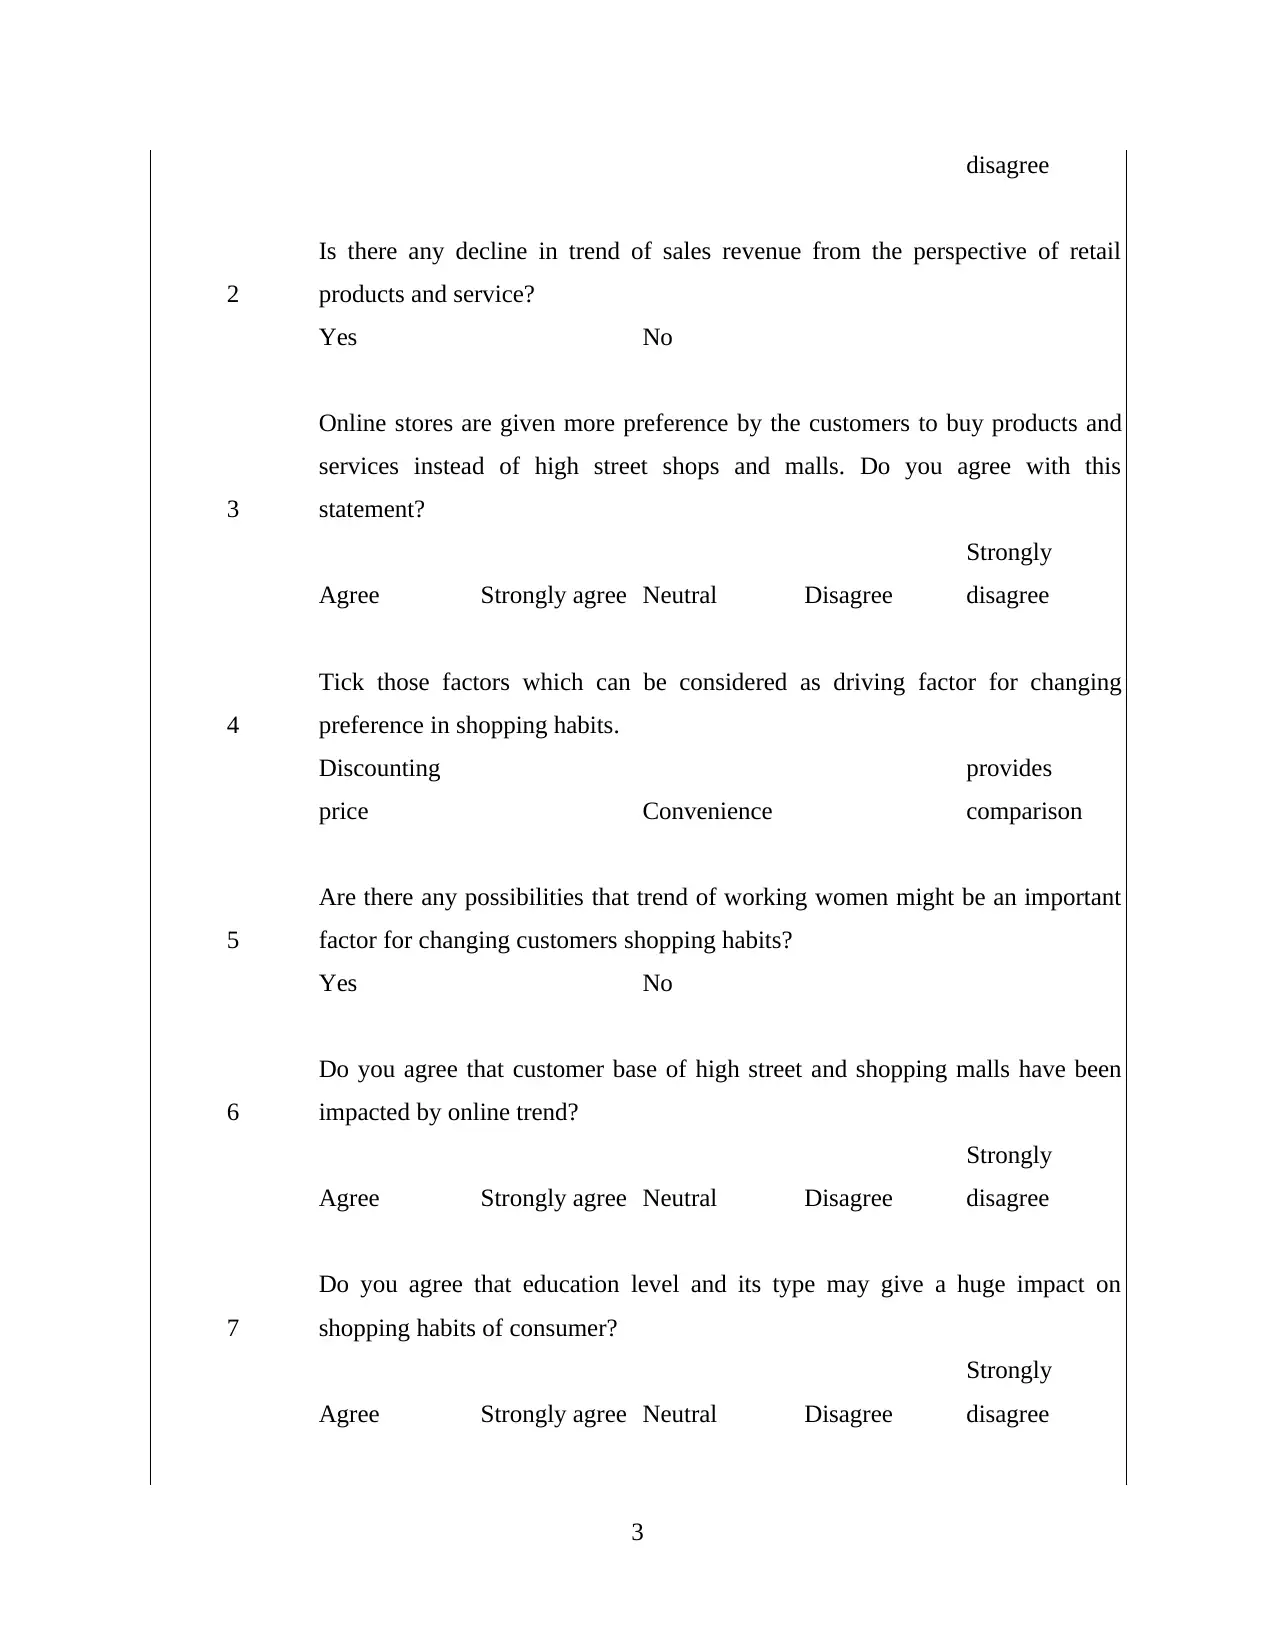
Is there any decline in trend of sales revenue from the perspective of retail
products and service?
Yes No
3
Online stores are given more preference by the customers to buy products and
services instead of high street shops and malls. Do you agree with this
statement?
Agree Strongly agree Neutral Disagree
Strongly
disagree
4
Tick those factors which can be considered as driving factor for changing
preference in shopping habits.
Discounting
price Convenience
provides
comparison
5
Are there any possibilities that trend of working women might be an important
factor for changing customers shopping habits?
Yes No
6
Do you agree that customer base of high street and shopping malls have been
impacted by online trend?
Agree Strongly agree Neutral Disagree
Strongly
disagree
7
Do you agree that education level and its type may give a huge impact on
shopping habits of consumer?
Agree Strongly agree Neutral Disagree
Strongly
disagree
3
2
Is there any decline in trend of sales revenue from the perspective of retail
products and service?
Yes No
3
Online stores are given more preference by the customers to buy products and
services instead of high street shops and malls. Do you agree with this
statement?
Agree Strongly agree Neutral Disagree
Strongly
disagree
4
Tick those factors which can be considered as driving factor for changing
preference in shopping habits.
Discounting
price Convenience
provides
comparison
5
Are there any possibilities that trend of working women might be an important
factor for changing customers shopping habits?
Yes No
6
Do you agree that customer base of high street and shopping malls have been
impacted by online trend?
Agree Strongly agree Neutral Disagree
Strongly
disagree
7
Do you agree that education level and its type may give a huge impact on
shopping habits of consumer?
Agree Strongly agree Neutral Disagree
Strongly
disagree
3
8
Suggest some ways by which high street shops and malls should e able to
increase sale performance and customer base?
Task 2
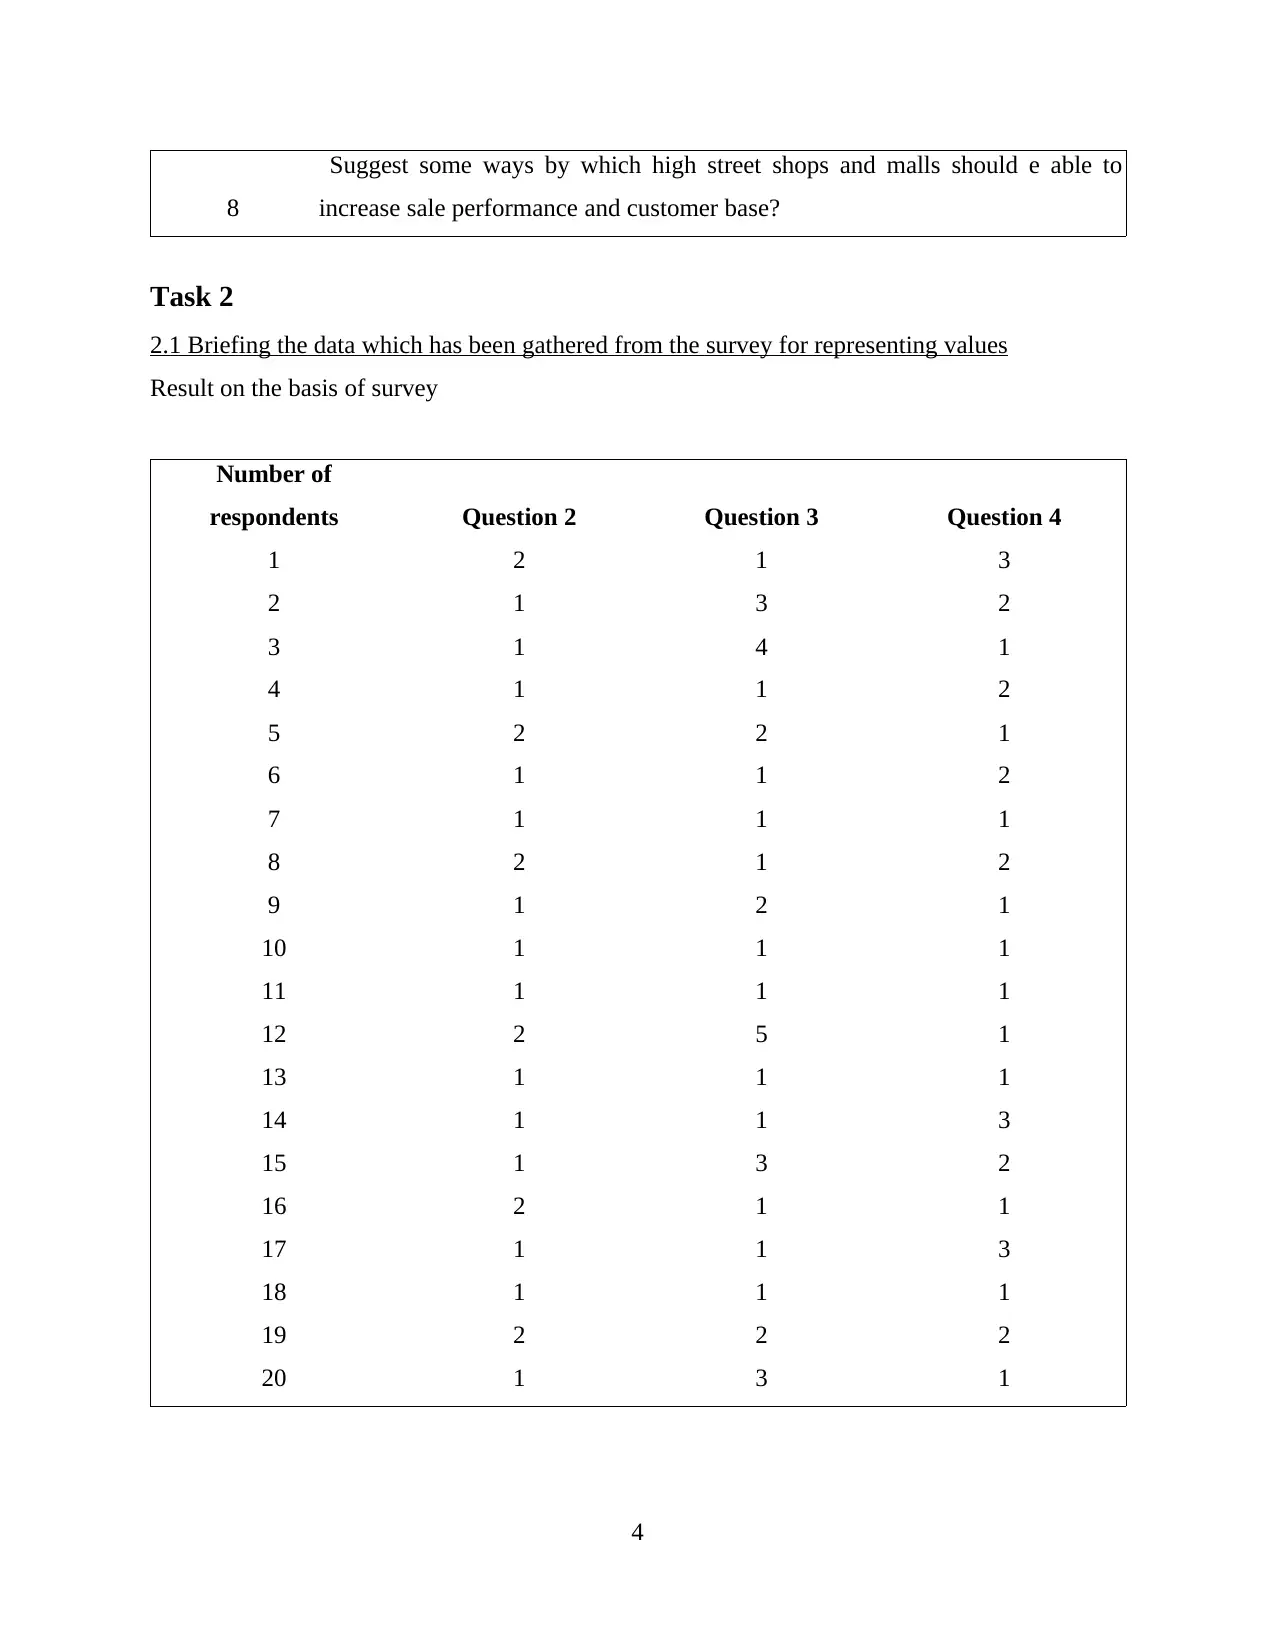
2.1 Briefing the data which has been gathered from the survey for representing values
Result on the basis of survey
Number of
respondents Question 2 Question 3 Question 4
1 2 1 3
2 1 3 2
3 1 4 1
4 1 1 2
5 2 2 1
6 1 1 2
7 1 1 1
8 2 1 2
9 1 2 1
10 1 1 1
11 1 1 1
12 2 5 1
13 1 1 1
14 1 1 3
15 1 3 2
16 2 1 1
17 1 1 3
18 1 1 1
19 2 2 2
20 1 3 1
4
Suggest some ways by which high street shops and malls should e able to
increase sale performance and customer base?
Task 2
2.1 Briefing the data which has been gathered from the survey for representing values
Result on the basis of survey
Number of
respondents Question 2 Question 3 Question 4
1 2 1 3
2 1 3 2
3 1 4 1
4 1 1 2
5 2 2 1
6 1 1 2
7 1 1 1
8 2 1 2
9 1 2 1
10 1 1 1
11 1 1 1
12 2 5 1
13 1 1 1
14 1 1 3
15 1 3 2
16 2 1 1
17 1 1 3
18 1 1 1
19 2 2 2
20 1 3 1
4
⊘ This is a preview!⊘
Do you want full access?
Subscribe today to unlock all pages.
Trusted by 1+ million students worldwide
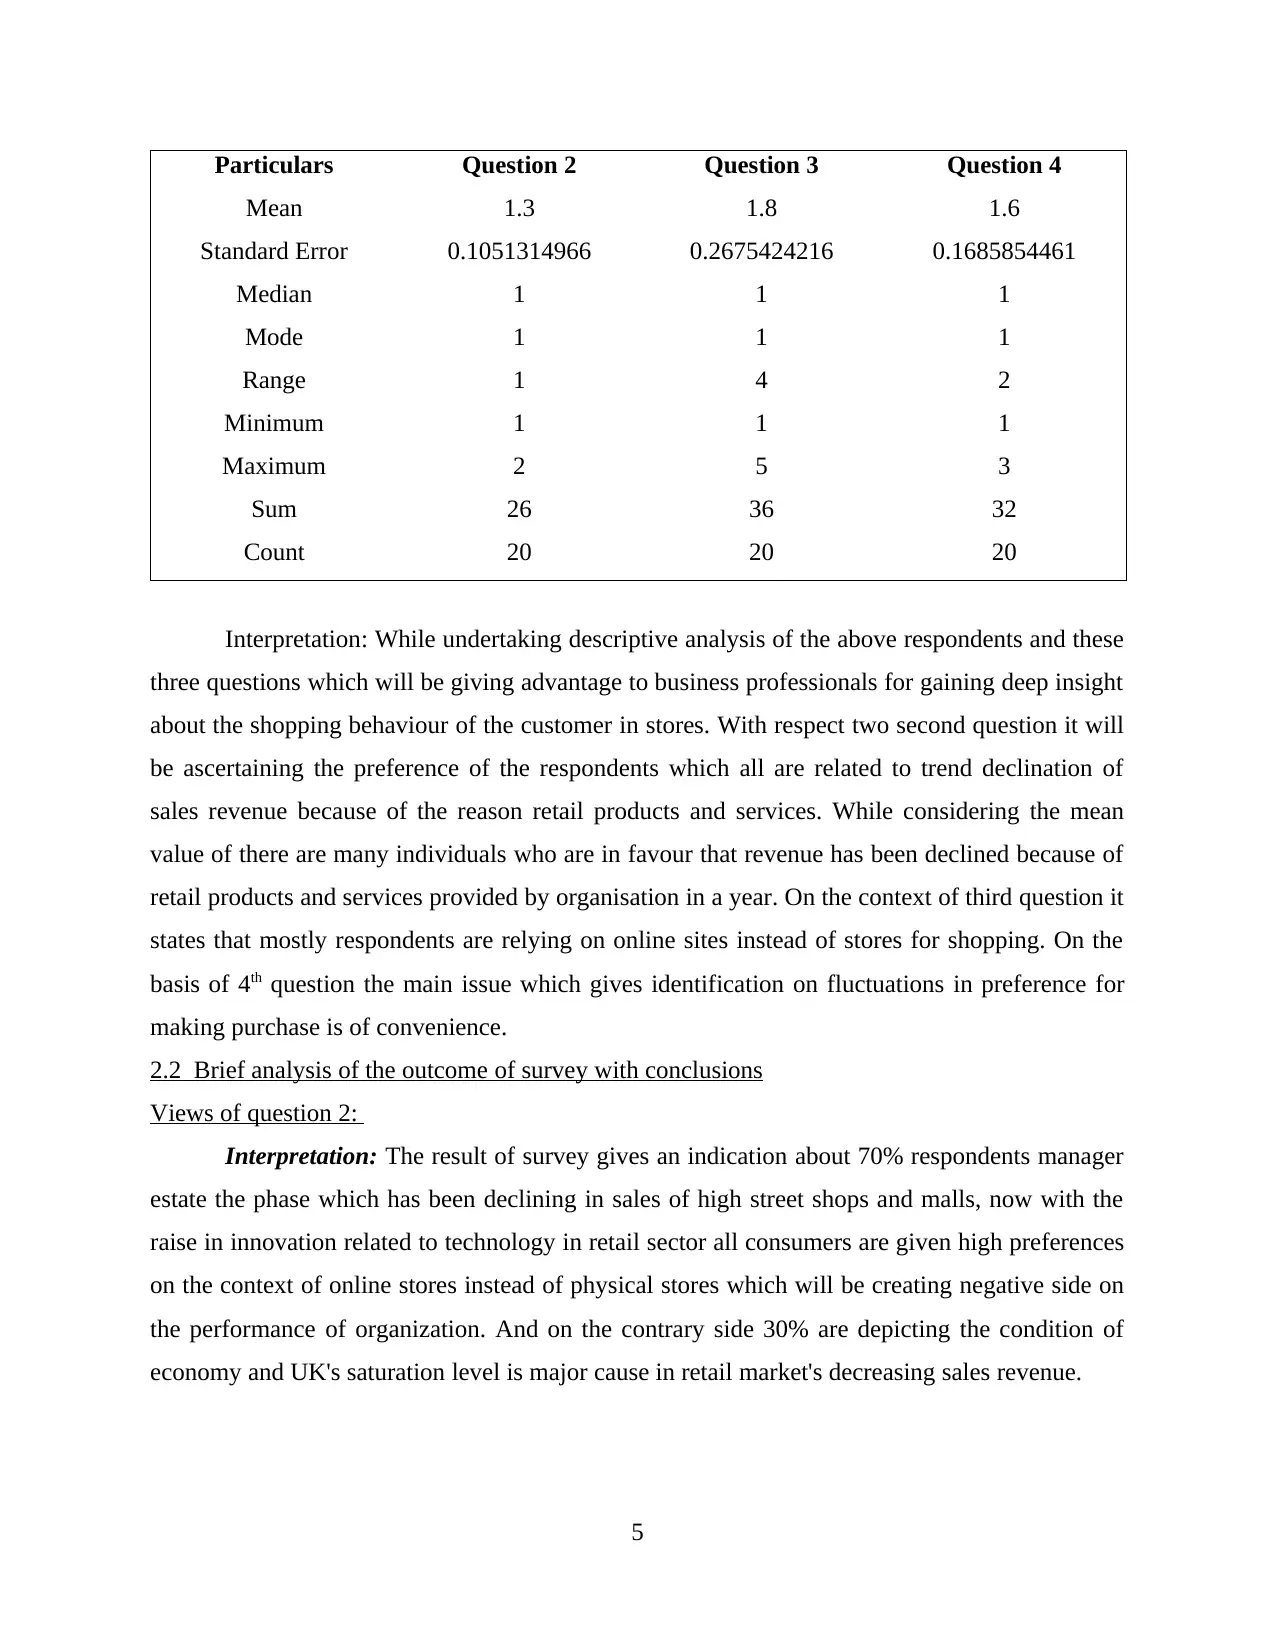
Particulars Question 2 Question 3 Question 4
Mean 1.3 1.8 1.6
Standard Error 0.1051314966 0.2675424216 0.1685854461
Median 1 1 1
Mode 1 1 1
Range 1 4 2
Minimum 1 1 1
Maximum 2 5 3
Sum 26 36 32
Count 20 20 20
Interpretation: While undertaking descriptive analysis of the above respondents and these
three questions which will be giving advantage to business professionals for gaining deep insight
about the shopping behaviour of the customer in stores. With respect two second question it will
be ascertaining the preference of the respondents which all are related to trend declination of
sales revenue because of the reason retail products and services. While considering the mean
value of there are many individuals who are in favour that revenue has been declined because of
retail products and services provided by organisation in a year. On the context of third question it
states that mostly respondents are relying on online sites instead of stores for shopping. On the
basis of 4th question the main issue which gives identification on fluctuations in preference for
making purchase is of convenience.
2.2 Brief analysis of the outcome of survey with conclusions
Views of question 2:
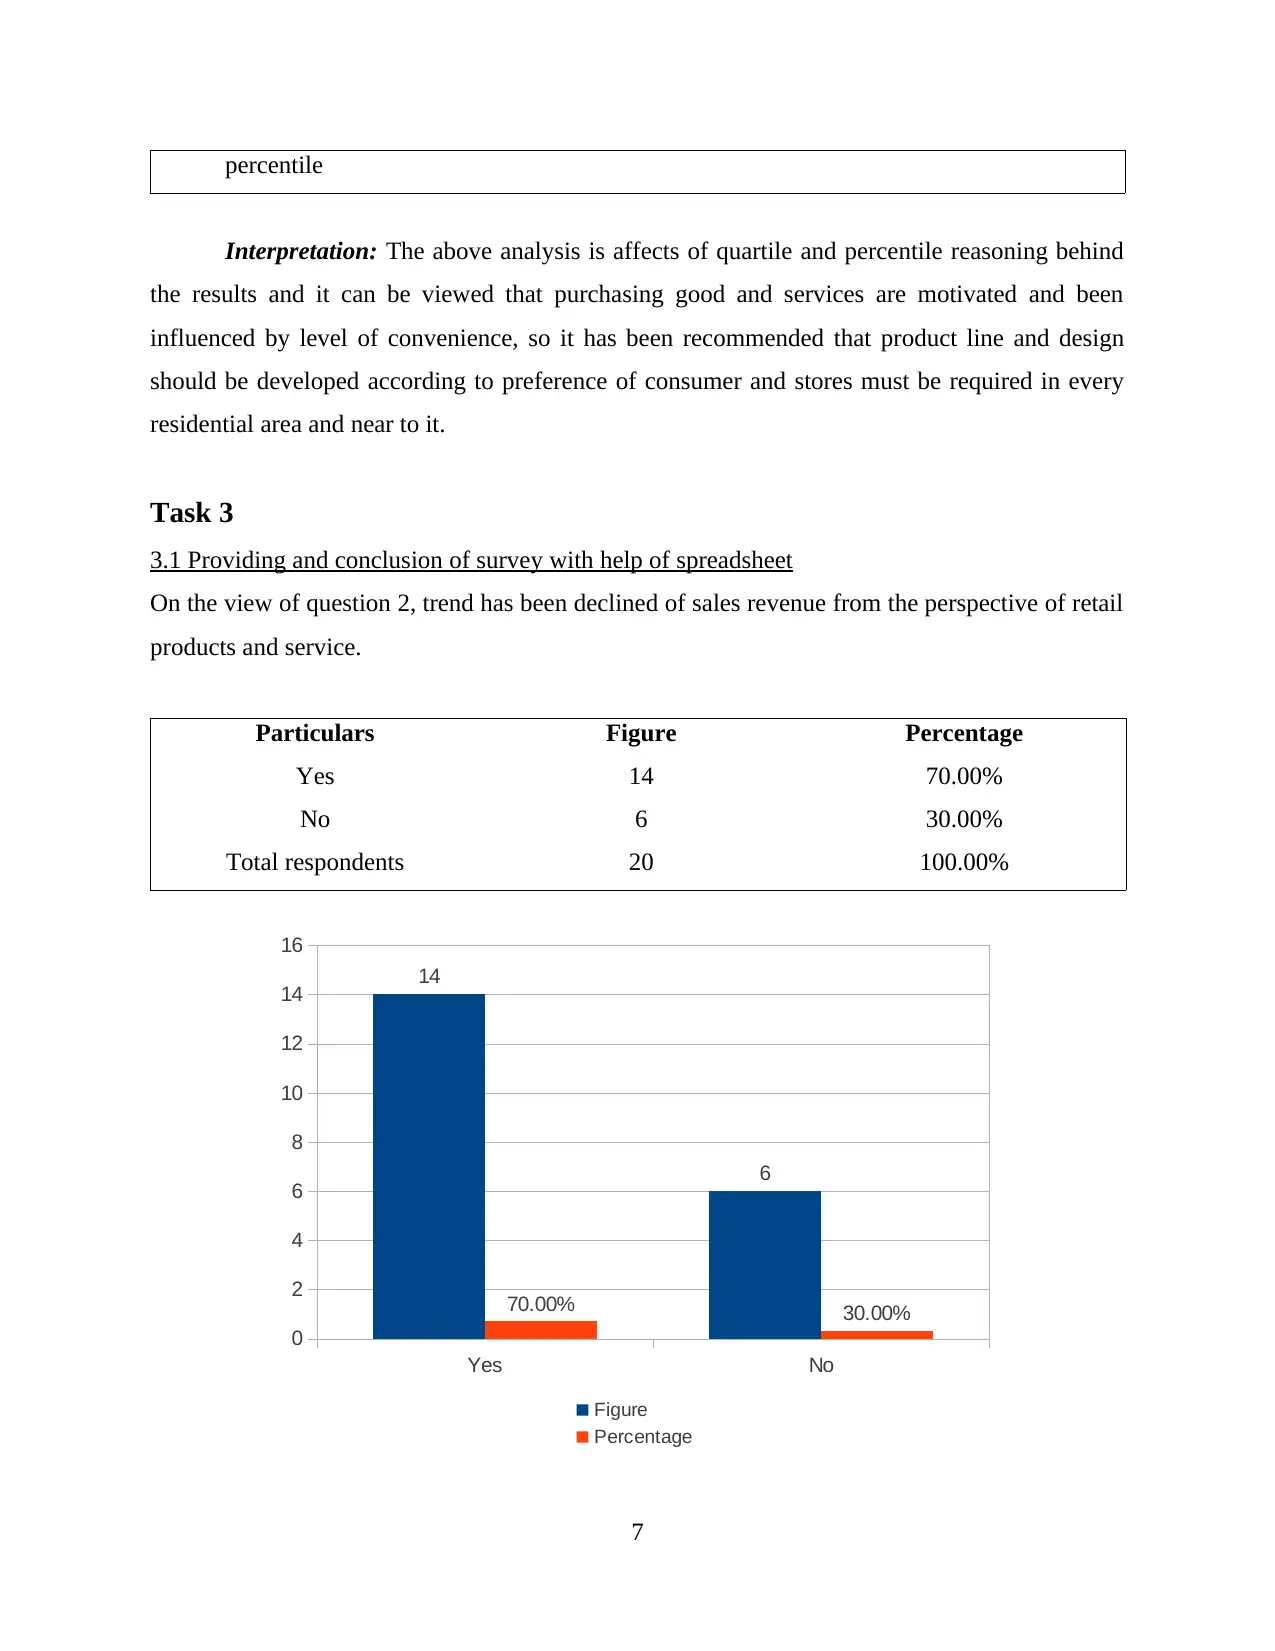
Interpretation: The result of survey gives an indication about 70% respondents manager
estate the phase which has been declining in sales of high street shops and malls, now with the
raise in innovation related to technology in retail sector all consumers are given high preferences
on the context of online stores instead of physical stores which will be creating negative side on
the performance of organization. And on the contrary side 30% are depicting the condition of
economy and UK's saturation level is major cause in retail market's decreasing sales revenue.
5
Mean 1.3 1.8 1.6
Standard Error 0.1051314966 0.2675424216 0.1685854461
Median 1 1 1
Mode 1 1 1
Range 1 4 2
Minimum 1 1 1
Maximum 2 5 3
Sum 26 36 32
Count 20 20 20
Interpretation: While undertaking descriptive analysis of the above respondents and these
three questions which will be giving advantage to business professionals for gaining deep insight
about the shopping behaviour of the customer in stores. With respect two second question it will
be ascertaining the preference of the respondents which all are related to trend declination of
sales revenue because of the reason retail products and services. While considering the mean
value of there are many individuals who are in favour that revenue has been declined because of
retail products and services provided by organisation in a year. On the context of third question it
states that mostly respondents are relying on online sites instead of stores for shopping. On the
basis of 4th question the main issue which gives identification on fluctuations in preference for
making purchase is of convenience.
2.2 Brief analysis of the outcome of survey with conclusions
Views of question 2:
Interpretation: The result of survey gives an indication about 70% respondents manager
estate the phase which has been declining in sales of high street shops and malls, now with the
raise in innovation related to technology in retail sector all consumers are given high preferences
on the context of online stores instead of physical stores which will be creating negative side on
the performance of organization. And on the contrary side 30% are depicting the condition of
economy and UK's saturation level is major cause in retail market's decreasing sales revenue.
5
Paraphrase This Document
Need a fresh take? Get an instant paraphrase of this document with our AI Paraphraser
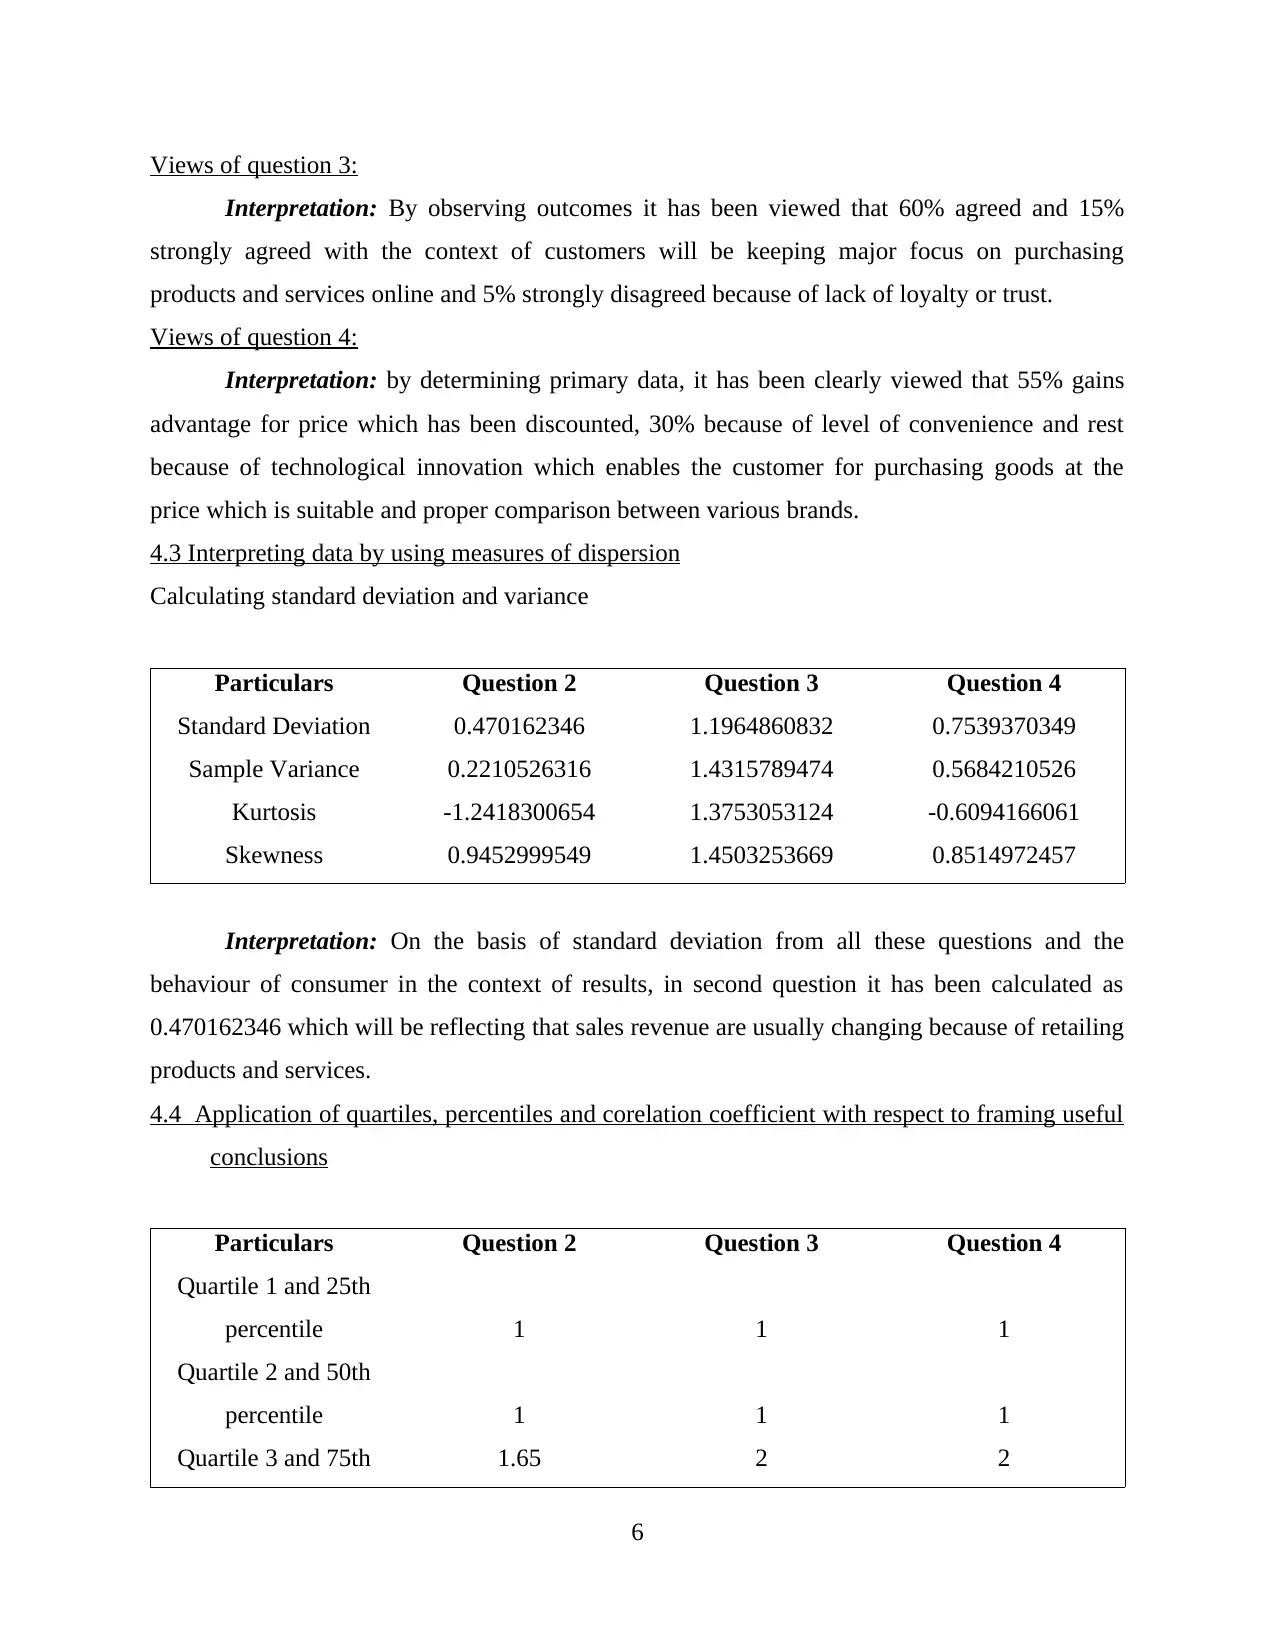
Views of question 3:
Interpretation: By observing outcomes it has been viewed that 60% agreed and 15%
strongly agreed with the context of customers will be keeping major focus on purchasing
products and services online and 5% strongly disagreed because of lack of loyalty or trust.
Views of question 4:
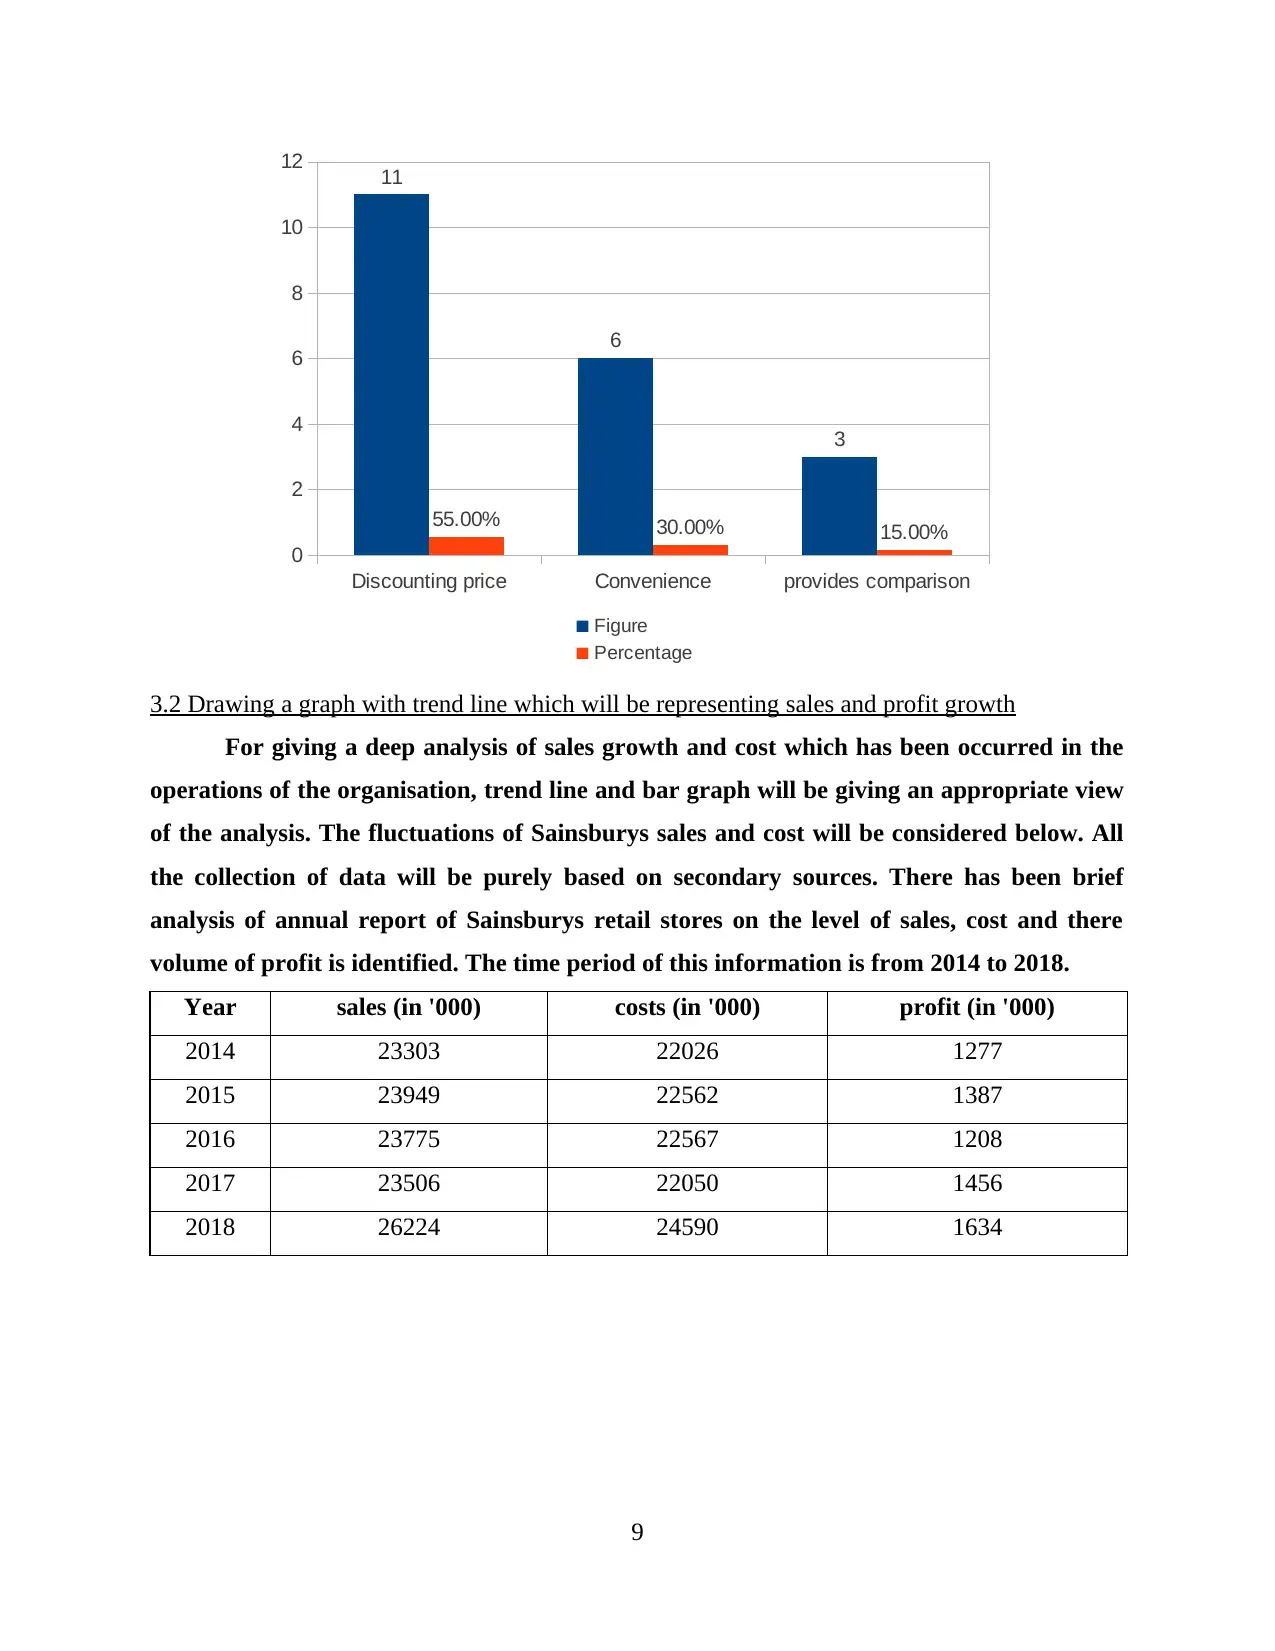
Interpretation: by determining primary data, it has been clearly viewed that 55% gains
advantage for price which has been discounted, 30% because of level of convenience and rest
because of technological innovation which enables the customer for purchasing goods at the
price which is suitable and proper comparison between various brands.
4.3 Interpreting data by using measures of dispersion
Calculating standard deviation and variance
Particulars Question 2 Question 3 Question 4
Standard Deviation 0.470162346 1.1964860832 0.7539370349
Sample Variance 0.2210526316 1.4315789474 0.5684210526
Kurtosis -1.2418300654 1.3753053124 -0.6094166061
Skewness 0.9452999549 1.4503253669 0.8514972457
Interpretation: On the basis of standard deviation from all these questions and the
behaviour of consumer in the context of results, in second question it has been calculated as
0.470162346 which will be reflecting that sales revenue are usually changing because of retailing
products and services.
4.4 Application of quartiles, percentiles and corelation coefficient with respect to framing useful
conclusions
Particulars Question 2 Question 3 Question 4
Quartile 1 and 25th
percentile 1 1 1
Quartile 2 and 50th
percentile 1 1 1
Quartile 3 and 75th 1.65 2 2
6
Interpretation: By observing outcomes it has been viewed that 60% agreed and 15%
strongly agreed with the context of customers will be keeping major focus on purchasing
products and services online and 5% strongly disagreed because of lack of loyalty or trust.
Views of question 4:
Interpretation: by determining primary data, it has been clearly viewed that 55% gains
advantage for price which has been discounted, 30% because of level of convenience and rest
because of technological innovation which enables the customer for purchasing goods at the
price which is suitable and proper comparison between various brands.
4.3 Interpreting data by using measures of dispersion
Calculating standard deviation and variance
Particulars Question 2 Question 3 Question 4
Standard Deviation 0.470162346 1.1964860832 0.7539370349
Sample Variance 0.2210526316 1.4315789474 0.5684210526
Kurtosis -1.2418300654 1.3753053124 -0.6094166061
Skewness 0.9452999549 1.4503253669 0.8514972457
Interpretation: On the basis of standard deviation from all these questions and the
behaviour of consumer in the context of results, in second question it has been calculated as
0.470162346 which will be reflecting that sales revenue are usually changing because of retailing
products and services.
4.4 Application of quartiles, percentiles and corelation coefficient with respect to framing useful
conclusions
Particulars Question 2 Question 3 Question 4
Quartile 1 and 25th
percentile 1 1 1
Quartile 2 and 50th
percentile 1 1 1
Quartile 3 and 75th 1.65 2 2
6
percentile
Interpretation: The above analysis is affects of quartile and percentile reasoning behind
the results and it can be viewed that purchasing good and services are motivated and been
influenced by level of convenience, so it has been recommended that product line and design
should be developed according to preference of consumer and stores must be required in every
residential area and near to it.
Task 3
3.1 Providing and conclusion of survey with help of spreadsheet
On the view of question 2, trend has been declined of sales revenue from the perspective of retail
products and service.
Particulars Figure Percentage
Yes 14 70.00%
No 6 30.00%
Total respondents 20 100.00%
Yes No
0
2
4
6
8
10
12
14
16
14
6
70.00% 30.00%
Figure
Percentage
7
⊘ This is a preview!⊘
Do you want full access?
Subscribe today to unlock all pages.
Trusted by 1+ million students worldwide
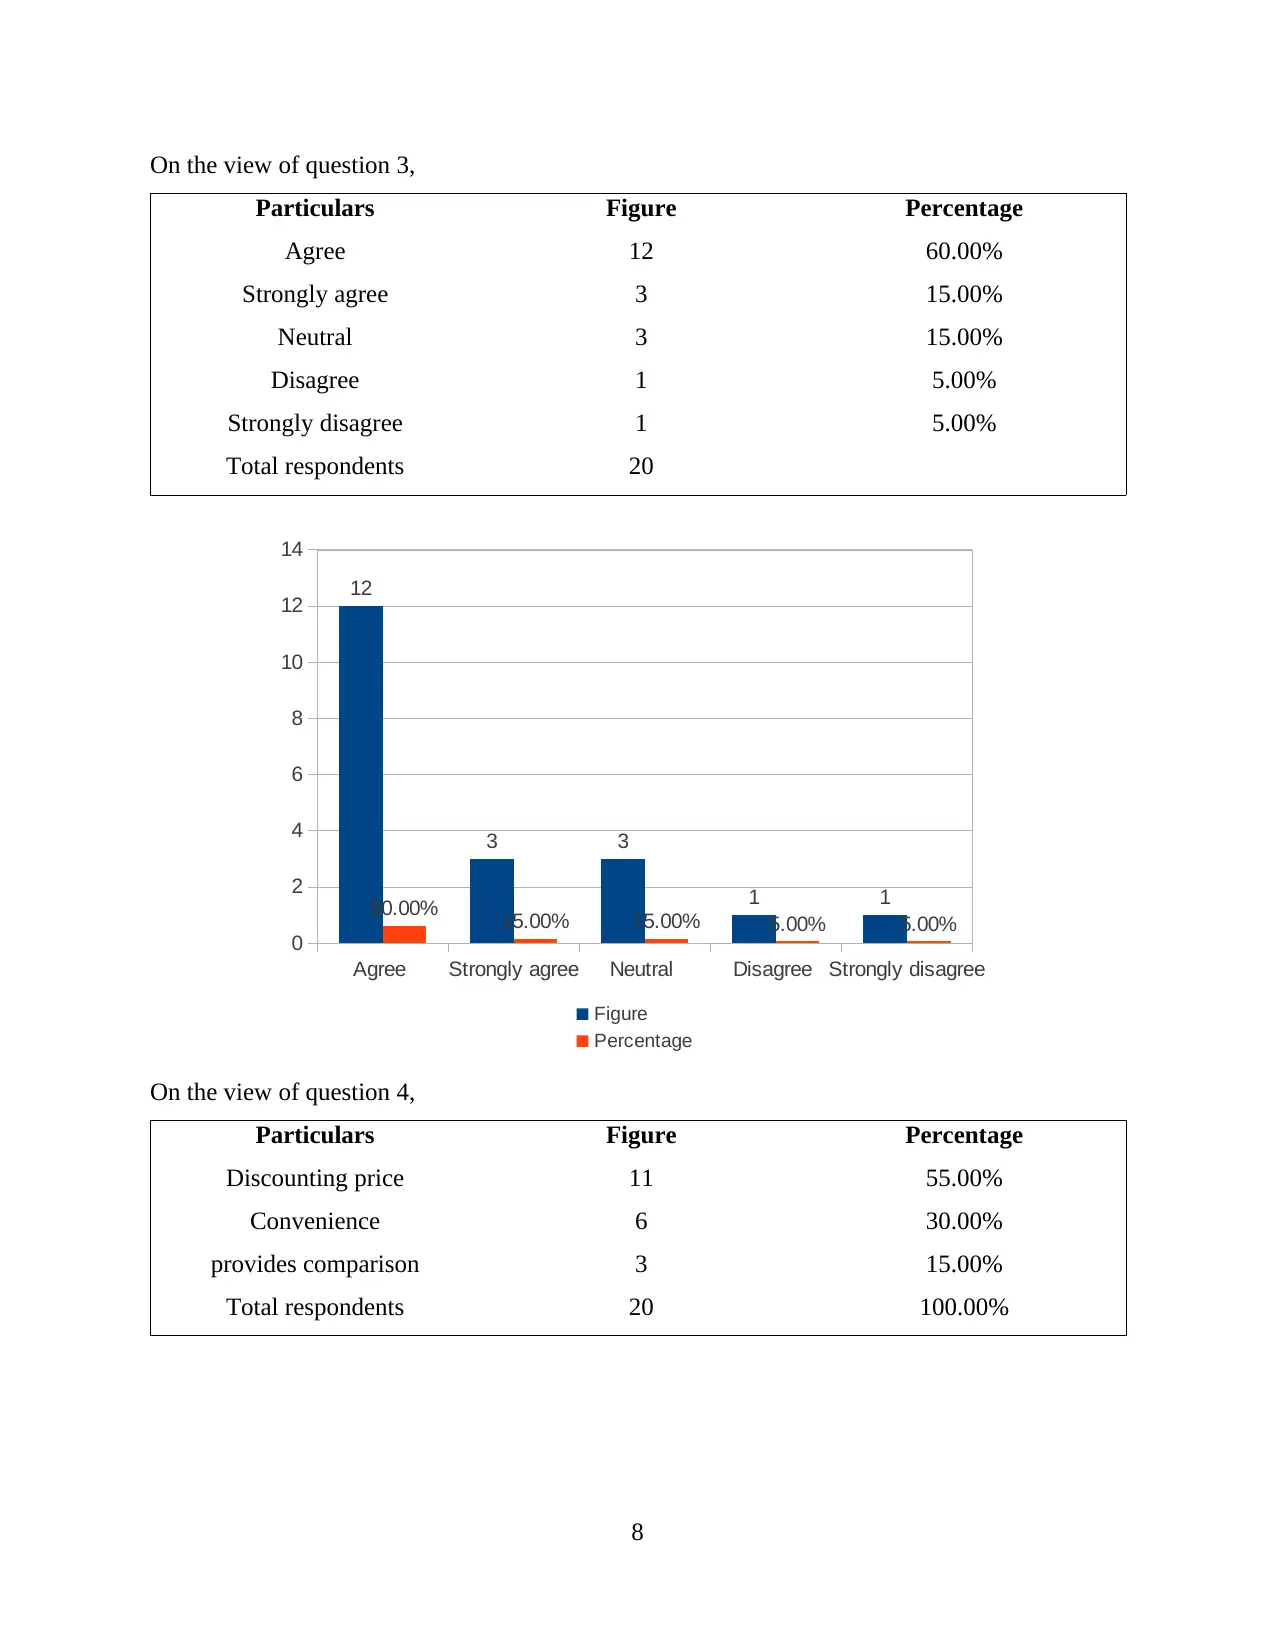
On the view of question 3,
Particulars Figure Percentage
Agree 12 60.00%
Strongly agree 3 15.00%
Neutral 3 15.00%
Disagree 1 5.00%
Strongly disagree 1 5.00%
Total respondents 20
Agree Strongly agree Neutral Disagree Strongly disagree
0
2
4
6
8
10
12
14
12
3 3
1 1
60.00% 15.00% 15.00% 5.00% 5.00%
Figure
Percentage
On the view of question 4,
Particulars Figure Percentage
Discounting price 11 55.00%
Convenience 6 30.00%
provides comparison 3 15.00%
Total respondents 20 100.00%
8
Particulars Figure Percentage
Agree 12 60.00%
Strongly agree 3 15.00%
Neutral 3 15.00%
Disagree 1 5.00%
Strongly disagree 1 5.00%
Total respondents 20
Agree Strongly agree Neutral Disagree Strongly disagree
0
2
4
6
8
10
12
14
12
3 3
1 1
60.00% 15.00% 15.00% 5.00% 5.00%
Figure
Percentage
On the view of question 4,
Particulars Figure Percentage
Discounting price 11 55.00%
Convenience 6 30.00%
provides comparison 3 15.00%
Total respondents 20 100.00%
8
Paraphrase This Document
Need a fresh take? Get an instant paraphrase of this document with our AI Paraphraser
Discounting price Convenience provides comparison
0
2
4
6
8
10
12 11
6
3
55.00% 30.00% 15.00%
Figure
Percentage
3.2 Drawing a graph with trend line which will be representing sales and profit growth
For giving a deep analysis of sales growth and cost which has been occurred in the
operations of the organisation, trend line and bar graph will be giving an appropriate view
of the analysis. The fluctuations of Sainsburys sales and cost will be considered below. All
the collection of data will be purely based on secondary sources. There has been brief
analysis of annual report of Sainsburys retail stores on the level of sales, cost and there
volume of profit is identified. The time period of this information is from 2014 to 2018.
Year sales (in '000) costs (in '000) profit (in '000)
2014 23303 22026 1277
2015 23949 22562 1387
2016 23775 22567 1208
2017 23506 22050 1456
2018 26224 24590 1634
9
2014 2015 2016 2017 2018
21500
22000
22500
23000
23500
24000
24500
25000
25500
26000
26500
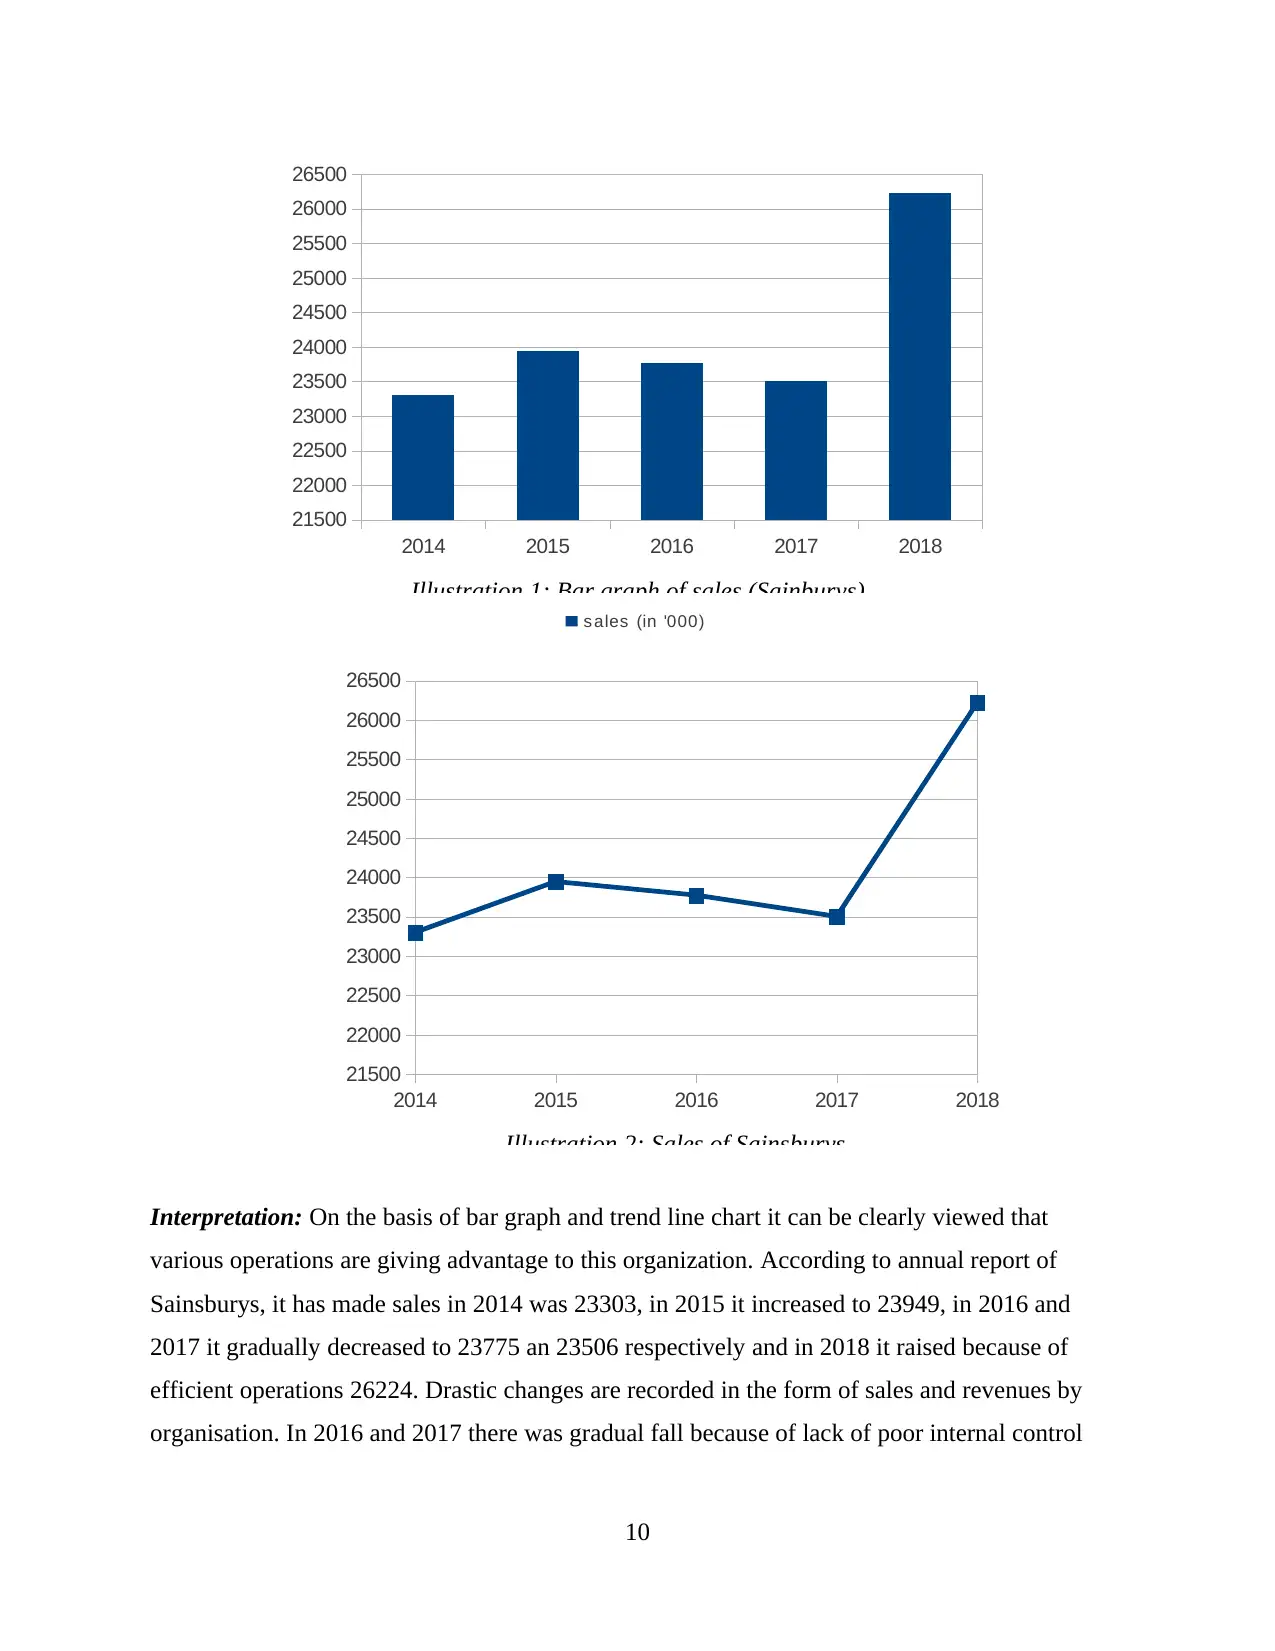
Illustration 1: Bar graph of sales (Sainburys)
s ales (in '000)
2014 2015 2016 2017 2018
21500
22000
22500
23000
23500
24000
24500
25000
25500
26000
26500
Illustration 2: Sales of Sainsburys
Interpretation: On the basis of bar graph and trend line chart it can be clearly viewed that
various operations are giving advantage to this organization. According to annual report of
Sainsburys, it has made sales in 2014 was 23303, in 2015 it increased to 23949, in 2016 and
2017 it gradually decreased to 23775 an 23506 respectively and in 2018 it raised because of
efficient operations 26224. Drastic changes are recorded in the form of sales and revenues by
organisation. In 2016 and 2017 there was gradual fall because of lack of poor internal control
10
21500
22000
22500
23000
23500
24000
24500
25000
25500
26000
26500
Illustration 1: Bar graph of sales (Sainburys)
s ales (in '000)
2014 2015 2016 2017 2018
21500
22000
22500
23000
23500
24000
24500
25000
25500
26000
26500
Illustration 2: Sales of Sainsburys
Interpretation: On the basis of bar graph and trend line chart it can be clearly viewed that
various operations are giving advantage to this organization. According to annual report of
Sainsburys, it has made sales in 2014 was 23303, in 2015 it increased to 23949, in 2016 and
2017 it gradually decreased to 23775 an 23506 respectively and in 2018 it raised because of
efficient operations 26224. Drastic changes are recorded in the form of sales and revenues by
organisation. In 2016 and 2017 there was gradual fall because of lack of poor internal control
10
⊘ This is a preview!⊘
Do you want full access?
Subscribe today to unlock all pages.
Trusted by 1+ million students worldwide
1 out of 19
Related Documents


Your All-in-One AI-Powered Toolkit for Academic Success.
+13062052269
info@desklib.com
Available 24*7 on WhatsApp / Email
![[object Object]](/_next/static/media/star-bottom.7253800d.svg)
Unlock your academic potential
Copyright © 2020–2026 A2Z Services. All Rights Reserved. Developed and managed by ZUCOL.