Business Decision Making Report: Food for Friends Restaurant Expansion
VerifiedAdded on 2021/01/01
|21
|3817
|419
Report
AI Summary
This report focuses on the potential expansion of a restaurant chain, Food for Friends, in London. It begins with an introduction to business decision-making and its importance for long-term growth. The report details the collection of primary and secondary data, including survey methodologies and questionnaire design. It then summarizes data using representative values, analyzes results, and explores measures of dispersion. The report includes graphical representations and trendline charts to visualize data. Furthermore, it covers the implementation of information systems, network diagrams, and financial tools for decision-making. The analysis uses statistical tools such as mean, median, mode, and standard deviation to assess sales and net profits. The report aims to provide a framework for making informed decisions about the restaurant's expansion strategy, considering customer preferences, market trends, and financial performance. The report concludes with recommendations based on the data analysis and findings. This report is a comprehensive guide for any business looking to expand its operations.
Decision Making
Paraphrase This Document
Need a fresh take? Get an instant paraphrase of this document with our AI Paraphraser
Contents
INTRODUCTION...........................................................................................................................1
TASK 1............................................................................................................................................1
1.1 Create a plan for the collection of primary and secondary data:......................................1
1.2 Presenting survey methodology and sample framing.......................................................2
1.3 Design of Questionnaire...................................................................................................3
TASK 2............................................................................................................................................4
2.1 Create information for making decision by summarising data using representative value4
2.2 Analysing the results........................................................................................................7
2.3 Analysis of measures of dispersion..................................................................................9
2.4 Explain the quartile, percentiles, and coefficient correlation...........................................9
TASK 3..........................................................................................................................................10
3.1 Graphs:...........................................................................................................................10
3.2 Trendline chart:..............................................................................................................14
3.3 Covered in PPT:.............................................................................................................15
3.4 Formal Report:................................................................................................................16
TASK 4..........................................................................................................................................17
4.1 Implementing of the information methods system in the decision- making:.................17
4.2 Network diagram............................................................................................................17
4.3 Financial tools for decision making:..............................................................................19
CONCLUSION..............................................................................................................................19
REFERENCES..............................................................................................................................20
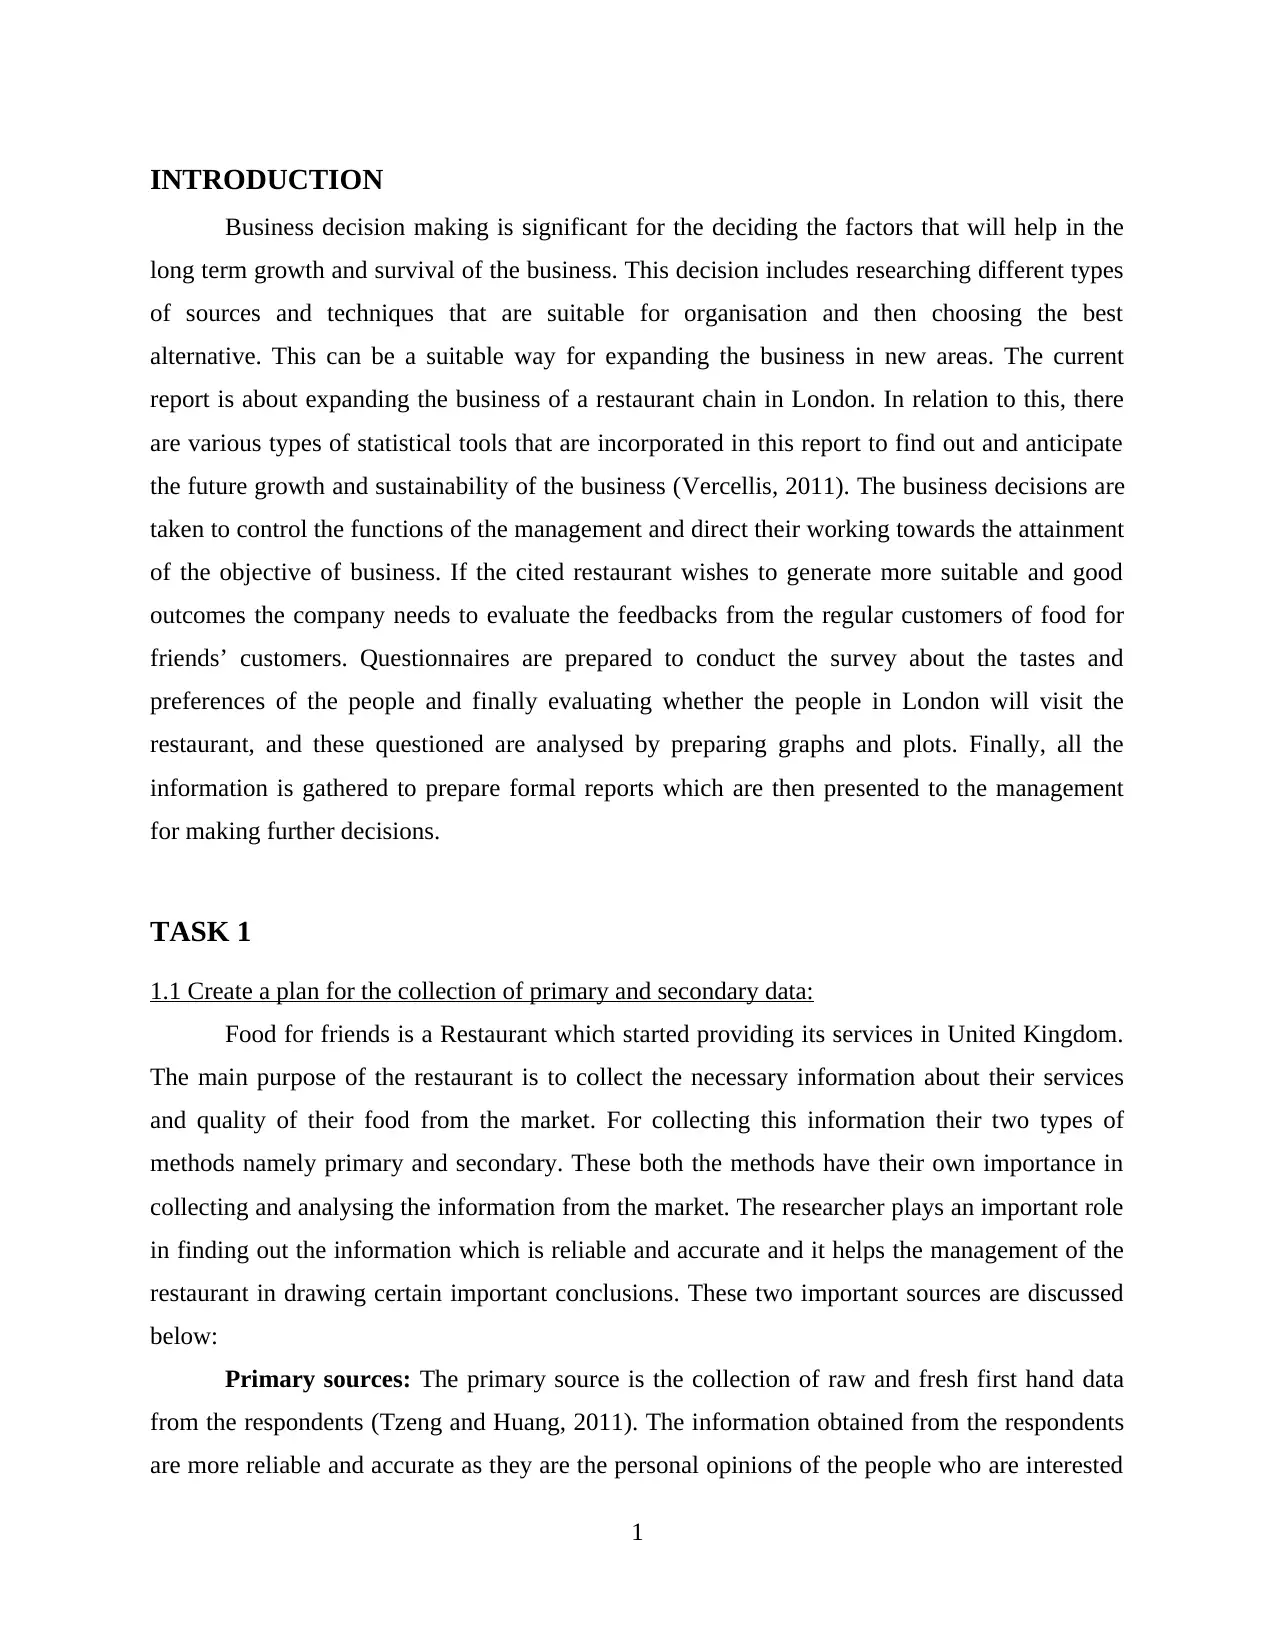
INTRODUCTION
Business decision making is significant for the deciding the factors that will help in the
long term growth and survival of the business. This decision includes researching different types
of sources and techniques that are suitable for organisation and then choosing the best
alternative. This can be a suitable way for expanding the business in new areas. The current
report is about expanding the business of a restaurant chain in London. In relation to this, there
are various types of statistical tools that are incorporated in this report to find out and anticipate
the future growth and sustainability of the business (Vercellis, 2011). The business decisions are
taken to control the functions of the management and direct their working towards the attainment
of the objective of business. If the cited restaurant wishes to generate more suitable and good
outcomes the company needs to evaluate the feedbacks from the regular customers of food for
friends’ customers. Questionnaires are prepared to conduct the survey about the tastes and
preferences of the people and finally evaluating whether the people in London will visit the
restaurant, and these questioned are analysed by preparing graphs and plots. Finally, all the
information is gathered to prepare formal reports which are then presented to the management
for making further decisions.
TASK 1
1.1 Create a plan for the collection of primary and secondary data:
Food for friends is a Restaurant which started providing its services in United Kingdom.
The main purpose of the restaurant is to collect the necessary information about their services
and quality of their food from the market. For collecting this information their two types of
methods namely primary and secondary. These both the methods have their own importance in
collecting and analysing the information from the market. The researcher plays an important role
in finding out the information which is reliable and accurate and it helps the management of the
restaurant in drawing certain important conclusions. These two important sources are discussed
below:
Primary sources: The primary source is the collection of raw and fresh first hand data
from the respondents (Tzeng and Huang, 2011). The information obtained from the respondents
are more reliable and accurate as they are the personal opinions of the people who are interested
1
⊘ This is a preview!⊘
Do you want full access?
Subscribe today to unlock all pages.
Trusted by 1+ million students worldwide
in the business. They give the actual view of the business and provide honest feedbacks. The
primary source of data collection is through questionnaires conducted online on social sites,
restaurant's own site and getting in house feedbacks from the customers after providing them
services. The various primary resources are discussed below:
Survey: In this method the researcher chooses the various number of random respondents
that comes to the restaurant on a regular basis and a series of questions are asked from
each of them to come at a certain decision.
Questionnaire: This method uses a number of questions that are prepared by the
management that are necessary to conduct a particular research. The prepared
questionnaire is uploaded on social sites and restaurant's own site etc.
Secondary sources: This source of collection of information uses published data such as
magazines (industry related), newspapers, articles and food bloggers and it uses past information
also. This source provides second hand information and does not play as much importance as the
primary source.
1.2 Presenting survey methodology and sample framing
Surveys are conducted with main aim of assembling of data from the various respondents
to gather the important information which is required to come at a solution and in the business
decision making process (Tufféry, 2011). For this purpose, it is necessary to conduct the research
in an effective manner by using the primary and secondary sources of data collection. These
sources help in coming at a particular decision regarding the problem and helps in getting
feedbacks about the solutions that are used and finding out whether it was effective or not, so
that they carry out changes for satisfying their different criteria.
Survey methodologies: The survey methodologies is the process of conducting surveys
by food for friend to gather the views of the respondents regarding the services that are provided
by the restaurant such as food quality, ambience etc. For conducting the researches, the
management of restaurant decides to use the primary source for data collection (Stine and Foster,
2014). Primary source uses questionnaire to conduct the survey from the respondents by framing
the questions that are required for decision making. These surveys are distributed publicly or
published on the social networking sites and then are used to solve the issue involves in food for
friends’ restaurant.
2
Paraphrase This Document
Need a fresh take? Get an instant paraphrase of this document with our AI Paraphraser
Sample Framing: This process of research uses the sample data from the given
population. In Sample framing, various techniques are used such as random sampling, stratified
sampling, cluster sampling by the researcher. These methods are used by the researcher in the
selection of the sample from a given population because it is impossible to conduct a survey on
entire population.
The research analyst of food for friends have decided to select random sampling method to select
samples from the population for conducting the research because it is the most effective and
easiest method for the selection of sample from population (Schmoldt and et. al., 2013). The
random sampling method has its own advantages because in random sampling there are less
chances of biases as compared to the other methods. The random sampling method has selected
sample of 60 random respondents from the total population of central London. The different
queries for which the various questions are asked from the respondents are:
1.) Diversity of services
2.) Quality and quantity of food.
3.) Rates
4.) Ambience of Food for friends.
1.3 Design of Questionnaire
Questionnaire
Food for friends
Name:
Sex:
Age:
Q1. Have you visited food on fire ever?
Yes
No
Q2. What is best in Food for friends?
Services
Food
Surrounding
Other
3
Q3 Are you satisfied with the quality of food?
3.) Yes
4.) No
Q4 Did the price of the food and services food for fire affordable and reasonable?
1.) Yes
2.) No
Q5. Are you satisfied with diversity of the cuisines that are available in food for friends?
Satisfied
Highly satisfied
Not Satisfied
Q6. Which cuisine is best for the main Dishes?
Italian
Chinese
French
Q7. Do you want that food for fire introduce new dishes?
Yes, in breakfast.
Yes, in lunch
No
Q8 In which location do you want food for friends to start their new restaurant?
Prime location
Country side
Q9. Do you want to receive something unique on festivals?
Yes
No
Q10 Would you like to provide any personal views?
Ans...
TASK 2
2.1 Create information for making decision by summarising data using representative value
Q1. Have you ever visited food for friends?
4
⊘ This is a preview!⊘
Do you want full access?
Subscribe today to unlock all pages.
Trusted by 1+ million students worldwide
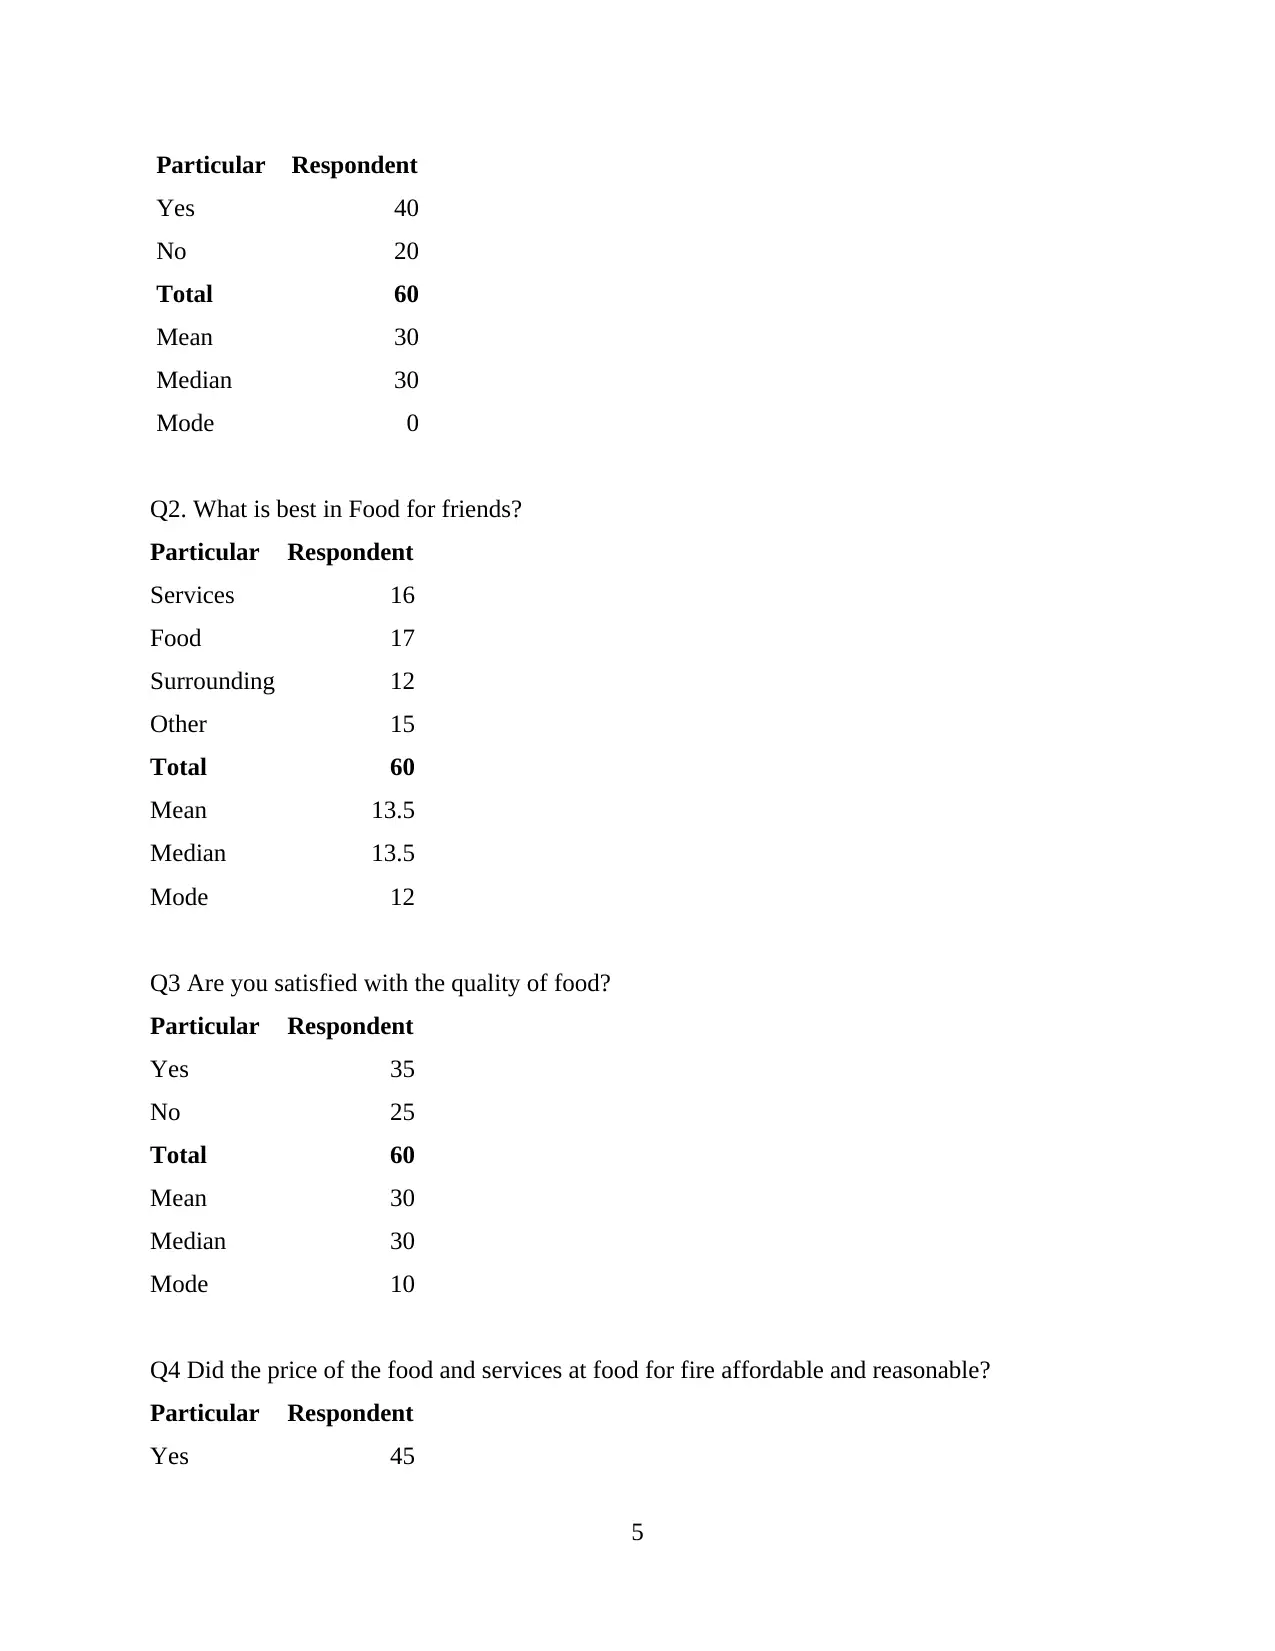
Particular Respondent
Yes 40
No 20
Total 60
Mean 30
Median 30
Mode 0
Q2. What is best in Food for friends?
Particular Respondent
Services 16
Food 17
Surrounding 12
Other 15
Total 60
Mean 13.5
Median 13.5
Mode 12
Q3 Are you satisfied with the quality of food?
Particular Respondent
Yes 35
No 25
Total 60
Mean 30
Median 30
Mode 10
Q4 Did the price of the food and services at food for fire affordable and reasonable?
Particular Respondent
Yes 45
5
Paraphrase This Document
Need a fresh take? Get an instant paraphrase of this document with our AI Paraphraser
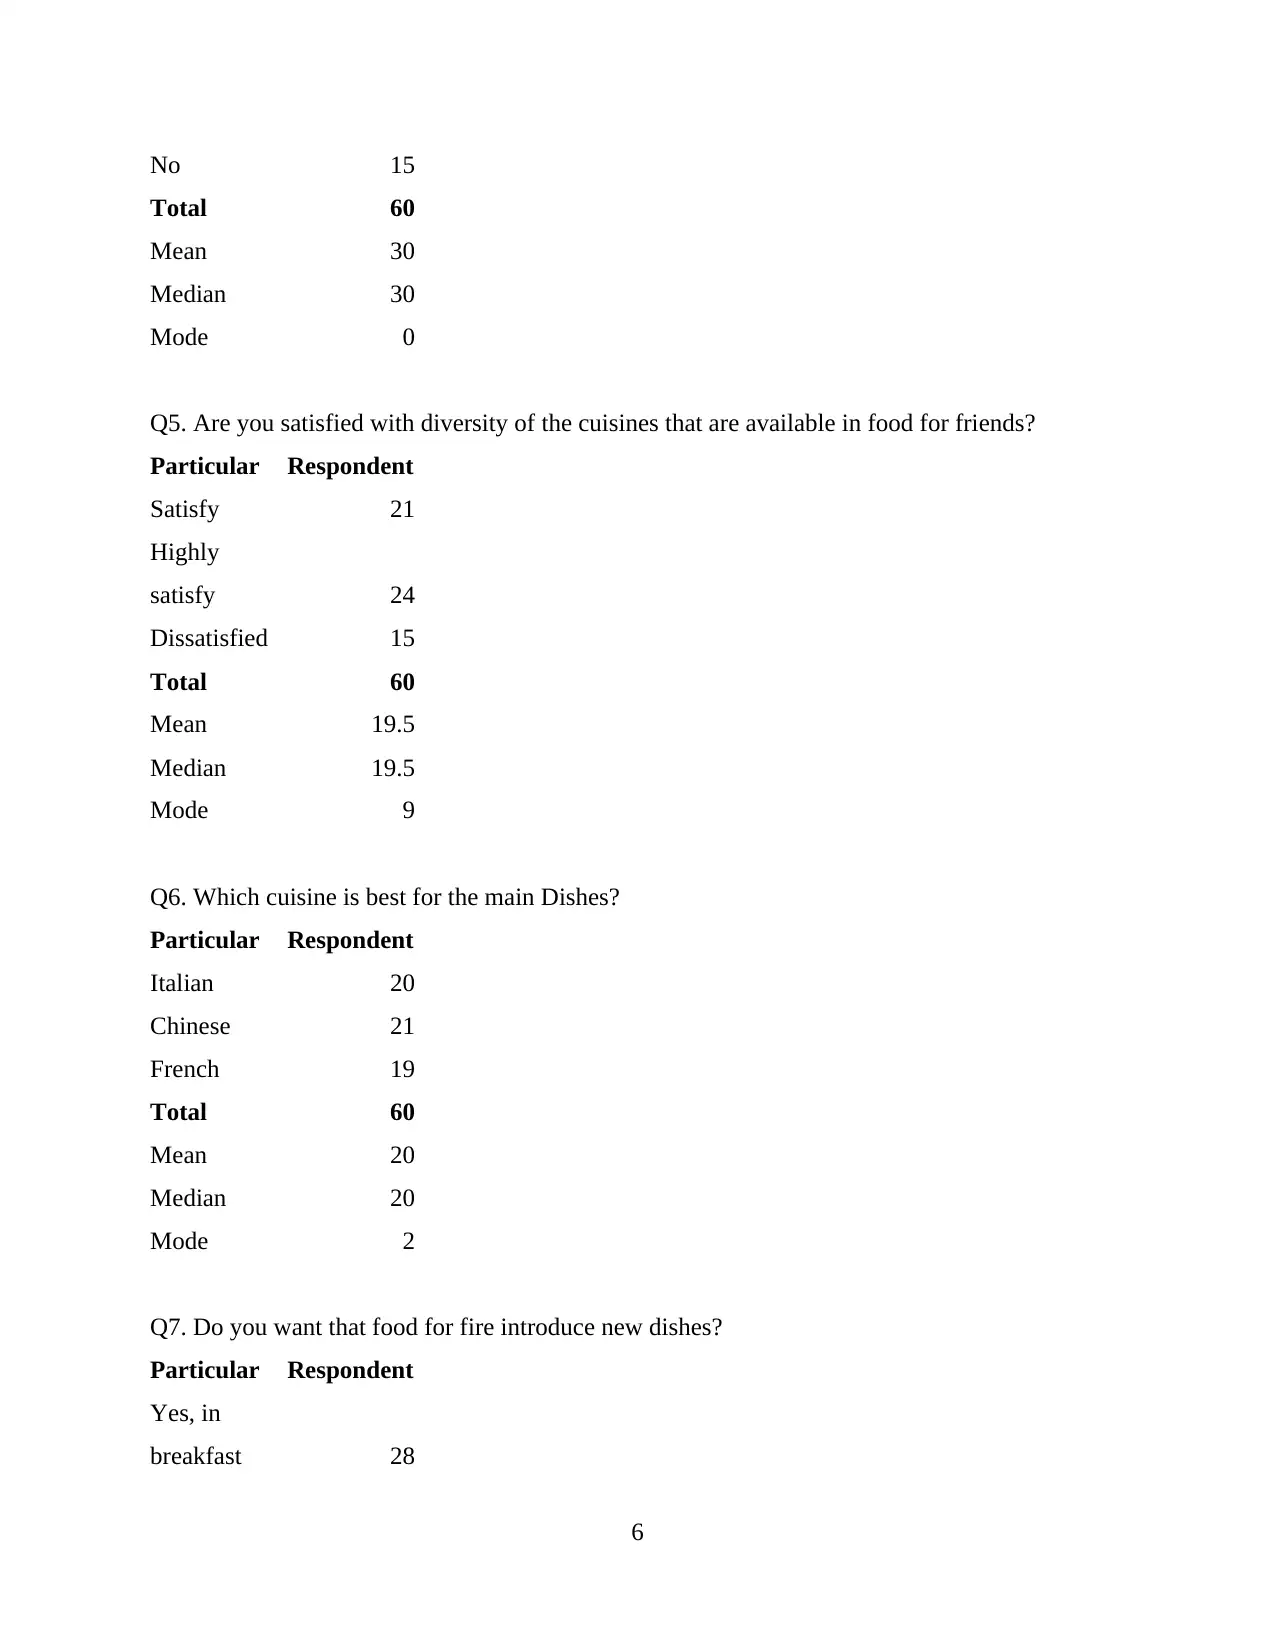
No 15
Total 60
Mean 30
Median 30
Mode 0
Q5. Are you satisfied with diversity of the cuisines that are available in food for friends?
Particular Respondent
Satisfy 21
Highly
satisfy 24
Dissatisfied 15
Total 60
Mean 19.5
Median 19.5
Mode 9
Q6. Which cuisine is best for the main Dishes?
Particular Respondent
Italian 20
Chinese 21
French 19
Total 60
Mean 20
Median 20
Mode 2
Q7. Do you want that food for fire introduce new dishes?
Particular Respondent
Yes, in
breakfast 28
6
Total 60
Mean 30
Median 30
Mode 0
Q5. Are you satisfied with diversity of the cuisines that are available in food for friends?
Particular Respondent
Satisfy 21
Highly
satisfy 24
Dissatisfied 15
Total 60
Mean 19.5
Median 19.5
Mode 9
Q6. Which cuisine is best for the main Dishes?
Particular Respondent
Italian 20
Chinese 21
French 19
Total 60
Mean 20
Median 20
Mode 2
Q7. Do you want that food for fire introduce new dishes?
Particular Respondent
Yes, in
breakfast 28
6
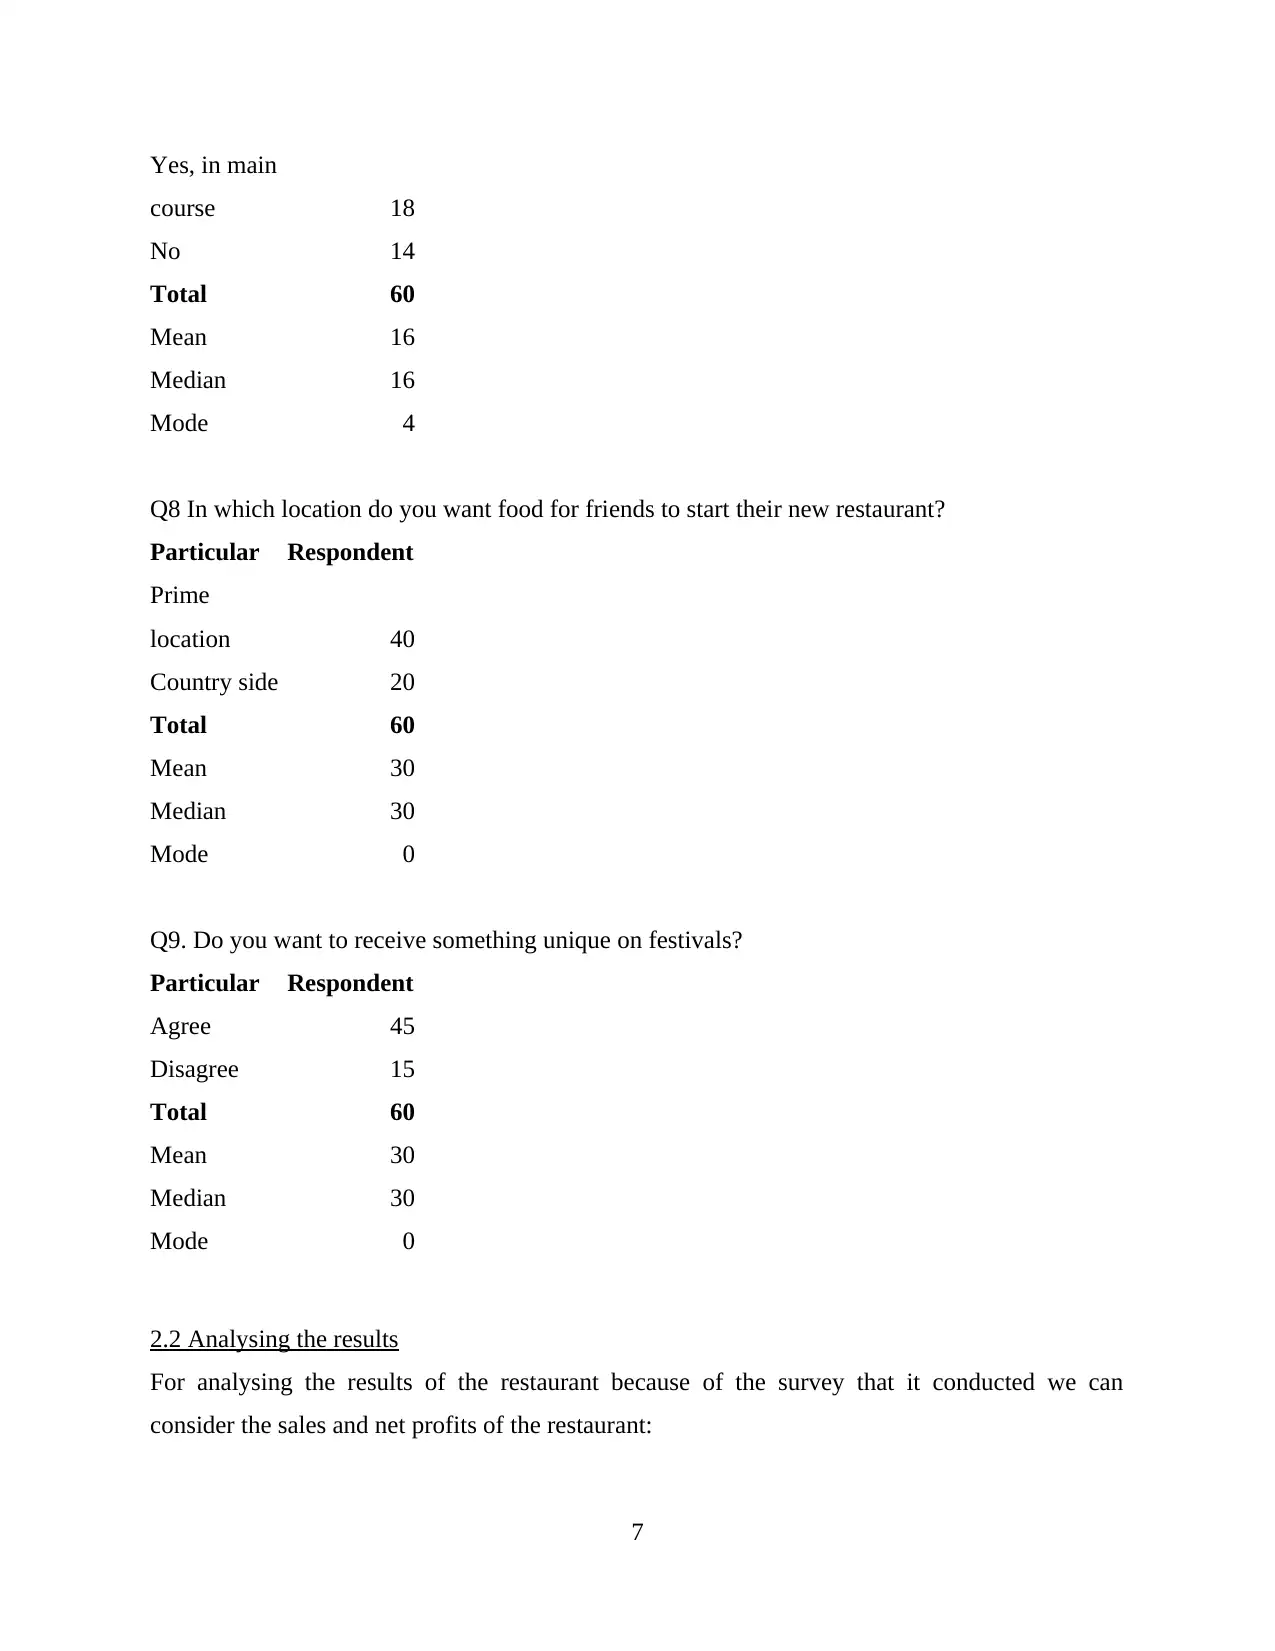
Yes, in main
course 18
No 14
Total 60
Mean 16
Median 16
Mode 4
Q8 In which location do you want food for friends to start their new restaurant?
Particular Respondent
Prime
location 40
Country side 20
Total 60
Mean 30
Median 30
Mode 0
Q9. Do you want to receive something unique on festivals?
Particular Respondent
Agree 45
Disagree 15
Total 60
Mean 30
Median 30
Mode 0
2.2 Analysing the results
For analysing the results of the restaurant because of the survey that it conducted we can
consider the sales and net profits of the restaurant:
7
⊘ This is a preview!⊘
Do you want full access?
Subscribe today to unlock all pages.
Trusted by 1+ million students worldwide
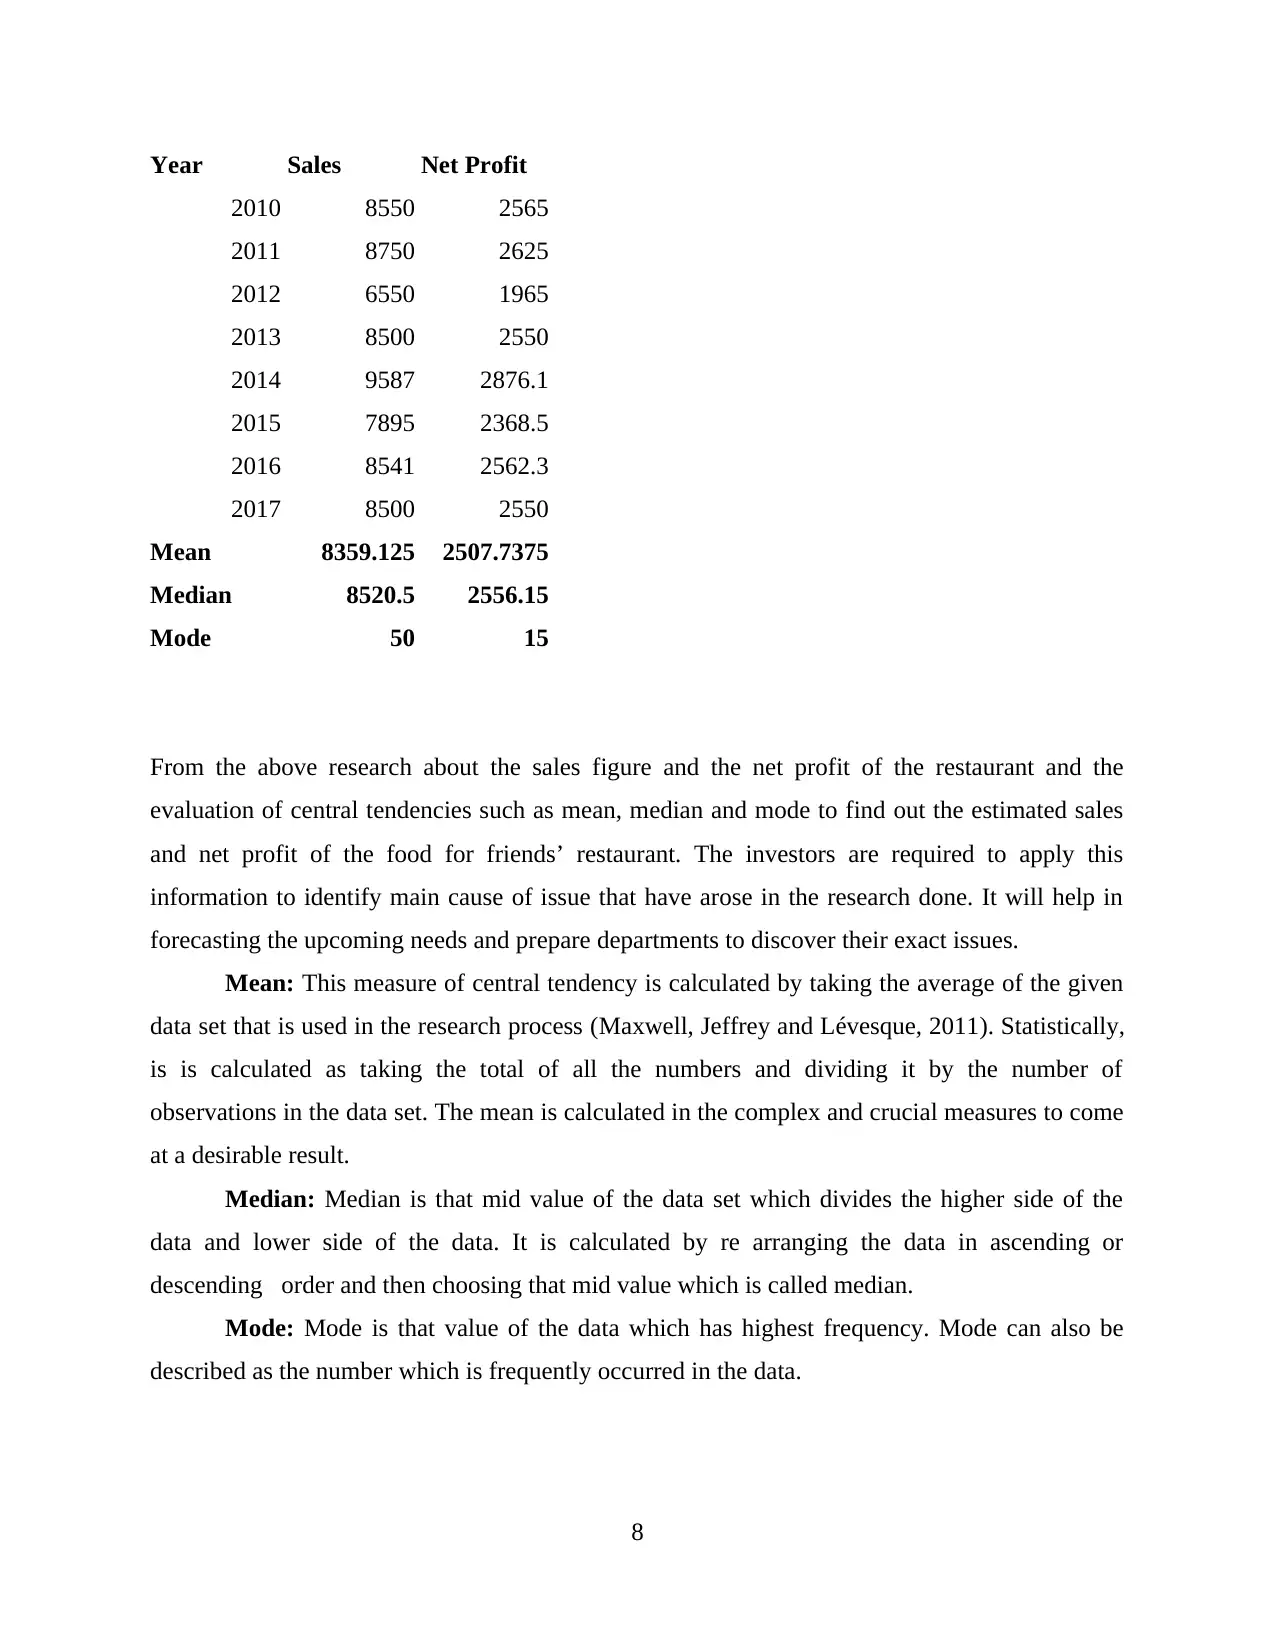
Year Sales Net Profit
2010 8550 2565
2011 8750 2625
2012 6550 1965
2013 8500 2550
2014 9587 2876.1
2015 7895 2368.5
2016 8541 2562.3
2017 8500 2550
Mean 8359.125 2507.7375
Median 8520.5 2556.15
Mode 50 15
From the above research about the sales figure and the net profit of the restaurant and the
evaluation of central tendencies such as mean, median and mode to find out the estimated sales
and net profit of the food for friends’ restaurant. The investors are required to apply this
information to identify main cause of issue that have arose in the research done. It will help in
forecasting the upcoming needs and prepare departments to discover their exact issues.
Mean: This measure of central tendency is calculated by taking the average of the given
data set that is used in the research process (Maxwell, Jeffrey and Lévesque, 2011). Statistically,
is is calculated as taking the total of all the numbers and dividing it by the number of
observations in the data set. The mean is calculated in the complex and crucial measures to come
at a desirable result.
Median: Median is that mid value of the data set which divides the higher side of the
data and lower side of the data. It is calculated by re arranging the data in ascending or
descending order and then choosing that mid value which is called median.
Mode: Mode is that value of the data which has highest frequency. Mode can also be
described as the number which is frequently occurred in the data.
8
Paraphrase This Document
Need a fresh take? Get an instant paraphrase of this document with our AI Paraphraser
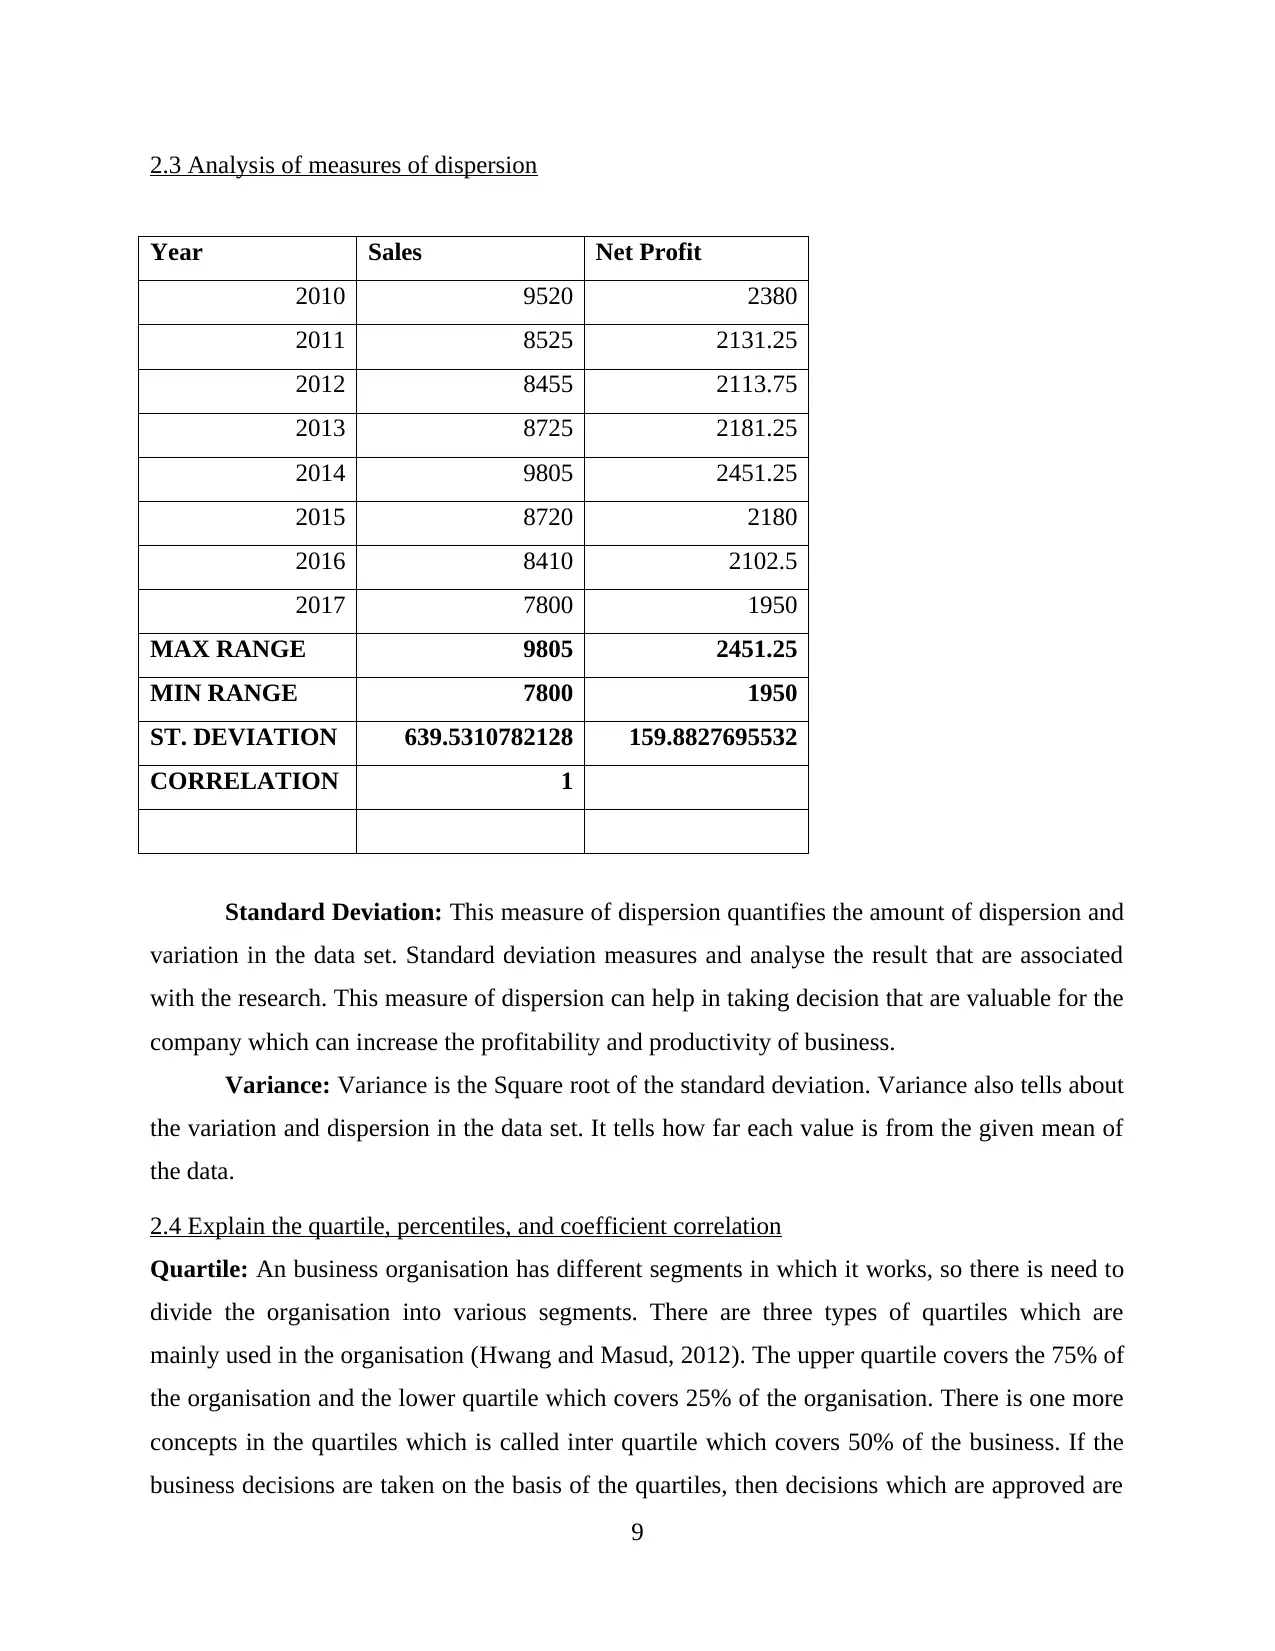
2.3 Analysis of measures of dispersion
Year Sales Net Profit
2010 9520 2380
2011 8525 2131.25
2012 8455 2113.75
2013 8725 2181.25
2014 9805 2451.25
2015 8720 2180
2016 8410 2102.5
2017 7800 1950
MAX RANGE 9805 2451.25
MIN RANGE 7800 1950
ST. DEVIATION 639.5310782128 159.8827695532
CORRELATION 1
Standard Deviation: This measure of dispersion quantifies the amount of dispersion and
variation in the data set. Standard deviation measures and analyse the result that are associated
with the research. This measure of dispersion can help in taking decision that are valuable for the
company which can increase the profitability and productivity of business.
Variance: Variance is the Square root of the standard deviation. Variance also tells about
the variation and dispersion in the data set. It tells how far each value is from the given mean of
the data.
2.4 Explain the quartile, percentiles, and coefficient correlation
Quartile: An business organisation has different segments in which it works, so there is need to
divide the organisation into various segments. There are three types of quartiles which are
mainly used in the organisation (Hwang and Masud, 2012). The upper quartile covers the 75% of
the organisation and the lower quartile which covers 25% of the organisation. There is one more
concepts in the quartiles which is called inter quartile which covers 50% of the business. If the
business decisions are taken on the basis of the quartiles, then decisions which are approved are
9
those which comes between the lower and upper quartiles. Those project which do not come
between these limits are are not approved. These quartiles will make a huge impact on enhancing
the decision making of the management of food for friends. This helps in adopting the projects
which are beneficial for the company in increasing the profitability
Percentiles: This measure is very important in converting the data in the form of
percentage. For the purpose of converting the data in the percentages it is necessary to take a
common base (Groebner and et. al., 2011). The decision is effective only when the percentage is
in the maximum limit of 100%. This method has major importance in improving the decision
making power and to take effective decisions in the management of food for friends.
Correlation coefficient: The correlation coefficient is a significant method in the
determination of the relation between the two given variables. The correlation coefficient helps
in making effective decisions in the food for friends’ restaurant. The effective limit of correlation
is between 1 to -1. when the relation between two variables comes between such limit then the
project is acceptable otherwise it will be rejected.
TASK 3
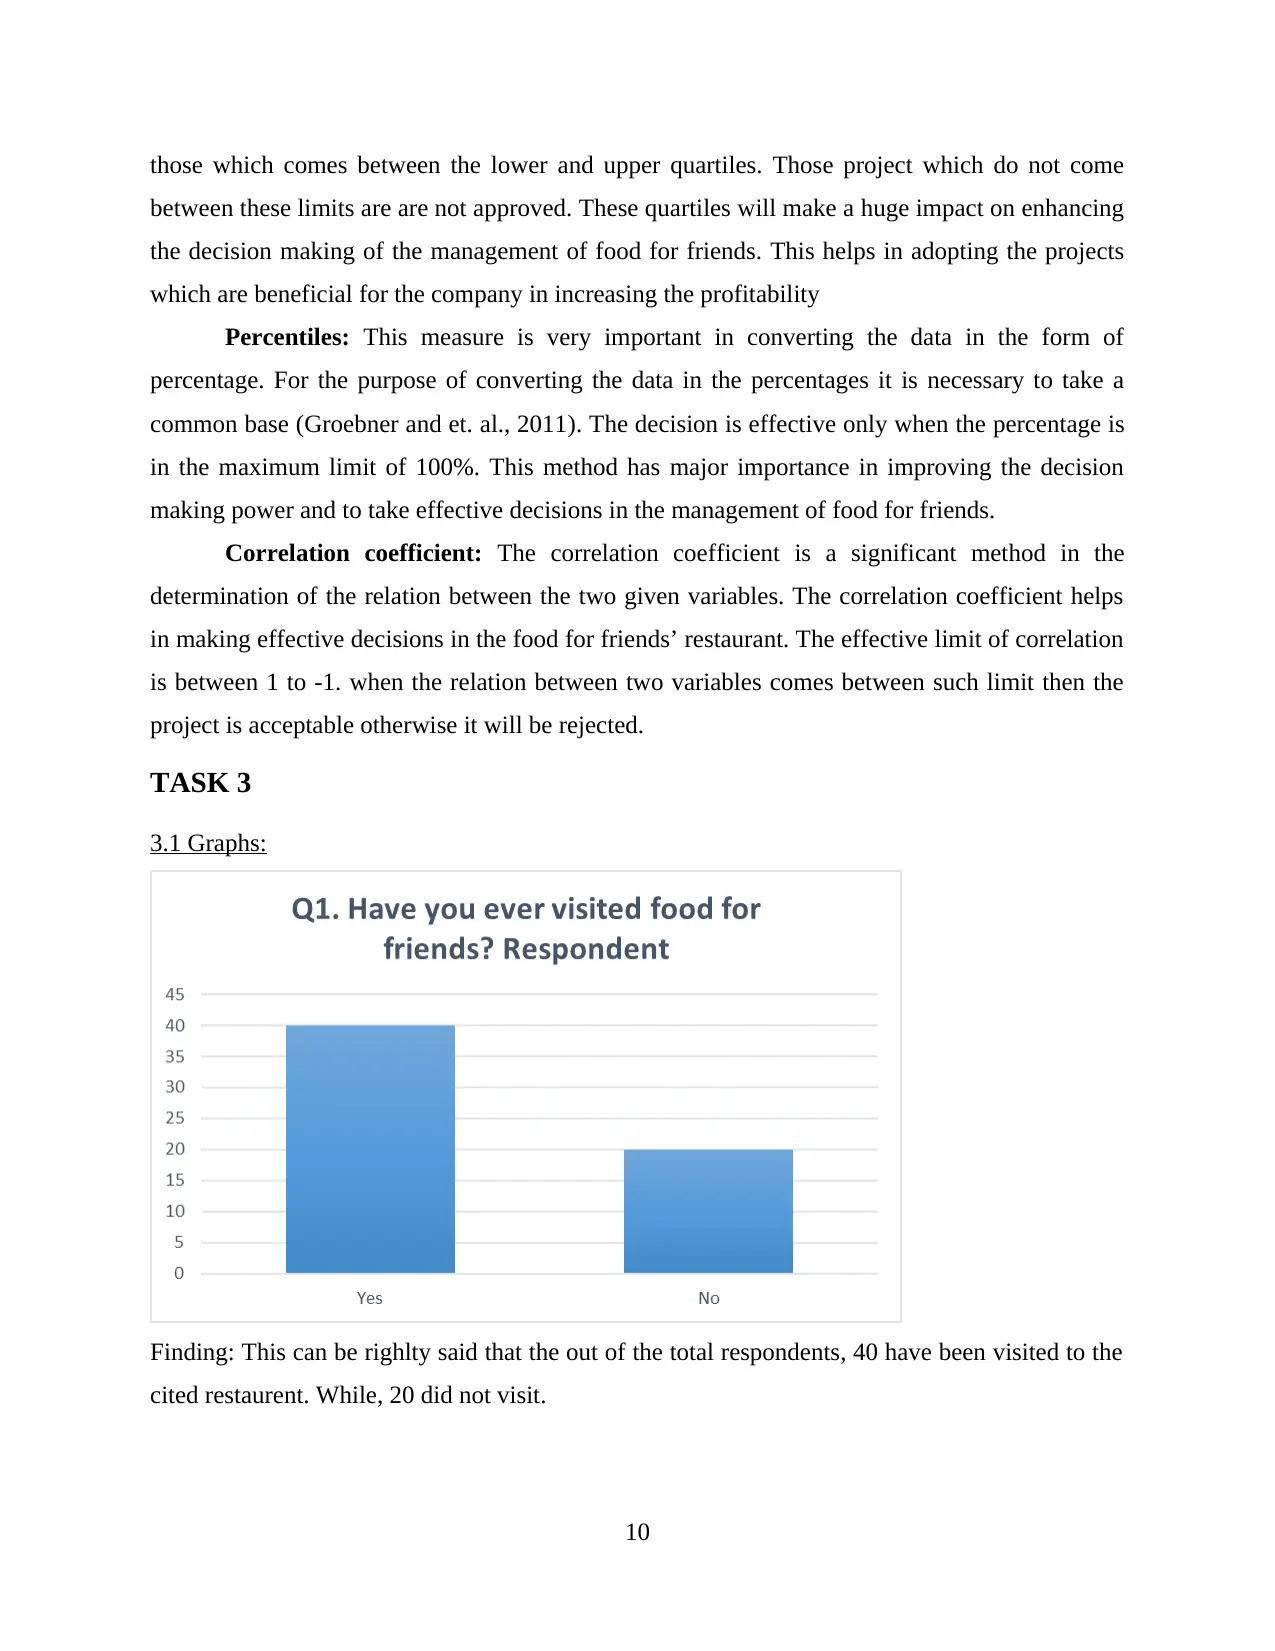
3.1 Graphs:
Finding: This can be righlty said that the out of the total respondents, 40 have been visited to the
cited restaurent. While, 20 did not visit.
10
between these limits are are not approved. These quartiles will make a huge impact on enhancing
the decision making of the management of food for friends. This helps in adopting the projects
which are beneficial for the company in increasing the profitability
Percentiles: This measure is very important in converting the data in the form of
percentage. For the purpose of converting the data in the percentages it is necessary to take a
common base (Groebner and et. al., 2011). The decision is effective only when the percentage is
in the maximum limit of 100%. This method has major importance in improving the decision
making power and to take effective decisions in the management of food for friends.
Correlation coefficient: The correlation coefficient is a significant method in the
determination of the relation between the two given variables. The correlation coefficient helps
in making effective decisions in the food for friends’ restaurant. The effective limit of correlation
is between 1 to -1. when the relation between two variables comes between such limit then the
project is acceptable otherwise it will be rejected.
TASK 3
3.1 Graphs:
Finding: This can be righlty said that the out of the total respondents, 40 have been visited to the
cited restaurent. While, 20 did not visit.
10
⊘ This is a preview!⊘
Do you want full access?
Subscribe today to unlock all pages.
Trusted by 1+ million students worldwide
1 out of 21
Related Documents


Your All-in-One AI-Powered Toolkit for Academic Success.
+13062052269
info@desklib.com
Available 24*7 on WhatsApp / Email
![[object Object]](/_next/static/media/star-bottom.7253800d.svg)
Unlock your academic potential
Copyright © 2020–2026 A2Z Services. All Rights Reserved. Developed and managed by ZUCOL.