Business Decision Making Report: Syngenta's Amistar Launch Plan
VerifiedAdded on 2020/01/21
|27
|7363
|87
Report
AI Summary
This report provides a comprehensive analysis of business decision-making processes, focusing on Syngenta's plan to launch Amistar, a broad-spectrum fungicide, in London. The study begins with an introduction to business decision-making, highlighting its importance for corporate success. Task 1 details data collection methods, including primary and secondary sources, and discusses survey methodologies and sampling techniques using a market survey questionnaire. Task 2 delves into statistical analysis, covering the calculation and interpretation of mean, mode, median, range, standard deviation, and percentiles. Task 3 focuses on data visualization, with the creation of column, bar, and line graphs, and explores time series analysis for forecasting. Task 4 presents project management tools such as Gantt charts and network diagrams, along with the application of financial tools for decision-making. The report concludes with an evaluation of the decision-making process and recommendations for Syngenta.

Business Decision Making
Paraphrase This Document
Need a fresh take? Get an instant paraphrase of this document with our AI Paraphraser
TABLE OF CONTENTS
INTRODUCTION................................................................................................................................
TASK 1.................................................................................................................................................
Q.1 Collection of primary or secondary data and discussion on survey methodology and
sampling technique......................................................................................................................1
Q.2 Market survey questionnaire.................................................................................................2
M1 Ways of calculating coefficient of skewness and its use in improving organization's
performance.................................................................................................................................5
TASK 2.................................................................................................................................................
TASK 2.................................................................................................................................................
Q.1 Mean and Mode and Median................................................................................................5
Q.2 Range and Standard Deviation..............................................................................................7
Q.3 25th Percentile (Lower iii. 25th Percentile (Lower Quartile) and 75th Percentile (Upper
Quartile) and use of Percentile.....................................................................................................9
TASK 3...............................................................................................................................................
Q.1 Producing column and bar graph for sales cost and profit..................................................11
Q.2 Line graphs showing trend lines which can be used for projecting sales and profit..........13
Q.3 This part is covered in PowerPoint presentation.................................................................15
D1 Evaluating use of time series analysis as a tool for forecasting...........................................15
TASK 4...............................................................................................................................................
Q1 Gantt chart............................................................................................................................16
Q2 Network Diagram.................................................................................................................18
Q.3 Use of financial tools for decision making.........................................................................19
D3...............................................................................................................................................23
CONCLUSION..................................................................................................................................
References..........................................................................................................................................
INTRODUCTION
Business decision making is regarded as an essential part of every business. This is being
carried out with an aim to make selection of suitable course of actions that can result in
attainment of success by the firm. It is regarded as a cognitive process that leads to the selection
of appropriate action among the various alternatives present (Black, 2011). For the purpose of
surviving for the longer term, it is essential for the corporation to take into account different
actions so that it can achieve desired targets in an appropriate manner.
In the present report, business decision making has been discussed with respect to
Syngenta. The firm is one of the world's leading companies that possesses more than 28000
employees in approximately 90 countries. Main purpose of the business to bring plant potential
to life. The company is planning to launch new product that is Amistar which is a broad
spectrum fungicide that can be used in Integrated Pest Management. The country chosen for the
launch of Amistar is London. The present study entails to make the use of wide range of sources
for data collection. Further, it covers understanding regarding range of techniques for the
analysis of data. The report involves the production of information in a suitable formation for
decision making. Lastly, the study makes use of software generated information to develop
decisions at operational, tactical and strategic level within business.
TASK 1
Q.1 Collection of primary or secondary data and discussion on survey methodology and
sampling technique
The launch of Amistar will be done in the country that is London. This is used in order to
reduce the threat of diseases that might occur from various pests such as cockroaches, beds,
bugs, mice, rats as well as moths etc. Launch of Amistar can be beneficial for London as it
makes country clean and free from pests (Fassin, Van Rossemand Buelens, 2011). The technique
of data collection is regarded as the most crucial business activity that acts as an aid in taking
suitable decisions. Further, it is essential for the purpose of gathering information with an aim to
gain knowledge regarding preferences as well as opinions of respondents in an effective manner.
In the present study, data has been gathered in order to take appropriate decision related to
launch of Amistar in London. With an aim to know whether or not the particular decision would
be profitable for Syngenta, collection through primary and secondary sources has been used.
Through this, better understanding can be developed with respect to values and beliefs of
1
⊘ This is a preview!⊘
Do you want full access?
Subscribe today to unlock all pages.
Trusted by 1+ million students worldwide
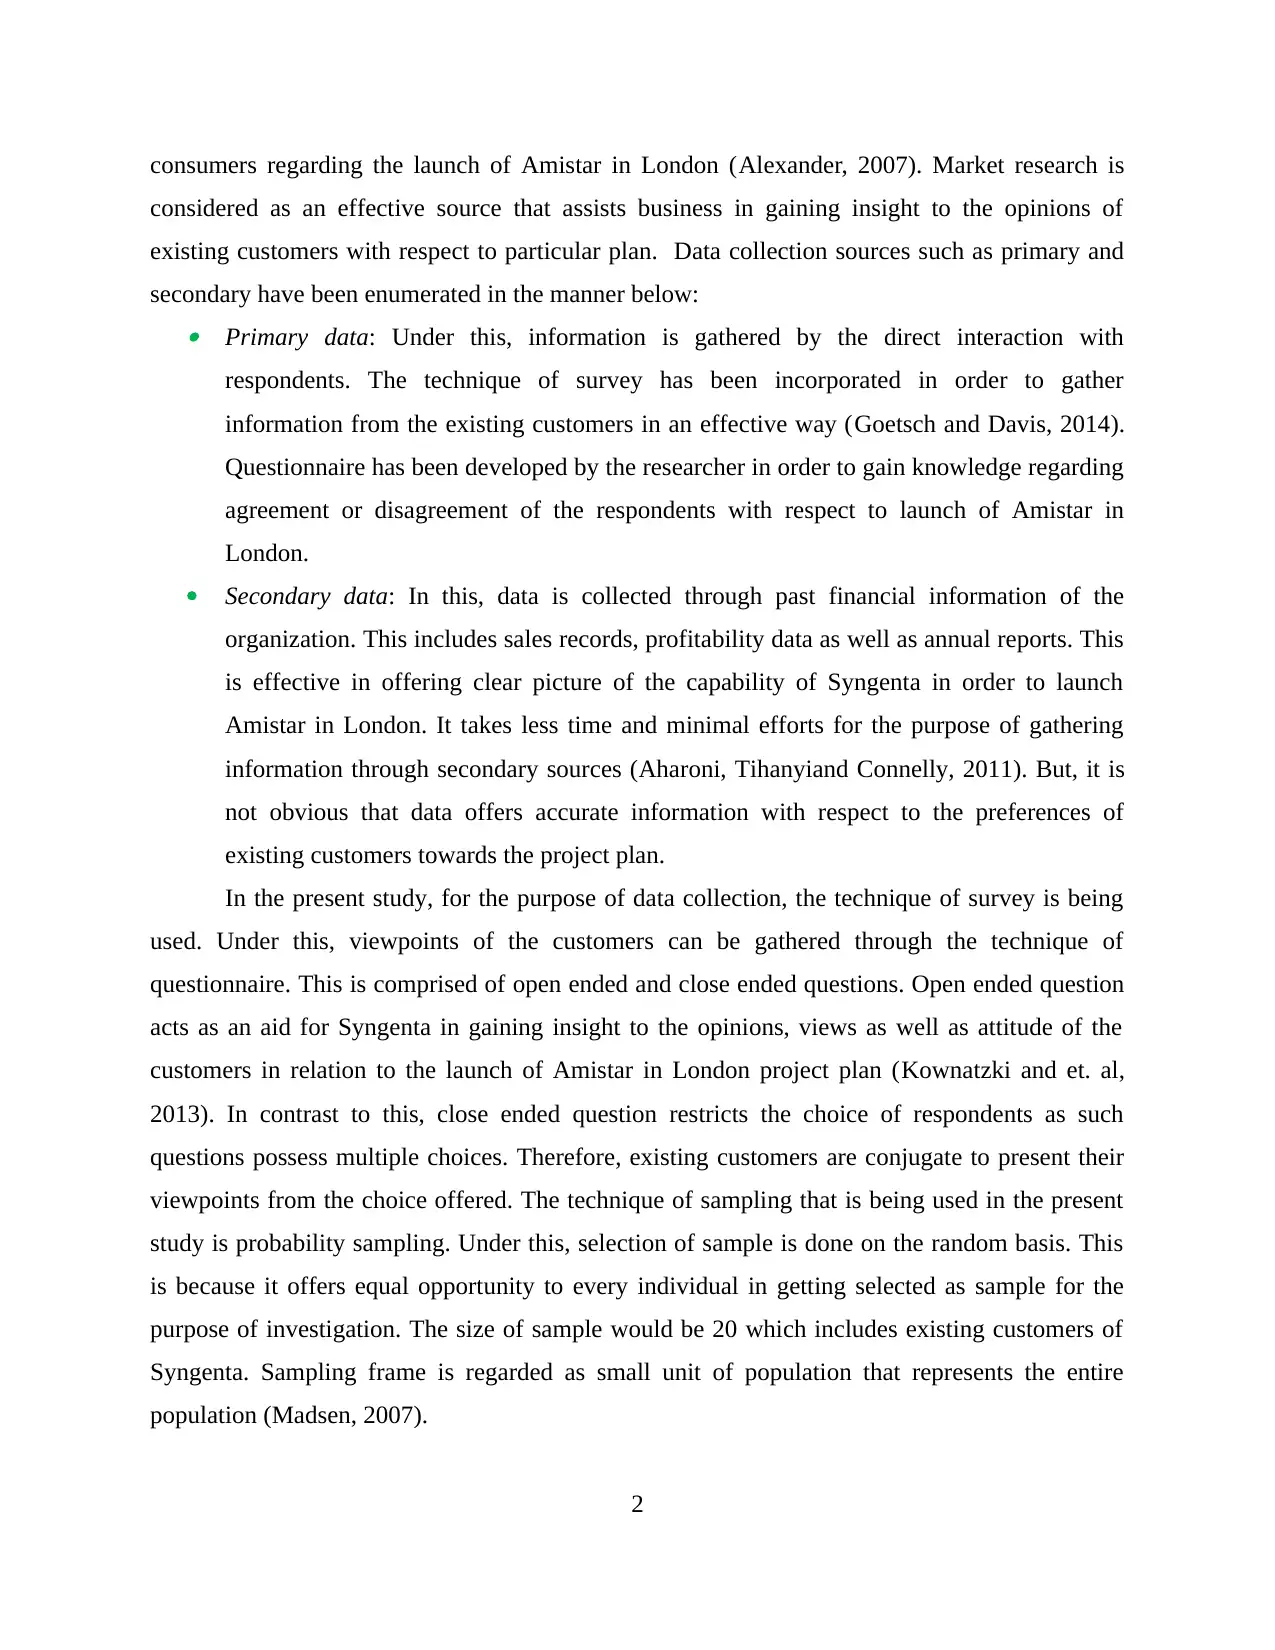
consumers regarding the launch of Amistar in London (Alexander, 2007). Market research is
considered as an effective source that assists business in gaining insight to the opinions of
existing customers with respect to particular plan. Data collection sources such as primary and
secondary have been enumerated in the manner below: Primary data: Under this, information is gathered by the direct interaction with
respondents. The technique of survey has been incorporated in order to gather
information from the existing customers in an effective way (Goetsch and Davis, 2014).
Questionnaire has been developed by the researcher in order to gain knowledge regarding
agreement or disagreement of the respondents with respect to launch of Amistar in
London.
Secondary data: In this, data is collected through past financial information of the
organization. This includes sales records, profitability data as well as annual reports. This
is effective in offering clear picture of the capability of Syngenta in order to launch
Amistar in London. It takes less time and minimal efforts for the purpose of gathering
information through secondary sources (Aharoni, Tihanyiand Connelly, 2011). But, it is
not obvious that data offers accurate information with respect to the preferences of
existing customers towards the project plan.
In the present study, for the purpose of data collection, the technique of survey is being
used. Under this, viewpoints of the customers can be gathered through the technique of
questionnaire. This is comprised of open ended and close ended questions. Open ended question
acts as an aid for Syngenta in gaining insight to the opinions, views as well as attitude of the
customers in relation to the launch of Amistar in London project plan (Kownatzki and et. al,
2013). In contrast to this, close ended question restricts the choice of respondents as such
questions possess multiple choices. Therefore, existing customers are conjugate to present their
viewpoints from the choice offered. The technique of sampling that is being used in the present
study is probability sampling. Under this, selection of sample is done on the random basis. This
is because it offers equal opportunity to every individual in getting selected as sample for the
purpose of investigation. The size of sample would be 20 which includes existing customers of
Syngenta. Sampling frame is regarded as small unit of population that represents the entire
population (Madsen, 2007).
2
Paraphrase This Document
Need a fresh take? Get an instant paraphrase of this document with our AI Paraphraser
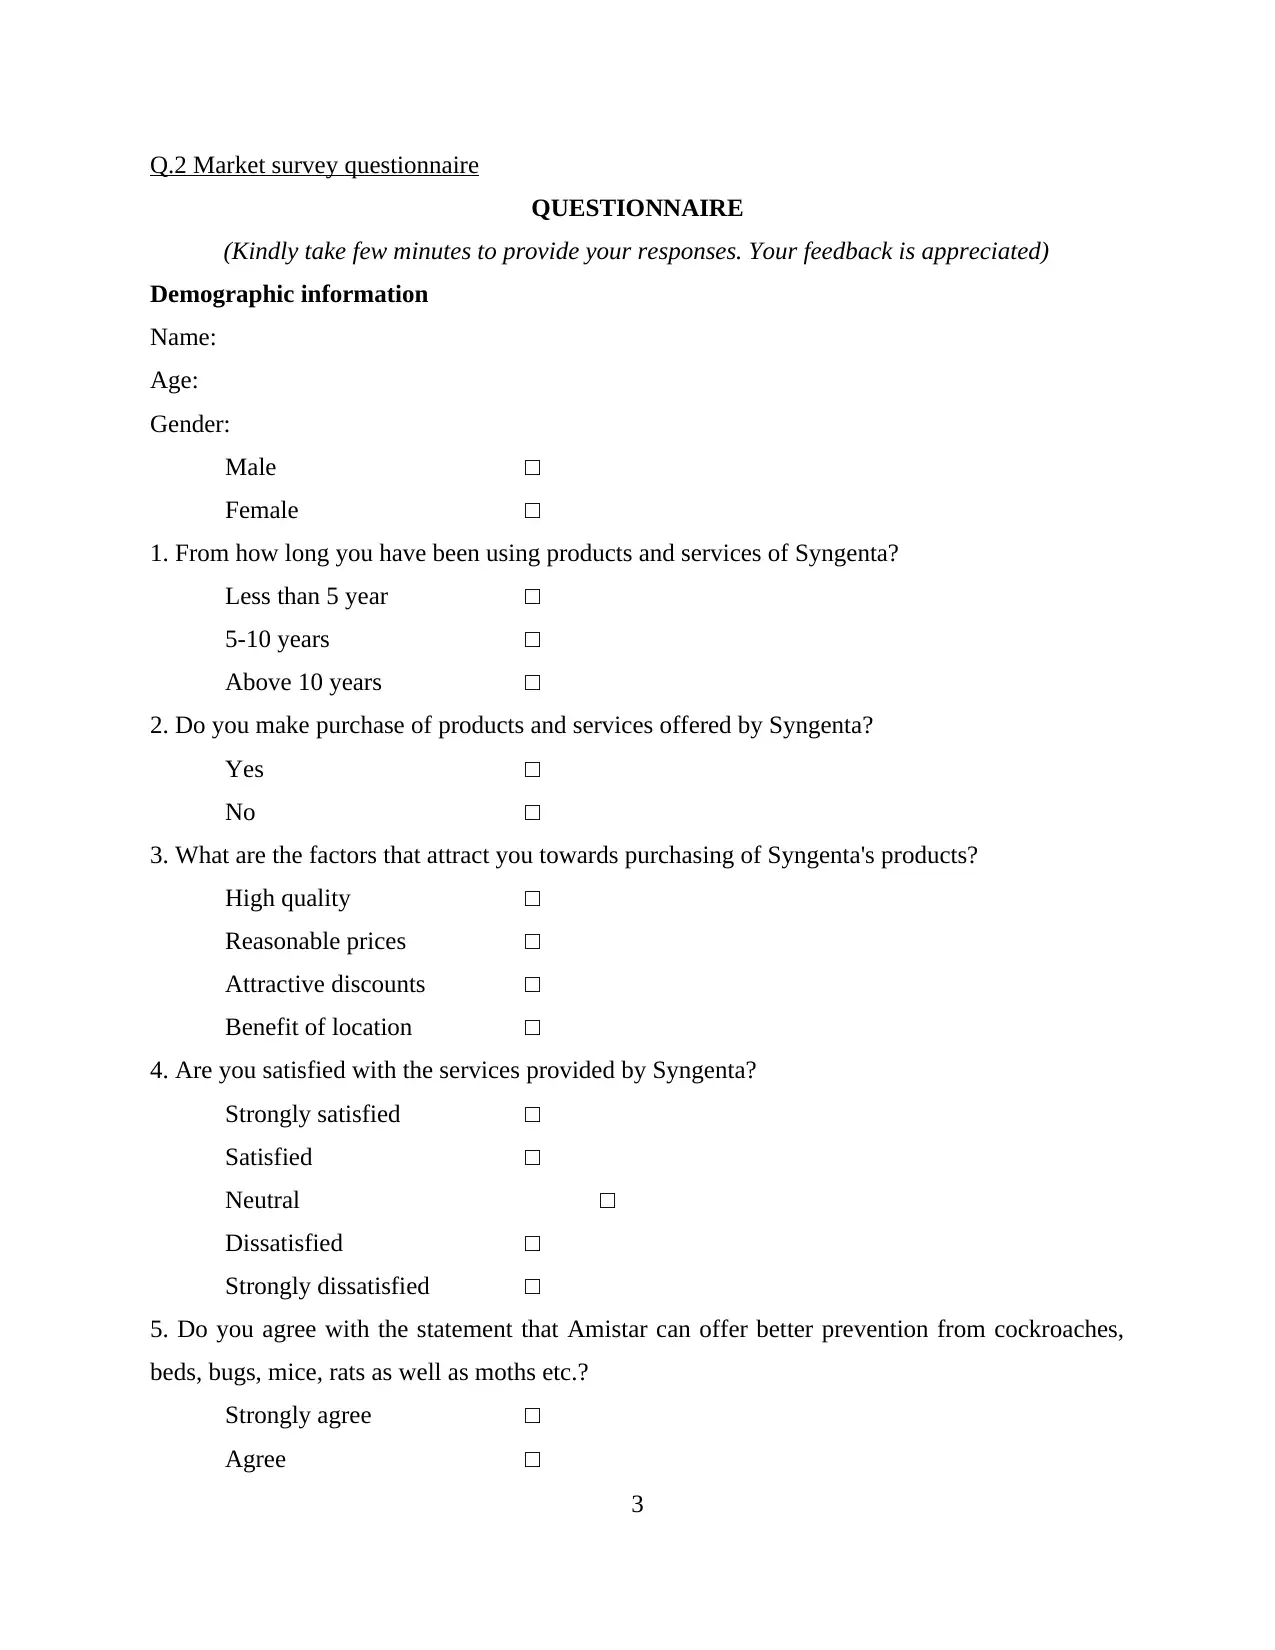
Q.2 Market survey questionnaire
QUESTIONNAIRE
(Kindly take few minutes to provide your responses. Your feedback is appreciated)
Demographic information
Name:
Age:
Gender:
Male □
Female □
1. From how long you have been using products and services of Syngenta?
Less than 5 year □
5-10 years □
Above 10 years □
2. Do you make purchase of products and services offered by Syngenta?
Yes □
No □
3. What are the factors that attract you towards purchasing of Syngenta's products?
High quality □
Reasonable prices □
Attractive discounts □
Benefit of location □
4. Are you satisfied with the services provided by Syngenta?
Strongly satisfied □
Satisfied □
Neutral □
Dissatisfied □
Strongly dissatisfied □
5. Do you agree with the statement that Amistar can offer better prevention from cockroaches,
beds, bugs, mice, rats as well as moths etc.?
Strongly agree □
Agree □
3
Neutral □
Disagree □
Strongly disagree □
6. Do you agree with the view that launch of Amistar can be beneficial for London?
Strongly agree □
Agree □
Neutral □
Disagree □
Strongly disagree □
7. Do you think, Amistar can enhance global food security?
Yes □
No □
8. What is your level of agreement to the view that Amistar can lead to responsible agriculture in
the London?
Strongly agree □
Agree □
Neutral □
Disagree □
Strongly disagree □
9. Are you satisfied with the pricing policy of Syngenta in terms of affordability?
Strongly satisfied □
Satisfied □
Neutral □
Dissatisfied □
Strongly dissatisfied □
10. Do you agree with the view that integrated pest management can be effectively carried out
through Amistar?
Strongly agree □
Agree □
Neutral □
Disagree □
4
Disagree □
Strongly disagree □
6. Do you agree with the view that launch of Amistar can be beneficial for London?
Strongly agree □
Agree □
Neutral □
Disagree □
Strongly disagree □
7. Do you think, Amistar can enhance global food security?
Yes □
No □
8. What is your level of agreement to the view that Amistar can lead to responsible agriculture in
the London?
Strongly agree □
Agree □
Neutral □
Disagree □
Strongly disagree □
9. Are you satisfied with the pricing policy of Syngenta in terms of affordability?
Strongly satisfied □
Satisfied □
Neutral □
Dissatisfied □
Strongly dissatisfied □
10. Do you agree with the view that integrated pest management can be effectively carried out
through Amistar?
Strongly agree □
Agree □
Neutral □
Disagree □
4
⊘ This is a preview!⊘
Do you want full access?
Subscribe today to unlock all pages.
Trusted by 1+ million students worldwide
Strongly disagree □
11. If, you did not request pest control service, why not?
Do own pest control □
Difficult to be prepared for treatment □
Concern about the chemicals □
12. Suggest the manner in which Syngenta can bring improvement in the products and services?
______________________________________________________________________________
____________________________________________________________________________
M1 Ways of calculating coefficient of skewness and its use in improving organization's
performance
Skewness is referred to as measure of asymmetry of the probability distribution of real
values random variable about its mean. In other words, it demonstrates the imbalance and
asymmetry from the mean of data distribution. The value of Skewness can be positive as well as
negative (Ogilvie, 2008). A positive skew implies that data results are larger. However, negative
skew denotes extreme data outcomes that are smaller. Coefficient of Skewness can be calculated
through the formula that is:
= 3 (Mean -Median)/ Standard deviation
The role of Skewness is effective in determining whether there is positive or negative
data results. Thus, this outcome assists in examining the past data of organization in an effective
manner. Moreover, it plays a significant role in determining the causes of deviation. Therefore,
corrective actions can be taken within reasonable time span. Skewness plays an essential role in
enhancing the overall performance of organization as such it makes evaluation of the entire
performance to a greater extent (Pettigrew, 2014). It is important for the businesses to take into
account such so that firm can attain its desired targets with efficiency and effectiveness.
Moreover, it would assist in survival of firm for the longer time.
TASK 2
TASK 2
Q.1 Mean and Mode and Median
Annual Expenditure /£m No. of Counties Mid value Fx CF
0-10 13 5 65 13
5
Paraphrase This Document
Need a fresh take? Get an instant paraphrase of this document with our AI Paraphraser
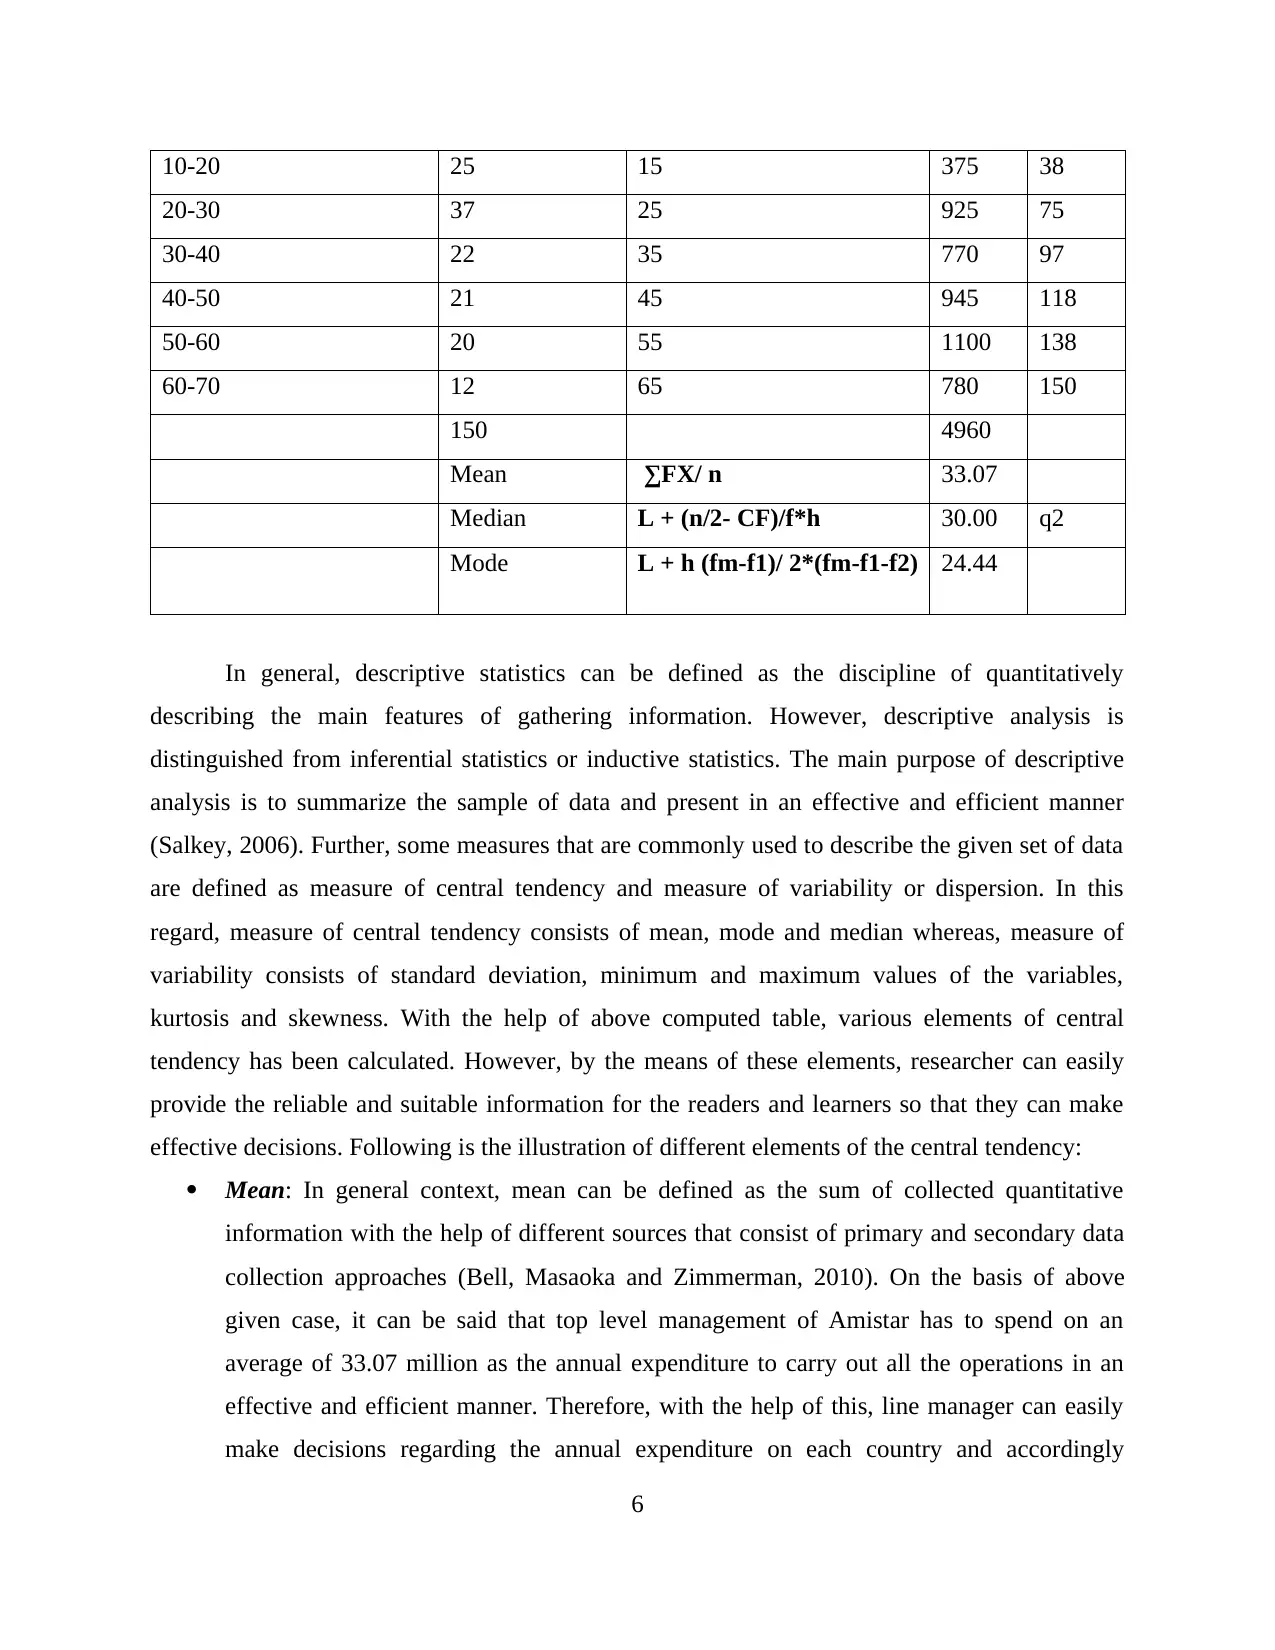
10-20 25 15 375 38
20-30 37 25 925 75
30-40 22 35 770 97
40-50 21 45 945 118
50-60 20 55 1100 138
60-70 12 65 780 150
150 4960
Mean ∑FX/ n 33.07
Median L + (n/2- CF)/f*h 30.00 q2
Mode L + h (fm-f1)/ 2*(fm-f1-f2) 24.44
In general, descriptive statistics can be defined as the discipline of quantitatively
describing the main features of gathering information. However, descriptive analysis is
distinguished from inferential statistics or inductive statistics. The main purpose of descriptive
analysis is to summarize the sample of data and present in an effective and efficient manner
(Salkey, 2006). Further, some measures that are commonly used to describe the given set of data
are defined as measure of central tendency and measure of variability or dispersion. In this
regard, measure of central tendency consists of mean, mode and median whereas, measure of
variability consists of standard deviation, minimum and maximum values of the variables,
kurtosis and skewness. With the help of above computed table, various elements of central
tendency has been calculated. However, by the means of these elements, researcher can easily
provide the reliable and suitable information for the readers and learners so that they can make
effective decisions. Following is the illustration of different elements of the central tendency:
Mean: In general context, mean can be defined as the sum of collected quantitative
information with the help of different sources that consist of primary and secondary data
collection approaches (Bell, Masaoka and Zimmerman, 2010). On the basis of above
given case, it can be said that top level management of Amistar has to spend on an
average of 33.07 million as the annual expenditure to carry out all the operations in an
effective and efficient manner. Therefore, with the help of this, line manager can easily
make decisions regarding the annual expenditure on each country and accordingly
6
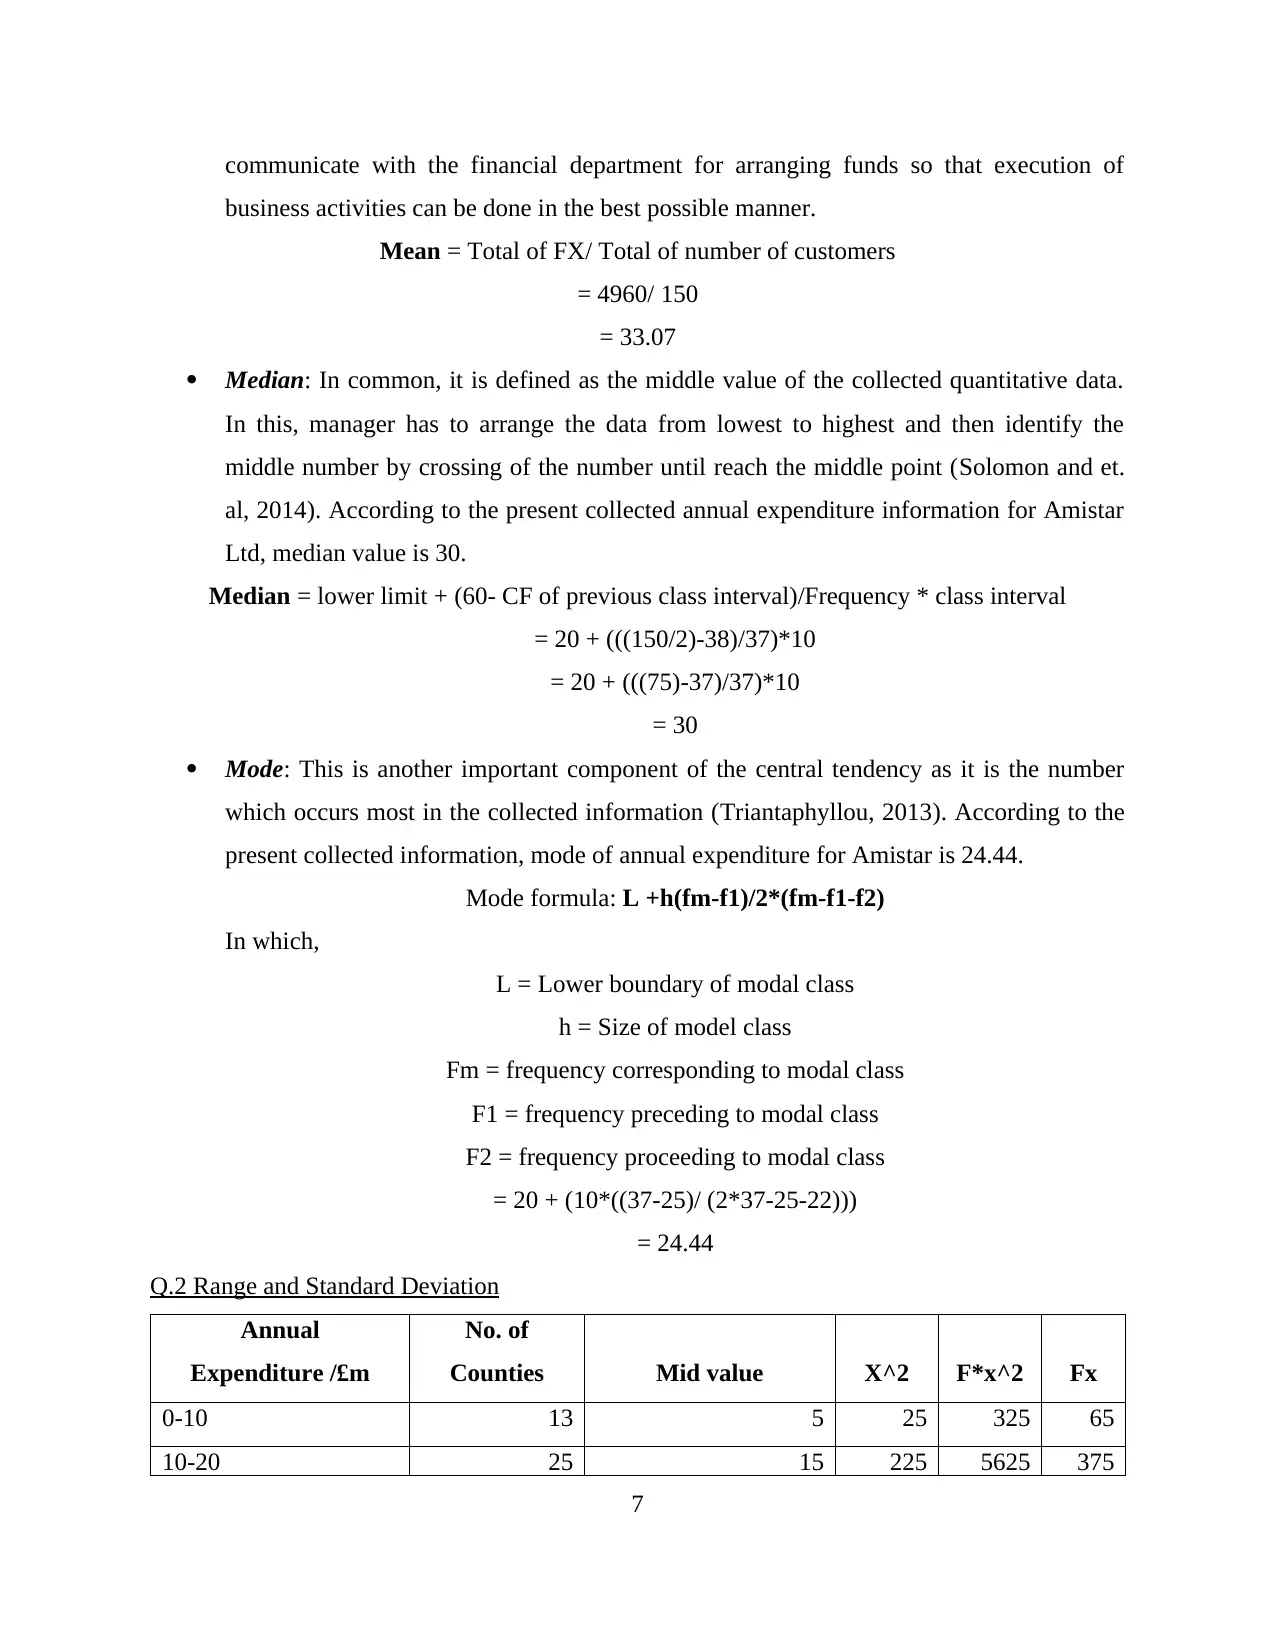
communicate with the financial department for arranging funds so that execution of
business activities can be done in the best possible manner.
Mean = Total of FX/ Total of number of customers
= 4960/ 150
= 33.07
Median: In common, it is defined as the middle value of the collected quantitative data.
In this, manager has to arrange the data from lowest to highest and then identify the
middle number by crossing of the number until reach the middle point (Solomon and et.
al, 2014). According to the present collected annual expenditure information for Amistar
Ltd, median value is 30.
Median = lower limit + (60- CF of previous class interval)/Frequency * class interval
= 20 + (((150/2)-38)/37)*10
= 20 + (((75)-37)/37)*10
= 30
Mode: This is another important component of the central tendency as it is the number
which occurs most in the collected information (Triantaphyllou, 2013). According to the
present collected information, mode of annual expenditure for Amistar is 24.44.
Mode formula: L +h(fm-f1)/2*(fm-f1-f2)
In which,
L = Lower boundary of modal class
h = Size of model class
Fm = frequency corresponding to modal class
F1 = frequency preceding to modal class
F2 = frequency proceeding to modal class
= 20 + (10*((37-25)/ (2*37-25-22)))
= 24.44
Q.2 Range and Standard Deviation
Annual
Expenditure /£m
No. of
Counties Mid value X^2 F*x^2 Fx
0-10 13 5 25 325 65
10-20 25 15 225 5625 375
7
⊘ This is a preview!⊘
Do you want full access?
Subscribe today to unlock all pages.
Trusted by 1+ million students worldwide
20-30 37 25 625 23125 925
30-40 22 35 1225 26950 770
40-50 21 45 2025 42525 945
50-60 20 55 3025 60500 1100
60-70 12 65 4225 50700 780
150 209750 4960
Variance
s2 = ∑Fx2 –
((∑Fx)2/n)/ n – 1 208649.257
Std. Deviation 456.781411
Range
Highest value -
lowest value 70
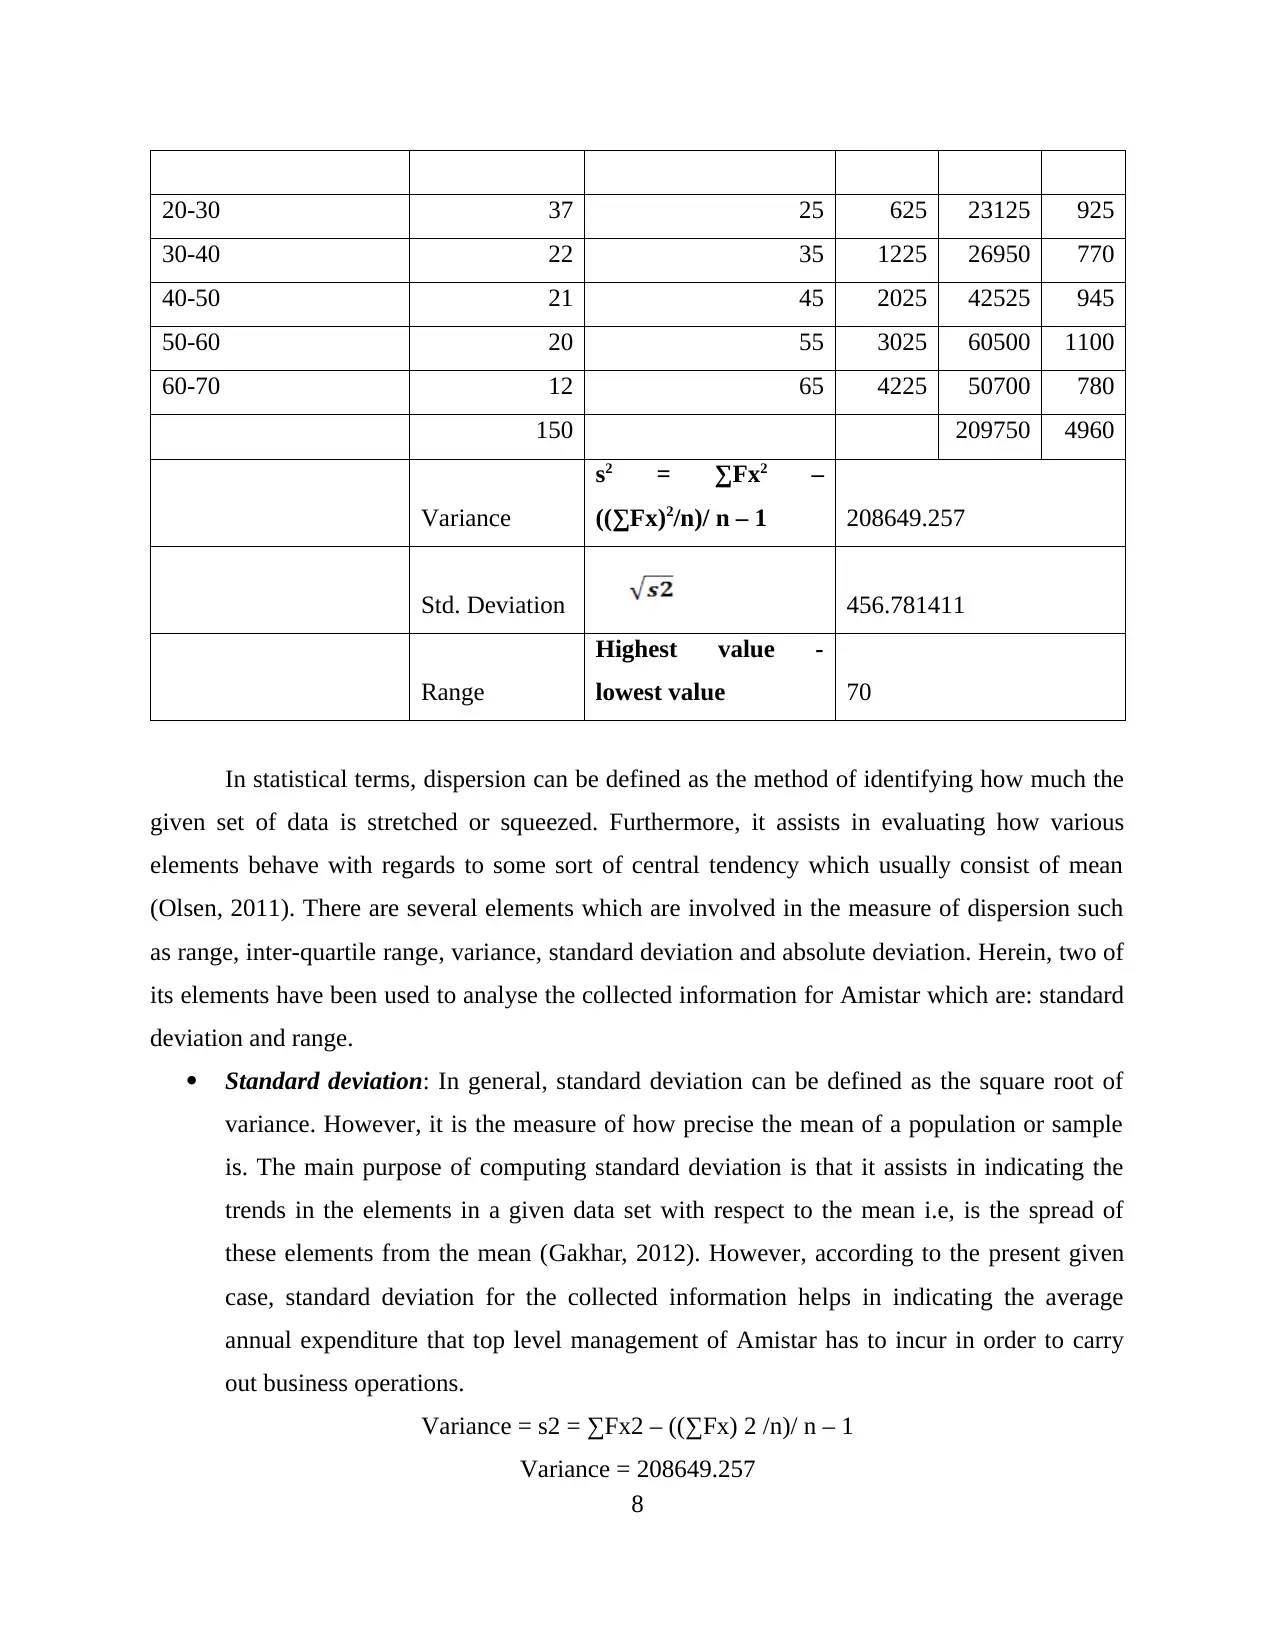
In statistical terms, dispersion can be defined as the method of identifying how much the
given set of data is stretched or squeezed. Furthermore, it assists in evaluating how various
elements behave with regards to some sort of central tendency which usually consist of mean
(Olsen, 2011). There are several elements which are involved in the measure of dispersion such
as range, inter-quartile range, variance, standard deviation and absolute deviation. Herein, two of
its elements have been used to analyse the collected information for Amistar which are: standard
deviation and range.
Standard deviation: In general, standard deviation can be defined as the square root of
variance. However, it is the measure of how precise the mean of a population or sample
is. The main purpose of computing standard deviation is that it assists in indicating the
trends in the elements in a given data set with respect to the mean i.e, is the spread of
these elements from the mean (Gakhar, 2012). However, according to the present given
case, standard deviation for the collected information helps in indicating the average
annual expenditure that top level management of Amistar has to incur in order to carry
out business operations.
Variance = s2 = ∑Fx2 – ((∑Fx) 2 /n)/ n – 1
Variance = 208649.257
8
30-40 22 35 1225 26950 770
40-50 21 45 2025 42525 945
50-60 20 55 3025 60500 1100
60-70 12 65 4225 50700 780
150 209750 4960
Variance
s2 = ∑Fx2 –
((∑Fx)2/n)/ n – 1 208649.257
Std. Deviation 456.781411
Range
Highest value -
lowest value 70
In statistical terms, dispersion can be defined as the method of identifying how much the
given set of data is stretched or squeezed. Furthermore, it assists in evaluating how various
elements behave with regards to some sort of central tendency which usually consist of mean
(Olsen, 2011). There are several elements which are involved in the measure of dispersion such
as range, inter-quartile range, variance, standard deviation and absolute deviation. Herein, two of
its elements have been used to analyse the collected information for Amistar which are: standard
deviation and range.
Standard deviation: In general, standard deviation can be defined as the square root of
variance. However, it is the measure of how precise the mean of a population or sample
is. The main purpose of computing standard deviation is that it assists in indicating the
trends in the elements in a given data set with respect to the mean i.e, is the spread of
these elements from the mean (Gakhar, 2012). However, according to the present given
case, standard deviation for the collected information helps in indicating the average
annual expenditure that top level management of Amistar has to incur in order to carry
out business operations.
Variance = s2 = ∑Fx2 – ((∑Fx) 2 /n)/ n – 1
Variance = 208649.257
8
Paraphrase This Document
Need a fresh take? Get an instant paraphrase of this document with our AI Paraphraser
Standard Deviation = S= √s2
Standard Deviation = 456.781411
Range: Range in general is the difference between highest values of the interval and
lowest value of the interval (Keller, 2013). According to the present information given for
the Amistar Ltd, range has been calculated:
Range = Highest value - lowest value
Range = 70 – 0
Range = 70
Q.3 25th Percentile (Lower iii. 25th Percentile (Lower Quartile) and 75th Percentile (Upper
Quartile) and use of Percentile
Percentile:
A percentile can be defined as the certain percentage of set of data. However, percentiles
are used with an aim of observing how many of a given set of data fall within the certain
percentage range. In this context, 25th percentile helps in evaluating that the total number of
values that comes under the 25 percentage group of the total values. In other words, it is also
defined as lower quartile (Li, 2006). Similarly, 75th percentile assists in identifying that the total
number of values that are present fall under the 75 percentage of the overall observation group.
In general, they are termed as upper quartile. Herein, researcher aims at evaluating percentile to
identify the percentage value of collected information and under which group, it falls.
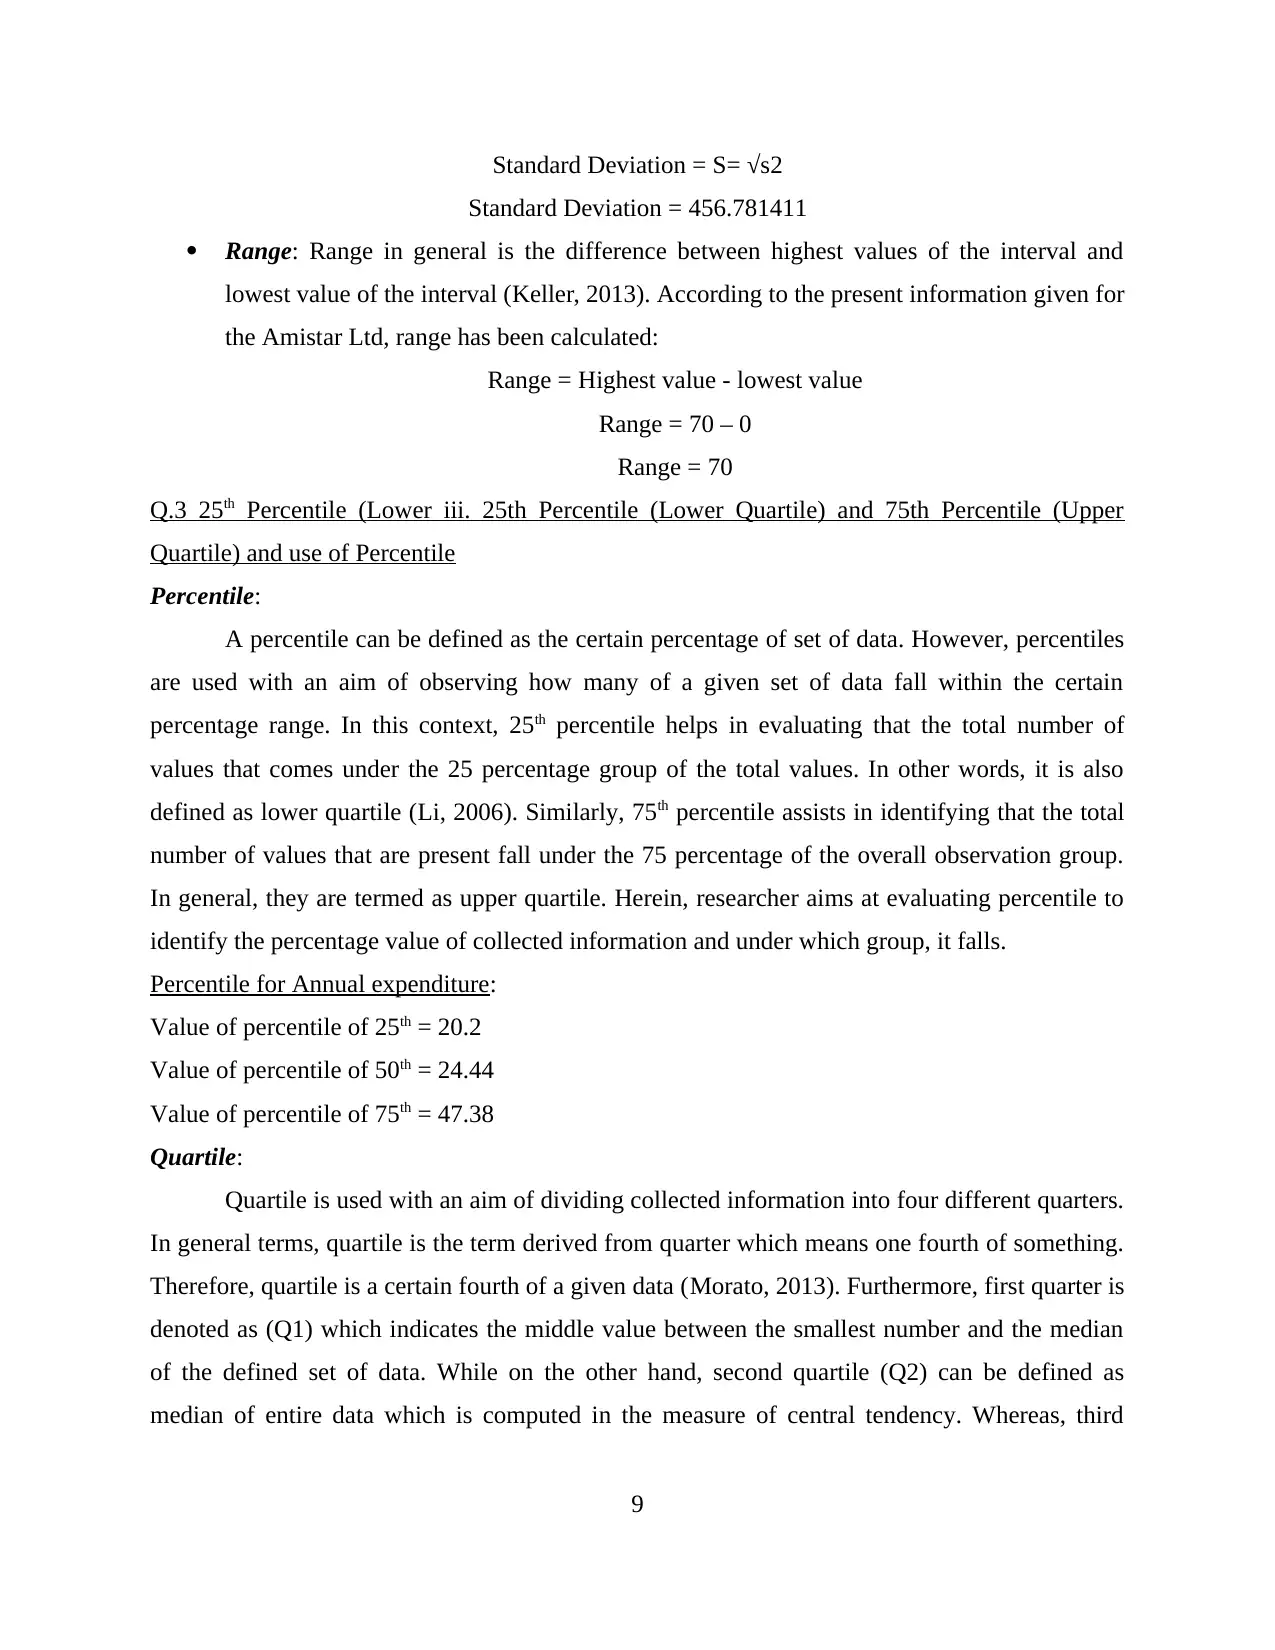
Percentile for Annual expenditure:
Value of percentile of 25th = 20.2
Value of percentile of 50th = 24.44
Value of percentile of 75th = 47.38
Quartile:
Quartile is used with an aim of dividing collected information into four different quarters.
In general terms, quartile is the term derived from quarter which means one fourth of something.
Therefore, quartile is a certain fourth of a given data (Morato, 2013). Furthermore, first quarter is
denoted as (Q1) which indicates the middle value between the smallest number and the median
of the defined set of data. While on the other hand, second quartile (Q2) can be defined as
median of entire data which is computed in the measure of central tendency. Whereas, third
9
Standard Deviation = 456.781411
Range: Range in general is the difference between highest values of the interval and
lowest value of the interval (Keller, 2013). According to the present information given for
the Amistar Ltd, range has been calculated:
Range = Highest value - lowest value
Range = 70 – 0
Range = 70
Q.3 25th Percentile (Lower iii. 25th Percentile (Lower Quartile) and 75th Percentile (Upper
Quartile) and use of Percentile
Percentile:
A percentile can be defined as the certain percentage of set of data. However, percentiles
are used with an aim of observing how many of a given set of data fall within the certain
percentage range. In this context, 25th percentile helps in evaluating that the total number of
values that comes under the 25 percentage group of the total values. In other words, it is also
defined as lower quartile (Li, 2006). Similarly, 75th percentile assists in identifying that the total
number of values that are present fall under the 75 percentage of the overall observation group.
In general, they are termed as upper quartile. Herein, researcher aims at evaluating percentile to
identify the percentage value of collected information and under which group, it falls.
Percentile for Annual expenditure:
Value of percentile of 25th = 20.2
Value of percentile of 50th = 24.44
Value of percentile of 75th = 47.38
Quartile:
Quartile is used with an aim of dividing collected information into four different quarters.
In general terms, quartile is the term derived from quarter which means one fourth of something.
Therefore, quartile is a certain fourth of a given data (Morato, 2013). Furthermore, first quarter is
denoted as (Q1) which indicates the middle value between the smallest number and the median
of the defined set of data. While on the other hand, second quartile (Q2) can be defined as
median of entire data which is computed in the measure of central tendency. Whereas, third
9
quartile (Q3) refers to the mid value between the median and the highest value of a given set of
quantitative information (Weygandt and et.al, 2009).
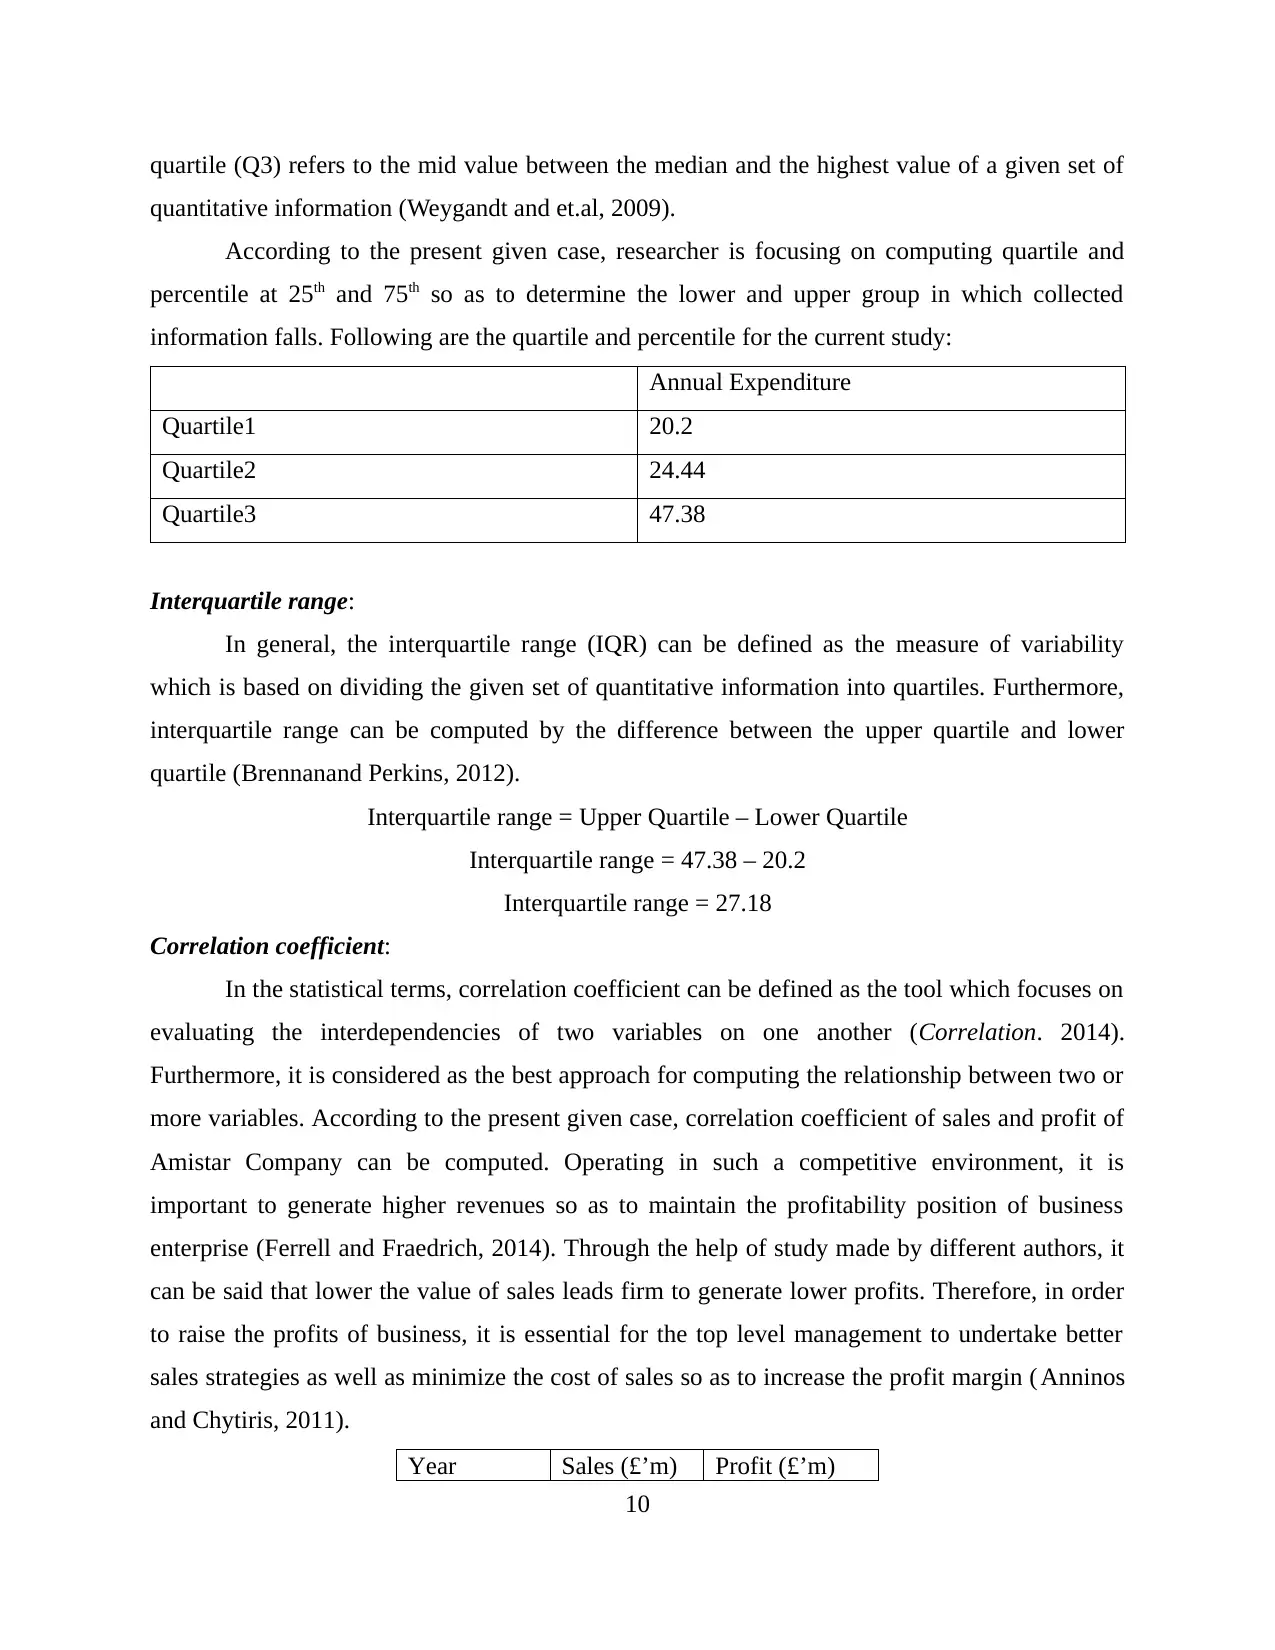
According to the present given case, researcher is focusing on computing quartile and
percentile at 25th and 75th so as to determine the lower and upper group in which collected
information falls. Following are the quartile and percentile for the current study:
Annual Expenditure
Quartile1 20.2
Quartile2 24.44
Quartile3 47.38
Interquartile range:
In general, the interquartile range (IQR) can be defined as the measure of variability
which is based on dividing the given set of quantitative information into quartiles. Furthermore,
interquartile range can be computed by the difference between the upper quartile and lower
quartile (Brennanand Perkins, 2012).
Interquartile range = Upper Quartile – Lower Quartile
Interquartile range = 47.38 – 20.2
Interquartile range = 27.18
Correlation coefficient:
In the statistical terms, correlation coefficient can be defined as the tool which focuses on
evaluating the interdependencies of two variables on one another (Correlation. 2014).
Furthermore, it is considered as the best approach for computing the relationship between two or
more variables. According to the present given case, correlation coefficient of sales and profit of
Amistar Company can be computed. Operating in such a competitive environment, it is
important to generate higher revenues so as to maintain the profitability position of business
enterprise (Ferrell and Fraedrich, 2014). Through the help of study made by different authors, it
can be said that lower the value of sales leads firm to generate lower profits. Therefore, in order
to raise the profits of business, it is essential for the top level management to undertake better
sales strategies as well as minimize the cost of sales so as to increase the profit margin ( Anninos
and Chytiris, 2011).
Year Sales (£’m) Profit (£’m)
10
quantitative information (Weygandt and et.al, 2009).
According to the present given case, researcher is focusing on computing quartile and
percentile at 25th and 75th so as to determine the lower and upper group in which collected
information falls. Following are the quartile and percentile for the current study:
Annual Expenditure
Quartile1 20.2
Quartile2 24.44
Quartile3 47.38
Interquartile range:
In general, the interquartile range (IQR) can be defined as the measure of variability
which is based on dividing the given set of quantitative information into quartiles. Furthermore,
interquartile range can be computed by the difference between the upper quartile and lower
quartile (Brennanand Perkins, 2012).
Interquartile range = Upper Quartile – Lower Quartile
Interquartile range = 47.38 – 20.2
Interquartile range = 27.18
Correlation coefficient:
In the statistical terms, correlation coefficient can be defined as the tool which focuses on
evaluating the interdependencies of two variables on one another (Correlation. 2014).
Furthermore, it is considered as the best approach for computing the relationship between two or
more variables. According to the present given case, correlation coefficient of sales and profit of
Amistar Company can be computed. Operating in such a competitive environment, it is
important to generate higher revenues so as to maintain the profitability position of business
enterprise (Ferrell and Fraedrich, 2014). Through the help of study made by different authors, it
can be said that lower the value of sales leads firm to generate lower profits. Therefore, in order
to raise the profits of business, it is essential for the top level management to undertake better
sales strategies as well as minimize the cost of sales so as to increase the profit margin ( Anninos
and Chytiris, 2011).
Year Sales (£’m) Profit (£’m)
10
⊘ This is a preview!⊘
Do you want full access?
Subscribe today to unlock all pages.
Trusted by 1+ million students worldwide
1 out of 27
Related Documents


Your All-in-One AI-Powered Toolkit for Academic Success.
+13062052269
info@desklib.com
Available 24*7 on WhatsApp / Email
![[object Object]](/_next/static/media/star-bottom.7253800d.svg)
Unlock your academic potential
Copyright © 2020–2026 A2Z Services. All Rights Reserved. Developed and managed by ZUCOL.