Business Decision Making Report: QAA Survey and Statistical Analysis
VerifiedAdded on 2020/06/03
|23
|4928
|389
Report
AI Summary
This report analyzes business decision-making processes for the UK College of Business and Computing, focusing on a survey conducted by the Quality Assurance Agency (QAA). The report outlines the planning and implementation of data collection, including the use of primary and secondary data, survey methodologies, and questionnaire design. It then presents the collected data, analyzes it using statistical tools such as mean, median, mode, and measures of dispersion. Furthermore, the report incorporates graphical representations and interprets the findings to provide insights and recommendations for the college. Finally, the report concludes with decision-making strategies utilizing information processing and financial tools, including identification of a critical path and financial viability analysis, to aid the college in strategic planning and future development.
Business Decision Making
Paraphrase This Document
Need a fresh take? Get an instant paraphrase of this document with our AI Paraphraser
Table of Contents
INTRODUCTION...........................................................................................................................1
TASK 1............................................................................................................................................1
1.1 Plan use for collecting primary and secondary data..............................................................1
1.2 Present survey methodology and sample framing used by QAA.........................................2
1.3 Questionnaire for business problem......................................................................................3
TASK 2............................................................................................................................................4
2.1 & 2.2 Information creation by representing value and analyse them ..................................4
2.3 Data analysis by using measure of dispersion.......................................................................7
2.4 Use of quartile, percentile and correlation coefficient..........................................................8
TASK 3............................................................................................................................................9
3.1 & 3.2 Graphs and interpretation............................................................................................9
3.3 Covered in power point.......................................................................................................16
3.4 Formal business report with suitable findings and recommendations................................16
TASK 4..........................................................................................................................................16
4.1 Decision making by using information processing tools....................................................16
4.2 Identification of critical path...............................................................................................17
4.3 Decisions making with the help of financial tools..............................................................18
CONCLUSION..............................................................................................................................19
REFERENCES .............................................................................................................................21

⊘ This is a preview!⊘
Do you want full access?
Subscribe today to unlock all pages.
Trusted by 1+ million students worldwide
INTRODUCTION
For any business it is compulsory for management to use data and information
which is related to their operation in taking effective decisions. Managers or researchers have to
gather all relevant sources of information which are associated with an organisation and then
evaluate them in formulating strategies (Barry and Edgman-Levitan, 2012). These schemes cater
long term benefit to a company by providing them strength in taking appropriate judgements. For
taking a decision, entities conduct a survey on different number of population for producing
goods and services. There are various kinds of survey methods used by a company in
implementing a powerful strategy for company. Present assignment is based on UK college of
business and computing who want to organise a survey on different groups of students of
institute and by using statistical tool . For this purpose, college authority gives this work to
Quality Assurance Agency who provide a data on various number of students. For making a
research better and effective, a proper plan has to be formulated with the help of questionnaire
and survey by different methods. Data which is collected through various methods have to get
summarised so that it become presentable in nature. At last, college use by consulting financial
statement, viability of their new project get analyse that is it beneficial for them or not.
TASK 1
1.1 Plan use for collecting primary and secondary data
Planning is an essential tool which every individual has to take in account. This provide a
framework on which all task and work is to be done appropriately (Brynjolfsson, Hitt and Kim,
2011). In business decision making, a person have to create a framework on which whole
research gets accomplished effectively. A perfect plan includes time duration in which the
investigation has to be done, various locations on which it is executed, methods, budget etc. All
these things are included in making a successful report. QAA have to create a plan which enables
them in collecting primary and secondary data. A perfect plan for conducting a research on
students are as follow:
1. Time duration: For any research, it is compulsory for an entity or an organisation to set a
time limit in which they have to complete the research process for collecting data. It
includes time limit of two days, three days or whatever time required.
1
Paraphrase This Document
Need a fresh take? Get an instant paraphrase of this document with our AI Paraphraser
2. Location: Majorly there are four main campuses established by the college all over the
UK and now they want to set up another one. For this they have to gather the information
from students. This factor is helpful for them because at different location they get
different views of students (Craft, 2013).
3. Methods to be used: There are various techniques that can be used by researcher to make
valid conclusion of data. But two mostly used approaches are qualitative and quantitative
techniques. By using these methods, it become easy for QAA to interpret data easily.
4. Types of data: There are various forms of data collection but some methods are widely
used and whole statistical data is around these survey methodologies. Some of them are:
Primary
Secondary
Qualitative
Quantitative
Essential component of every business is their budget. Management have to set a budget
in which they have to include all such cost which is important for them at the time of research.
For better and effective data collection, a plan has to be formulated by researcher in which all
these things have to be included. This make the research more effective.
1.2 Present survey methodology and sample framing used by QAA
Surveys are generally conducted on population for getting their views about a particular
situation. Methods are all such techniques which are used for collecting data from large number
of respondents (Cronan and et. al., 2011). For conducting a better survey there are various
number of techniques used by researcher in making effective outcome. The various kinds of
surveys methodologies are:
1. Questionnaire Few questions have asked to respondents on the basis of their experience
and satisfaction. This is one of a best technique to get the view point of various number
of people by selecting some from large number of population.
2. Interviews: Another major approach which enable in getting the adequate informations
from individual is interview. At the time of personal interview all the views and opinion
of a person get derived for concluding a beneficial decision for business. It incur more
and more cost as compared to others.
2
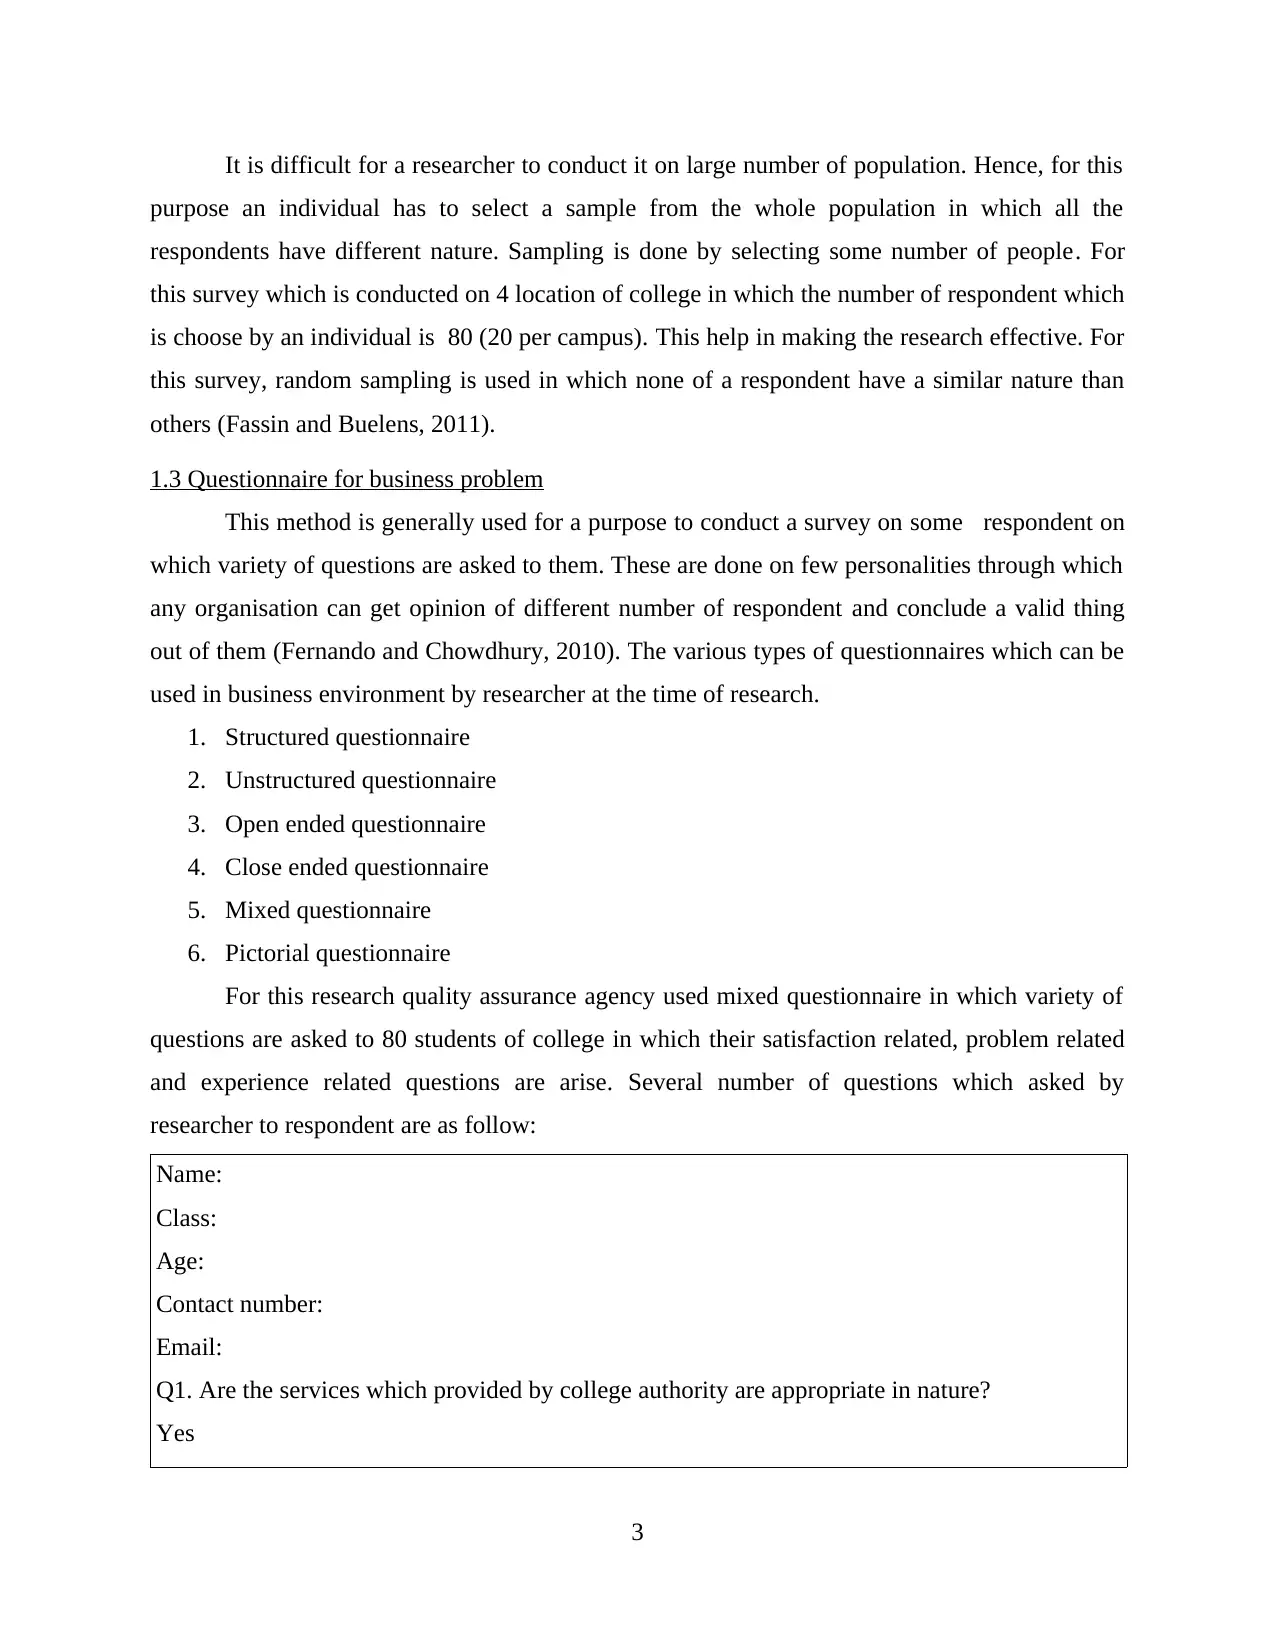
It is difficult for a researcher to conduct it on large number of population. Hence, for this
purpose an individual has to select a sample from the whole population in which all the
respondents have different nature. Sampling is done by selecting some number of people. For
this survey which is conducted on 4 location of college in which the number of respondent which
is choose by an individual is 80 (20 per campus). This help in making the research effective. For
this survey, random sampling is used in which none of a respondent have a similar nature than
others (Fassin and Buelens, 2011).
1.3 Questionnaire for business problem
This method is generally used for a purpose to conduct a survey on some respondent on
which variety of questions are asked to them. These are done on few personalities through which
any organisation can get opinion of different number of respondent and conclude a valid thing
out of them (Fernando and Chowdhury, 2010). The various types of questionnaires which can be
used in business environment by researcher at the time of research.
1. Structured questionnaire
2. Unstructured questionnaire
3. Open ended questionnaire
4. Close ended questionnaire
5. Mixed questionnaire
6. Pictorial questionnaire
For this research quality assurance agency used mixed questionnaire in which variety of
questions are asked to 80 students of college in which their satisfaction related, problem related
and experience related questions are arise. Several number of questions which asked by
researcher to respondent are as follow:
Name:
Class:
Age:
Contact number:
Email:
Q1. Are the services which provided by college authority are appropriate in nature?
Yes
3
⊘ This is a preview!⊘
Do you want full access?
Subscribe today to unlock all pages.
Trusted by 1+ million students worldwide
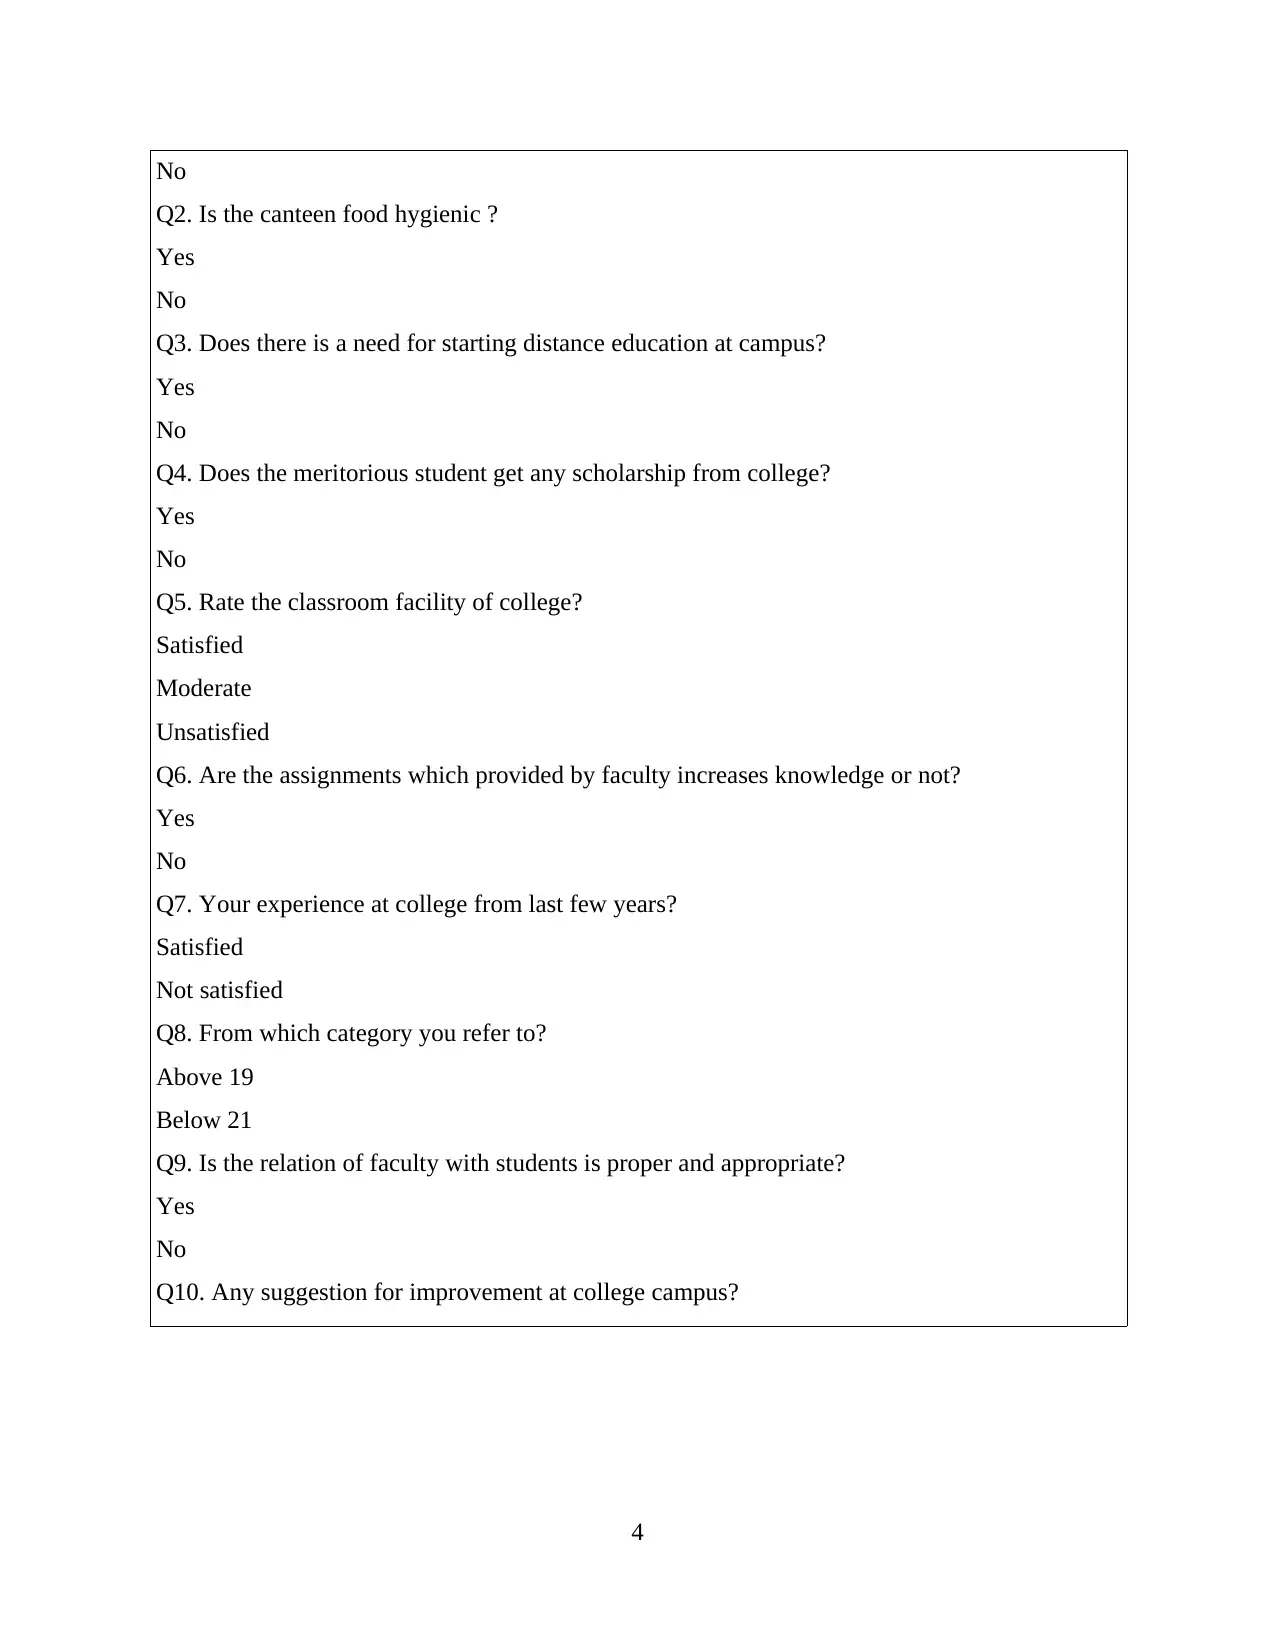
No
Q2. Is the canteen food hygienic ?
Yes
No
Q3. Does there is a need for starting distance education at campus?
Yes
No
Q4. Does the meritorious student get any scholarship from college?
Yes
No
Q5. Rate the classroom facility of college?
Satisfied
Moderate
Unsatisfied
Q6. Are the assignments which provided by faculty increases knowledge or not?
Yes
No
Q7. Your experience at college from last few years?
Satisfied
Not satisfied
Q8. From which category you refer to?
Above 19
Below 21
Q9. Is the relation of faculty with students is proper and appropriate?
Yes
No
Q10. Any suggestion for improvement at college campus?
4
Paraphrase This Document
Need a fresh take? Get an instant paraphrase of this document with our AI Paraphraser
TASK 2
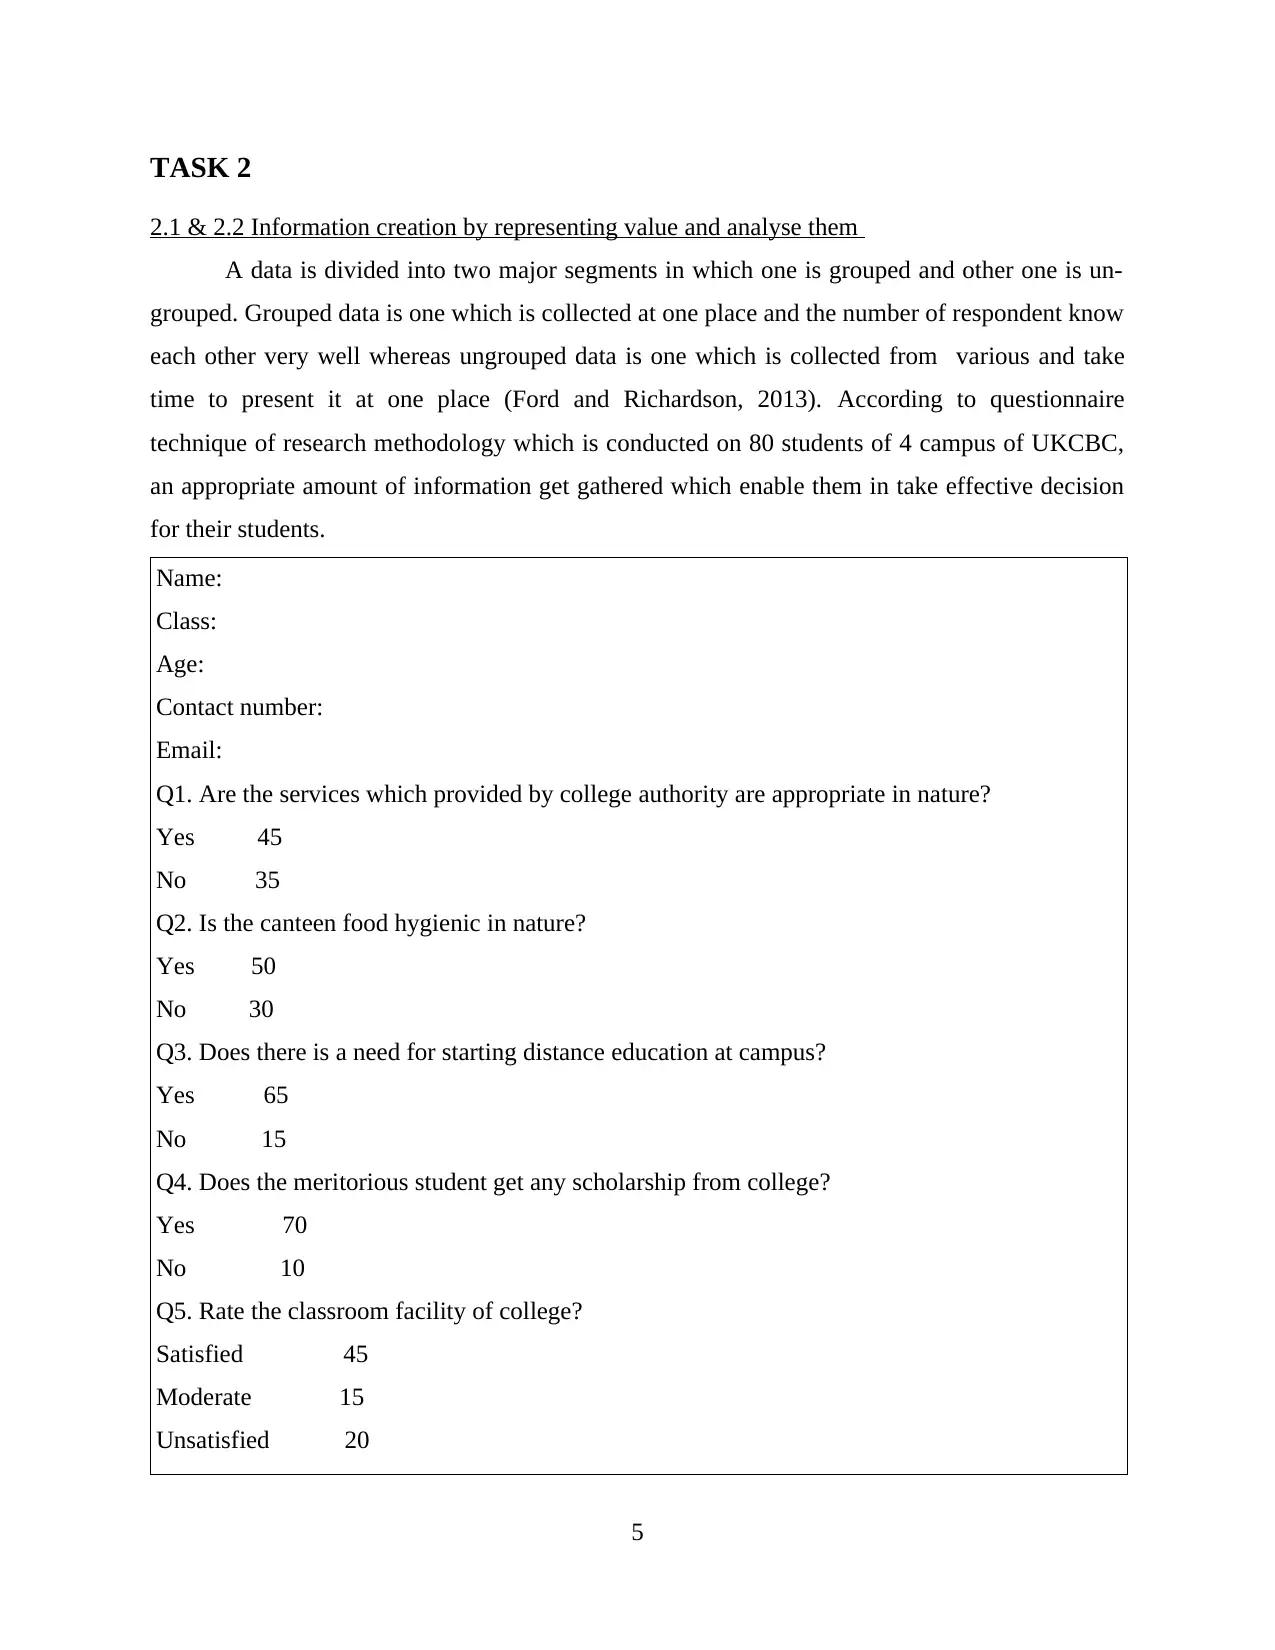
2.1 & 2.2 Information creation by representing value and analyse them
A data is divided into two major segments in which one is grouped and other one is un-
grouped. Grouped data is one which is collected at one place and the number of respondent know
each other very well whereas ungrouped data is one which is collected from various and take
time to present it at one place (Ford and Richardson, 2013). According to questionnaire
technique of research methodology which is conducted on 80 students of 4 campus of UKCBC,
an appropriate amount of information get gathered which enable them in take effective decision
for their students.
Name:
Class:
Age:
Contact number:
Email:
Q1. Are the services which provided by college authority are appropriate in nature?
Yes 45
No 35
Q2. Is the canteen food hygienic in nature?
Yes 50
No 30
Q3. Does there is a need for starting distance education at campus?
Yes 65
No 15
Q4. Does the meritorious student get any scholarship from college?
Yes 70
No 10
Q5. Rate the classroom facility of college?
Satisfied 45
Moderate 15
Unsatisfied 20
5
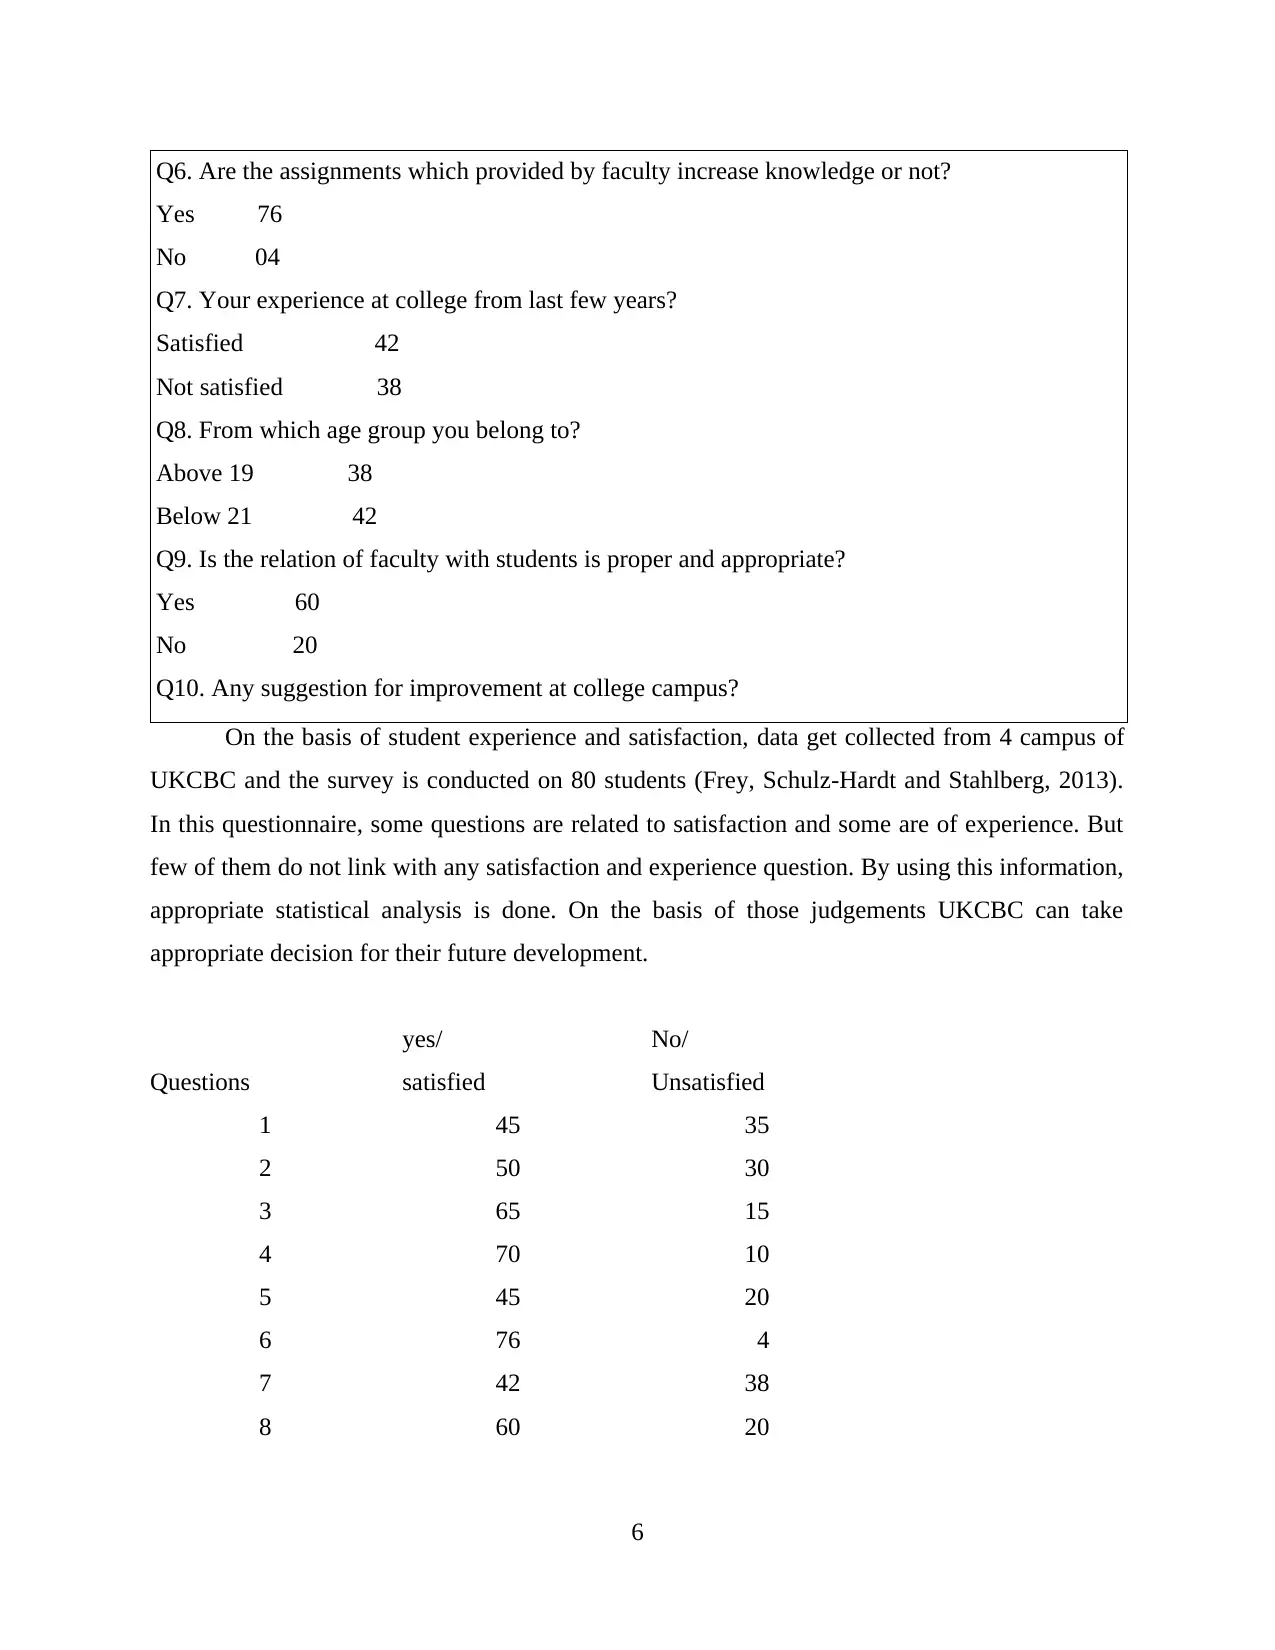
Q6. Are the assignments which provided by faculty increase knowledge or not?
Yes 76
No 04
Q7. Your experience at college from last few years?
Satisfied 42
Not satisfied 38
Q8. From which age group you belong to?
Above 19 38
Below 21 42
Q9. Is the relation of faculty with students is proper and appropriate?
Yes 60
No 20
Q10. Any suggestion for improvement at college campus?
On the basis of student experience and satisfaction, data get collected from 4 campus of
UKCBC and the survey is conducted on 80 students (Frey, Schulz-Hardt and Stahlberg, 2013).
In this questionnaire, some questions are related to satisfaction and some are of experience. But
few of them do not link with any satisfaction and experience question. By using this information,
appropriate statistical analysis is done. On the basis of those judgements UKCBC can take
appropriate decision for their future development.
Questions
yes/
satisfied
No/
Unsatisfied
1 45 35
2 50 30
3 65 15
4 70 10
5 45 20
6 76 4
7 42 38
8 60 20
6
⊘ This is a preview!⊘
Do you want full access?
Subscribe today to unlock all pages.
Trusted by 1+ million students worldwide
Mean 56.625 21.5
Median 55 20
Mode 45 20
Kurtosis
-
1.6485188
297
-
1.1987864
988
Skewness
0.3314576
39
0.0443784
379
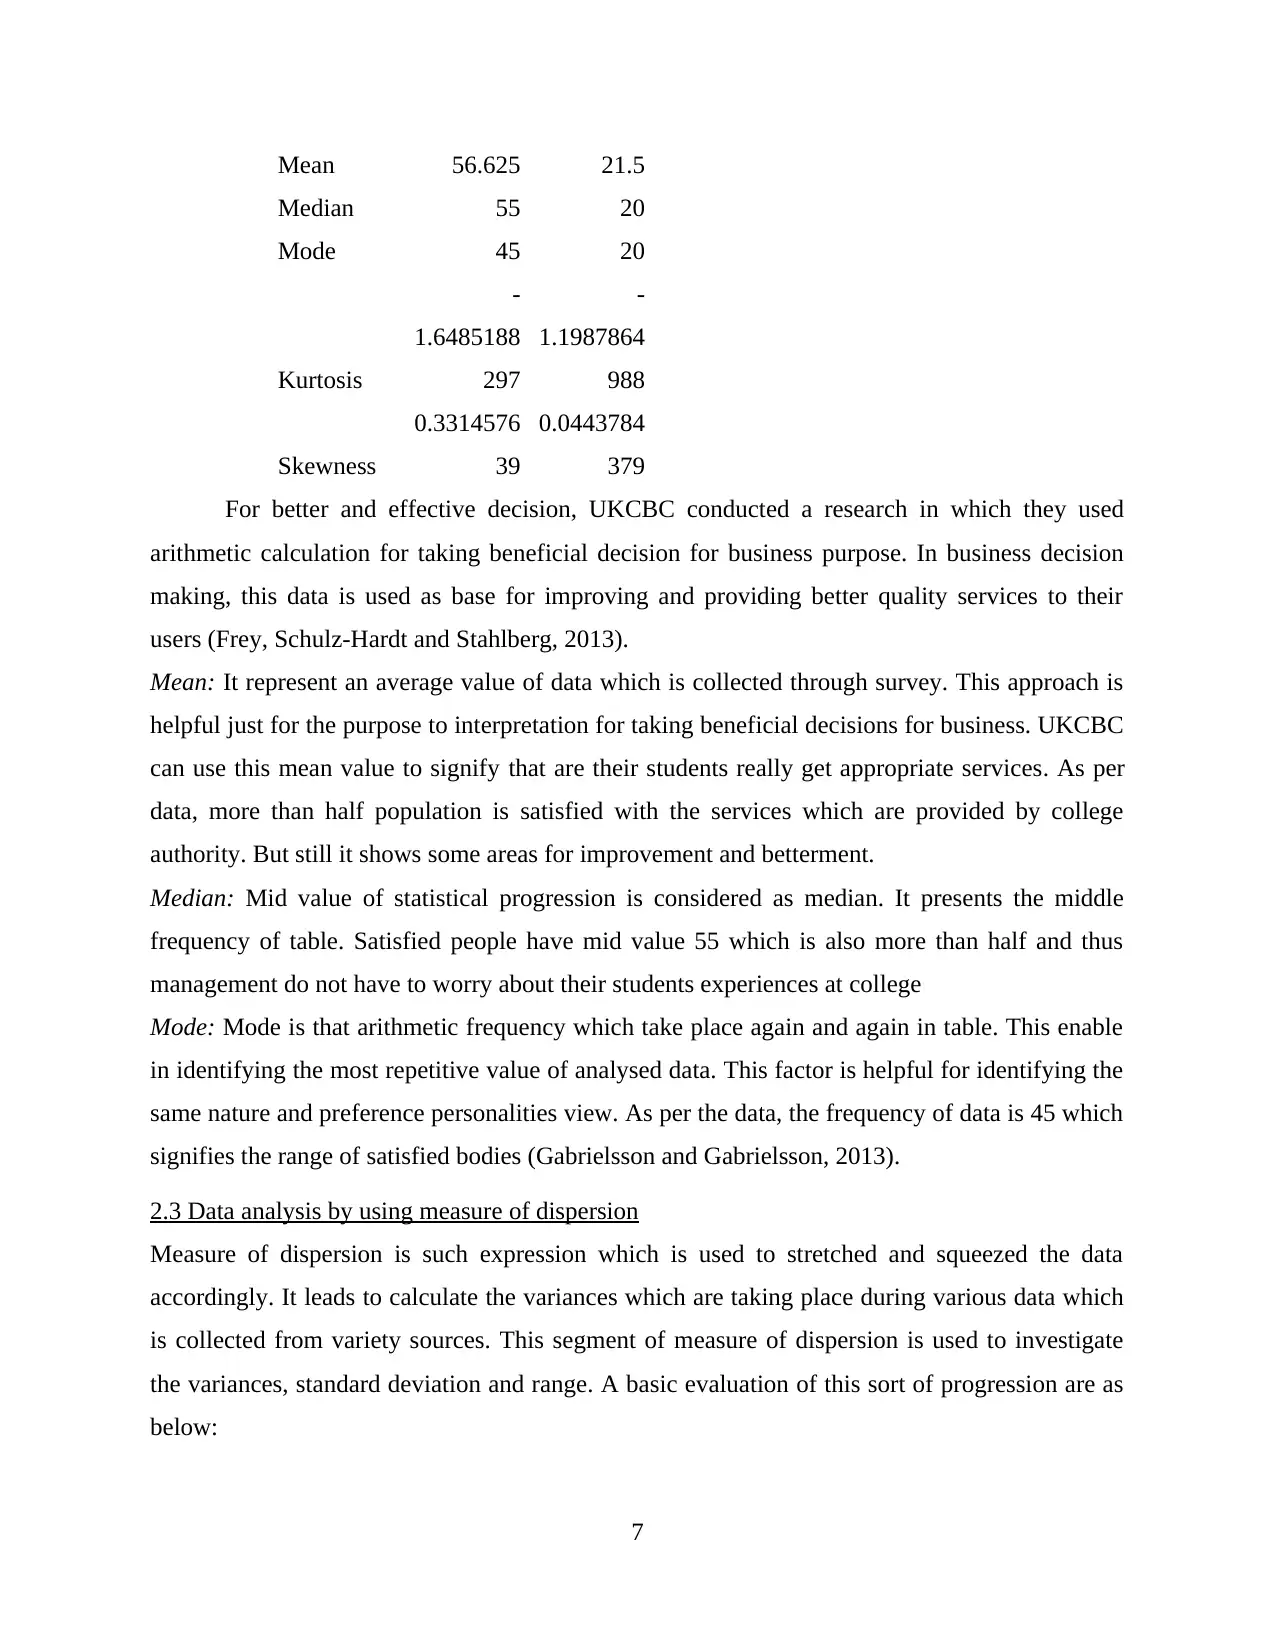
For better and effective decision, UKCBC conducted a research in which they used
arithmetic calculation for taking beneficial decision for business purpose. In business decision
making, this data is used as base for improving and providing better quality services to their
users (Frey, Schulz-Hardt and Stahlberg, 2013).
Mean: It represent an average value of data which is collected through survey. This approach is
helpful just for the purpose to interpretation for taking beneficial decisions for business. UKCBC
can use this mean value to signify that are their students really get appropriate services. As per
data, more than half population is satisfied with the services which are provided by college
authority. But still it shows some areas for improvement and betterment.
Median: Mid value of statistical progression is considered as median. It presents the middle
frequency of table. Satisfied people have mid value 55 which is also more than half and thus
management do not have to worry about their students experiences at college
Mode: Mode is that arithmetic frequency which take place again and again in table. This enable
in identifying the most repetitive value of analysed data. This factor is helpful for identifying the
same nature and preference personalities view. As per the data, the frequency of data is 45 which
signifies the range of satisfied bodies (Gabrielsson and Gabrielsson, 2013).
2.3 Data analysis by using measure of dispersion
Measure of dispersion is such expression which is used to stretched and squeezed the data
accordingly. It leads to calculate the variances which are taking place during various data which
is collected from variety sources. This segment of measure of dispersion is used to investigate
the variances, standard deviation and range. A basic evaluation of this sort of progression are as
below:
7
Median 55 20
Mode 45 20
Kurtosis
-
1.6485188
297
-
1.1987864
988
Skewness
0.3314576
39
0.0443784
379
For better and effective decision, UKCBC conducted a research in which they used
arithmetic calculation for taking beneficial decision for business purpose. In business decision
making, this data is used as base for improving and providing better quality services to their
users (Frey, Schulz-Hardt and Stahlberg, 2013).
Mean: It represent an average value of data which is collected through survey. This approach is
helpful just for the purpose to interpretation for taking beneficial decisions for business. UKCBC
can use this mean value to signify that are their students really get appropriate services. As per
data, more than half population is satisfied with the services which are provided by college
authority. But still it shows some areas for improvement and betterment.
Median: Mid value of statistical progression is considered as median. It presents the middle
frequency of table. Satisfied people have mid value 55 which is also more than half and thus
management do not have to worry about their students experiences at college
Mode: Mode is that arithmetic frequency which take place again and again in table. This enable
in identifying the most repetitive value of analysed data. This factor is helpful for identifying the
same nature and preference personalities view. As per the data, the frequency of data is 45 which
signifies the range of satisfied bodies (Gabrielsson and Gabrielsson, 2013).
2.3 Data analysis by using measure of dispersion
Measure of dispersion is such expression which is used to stretched and squeezed the data
accordingly. It leads to calculate the variances which are taking place during various data which
is collected from variety sources. This segment of measure of dispersion is used to investigate
the variances, standard deviation and range. A basic evaluation of this sort of progression are as
below:
7
Paraphrase This Document
Need a fresh take? Get an instant paraphrase of this document with our AI Paraphraser
Questions
yes/
satisfied
No/
Unsatisfied
1 45 35
2 50 30
3 65 15
4 70 10
5 45 20
6 76 4
7 42 38
8 60 20
Mean 56.625 21.5
Median 55 20
Mode 45 20
Kurtosis
-
1.6485188
297
-
1.1987864
988
Skewness
0.3314576
39
0.0443784
379
Range Upper Lower
standard
deviation
12.894489
4099
76 42
Correlation
coefficient
-
0.9117428
631
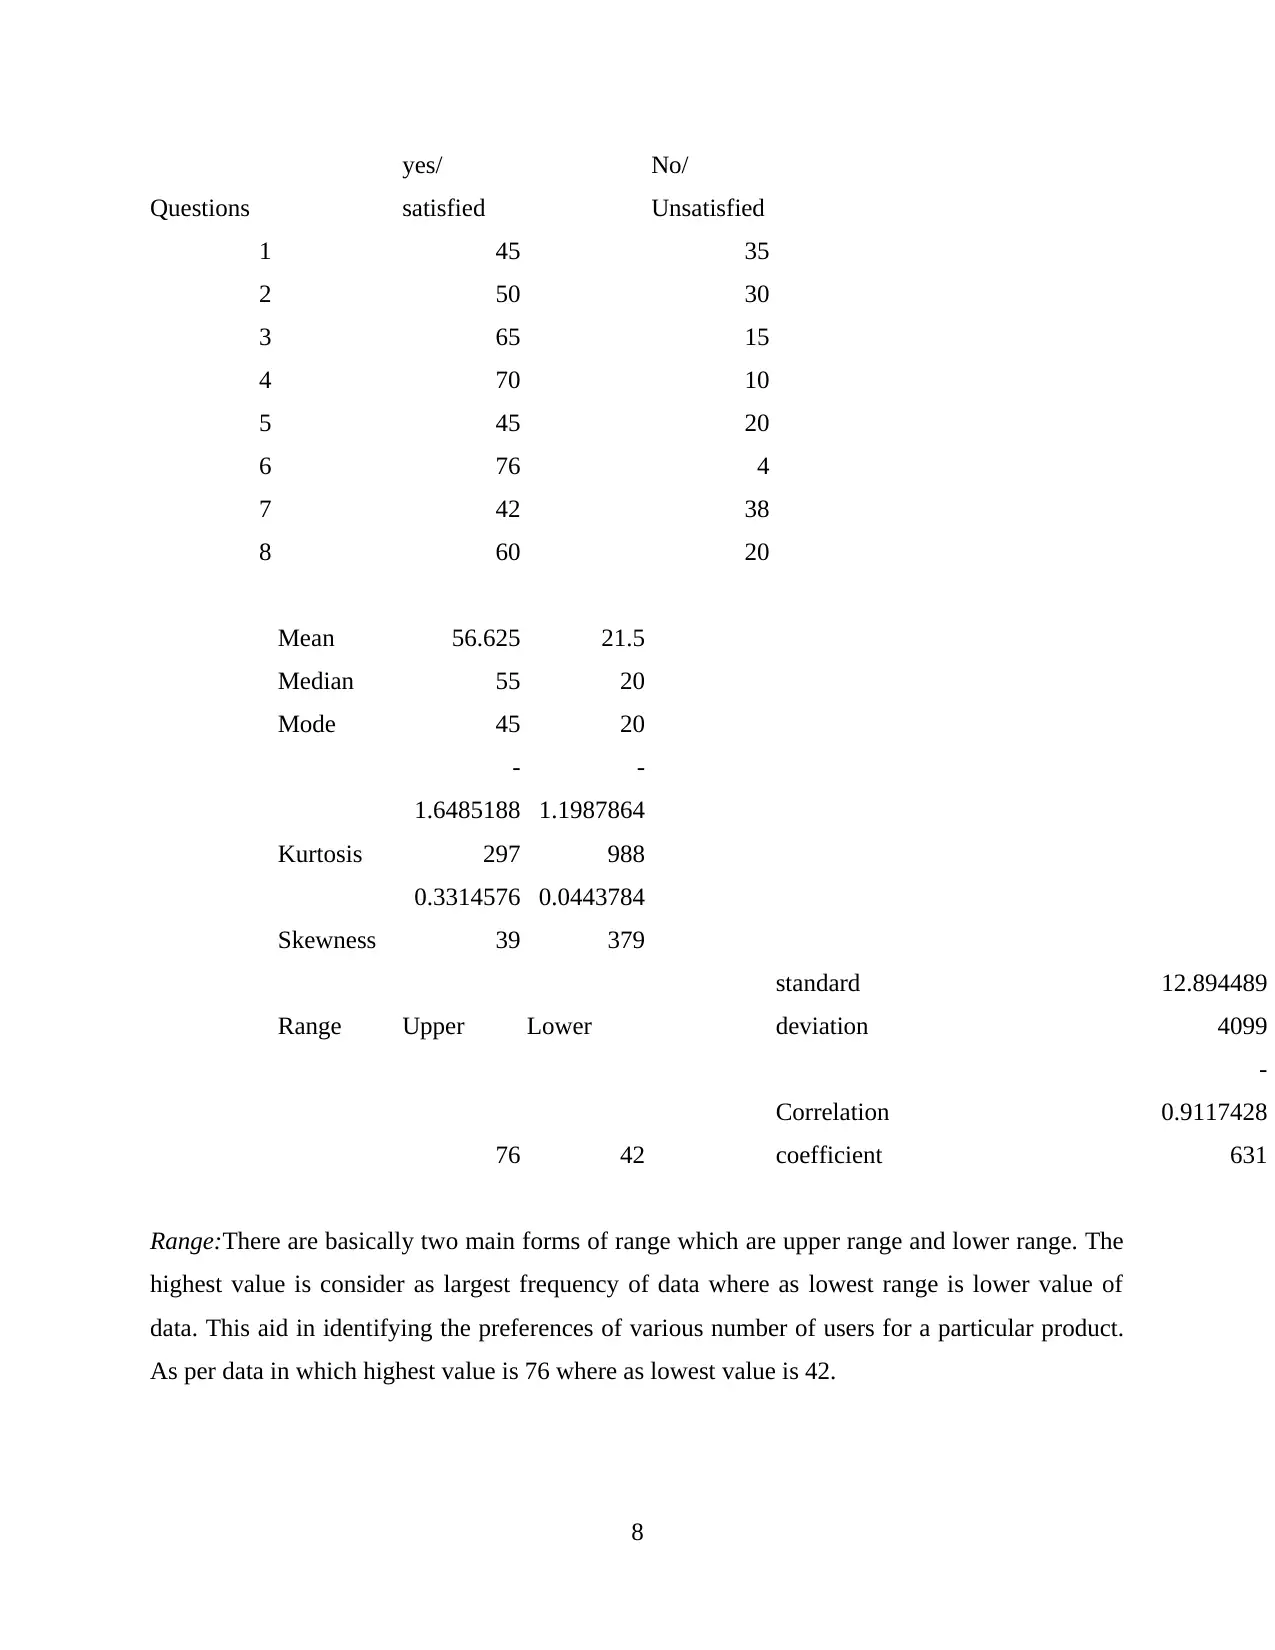
Range:There are basically two main forms of range which are upper range and lower range. The
highest value is consider as largest frequency of data where as lowest range is lower value of
data. This aid in identifying the preferences of various number of users for a particular product.
As per data in which highest value is 76 where as lowest value is 42.
8
yes/
satisfied
No/
Unsatisfied
1 45 35
2 50 30
3 65 15
4 70 10
5 45 20
6 76 4
7 42 38
8 60 20
Mean 56.625 21.5
Median 55 20
Mode 45 20
Kurtosis
-
1.6485188
297
-
1.1987864
988
Skewness
0.3314576
39
0.0443784
379
Range Upper Lower
standard
deviation
12.894489
4099
76 42
Correlation
coefficient
-
0.9117428
631
Range:There are basically two main forms of range which are upper range and lower range. The
highest value is consider as largest frequency of data where as lowest range is lower value of
data. This aid in identifying the preferences of various number of users for a particular product.
As per data in which highest value is 76 where as lowest value is 42.
8
Standard deviation: In a data, all respondents have different opinion about each and every
questions. This enable in identifying that all users do not have same thoughts. As per data 12 is a
deviations between all mean value of frequency (García-Peñalvo and Conde, 2014).
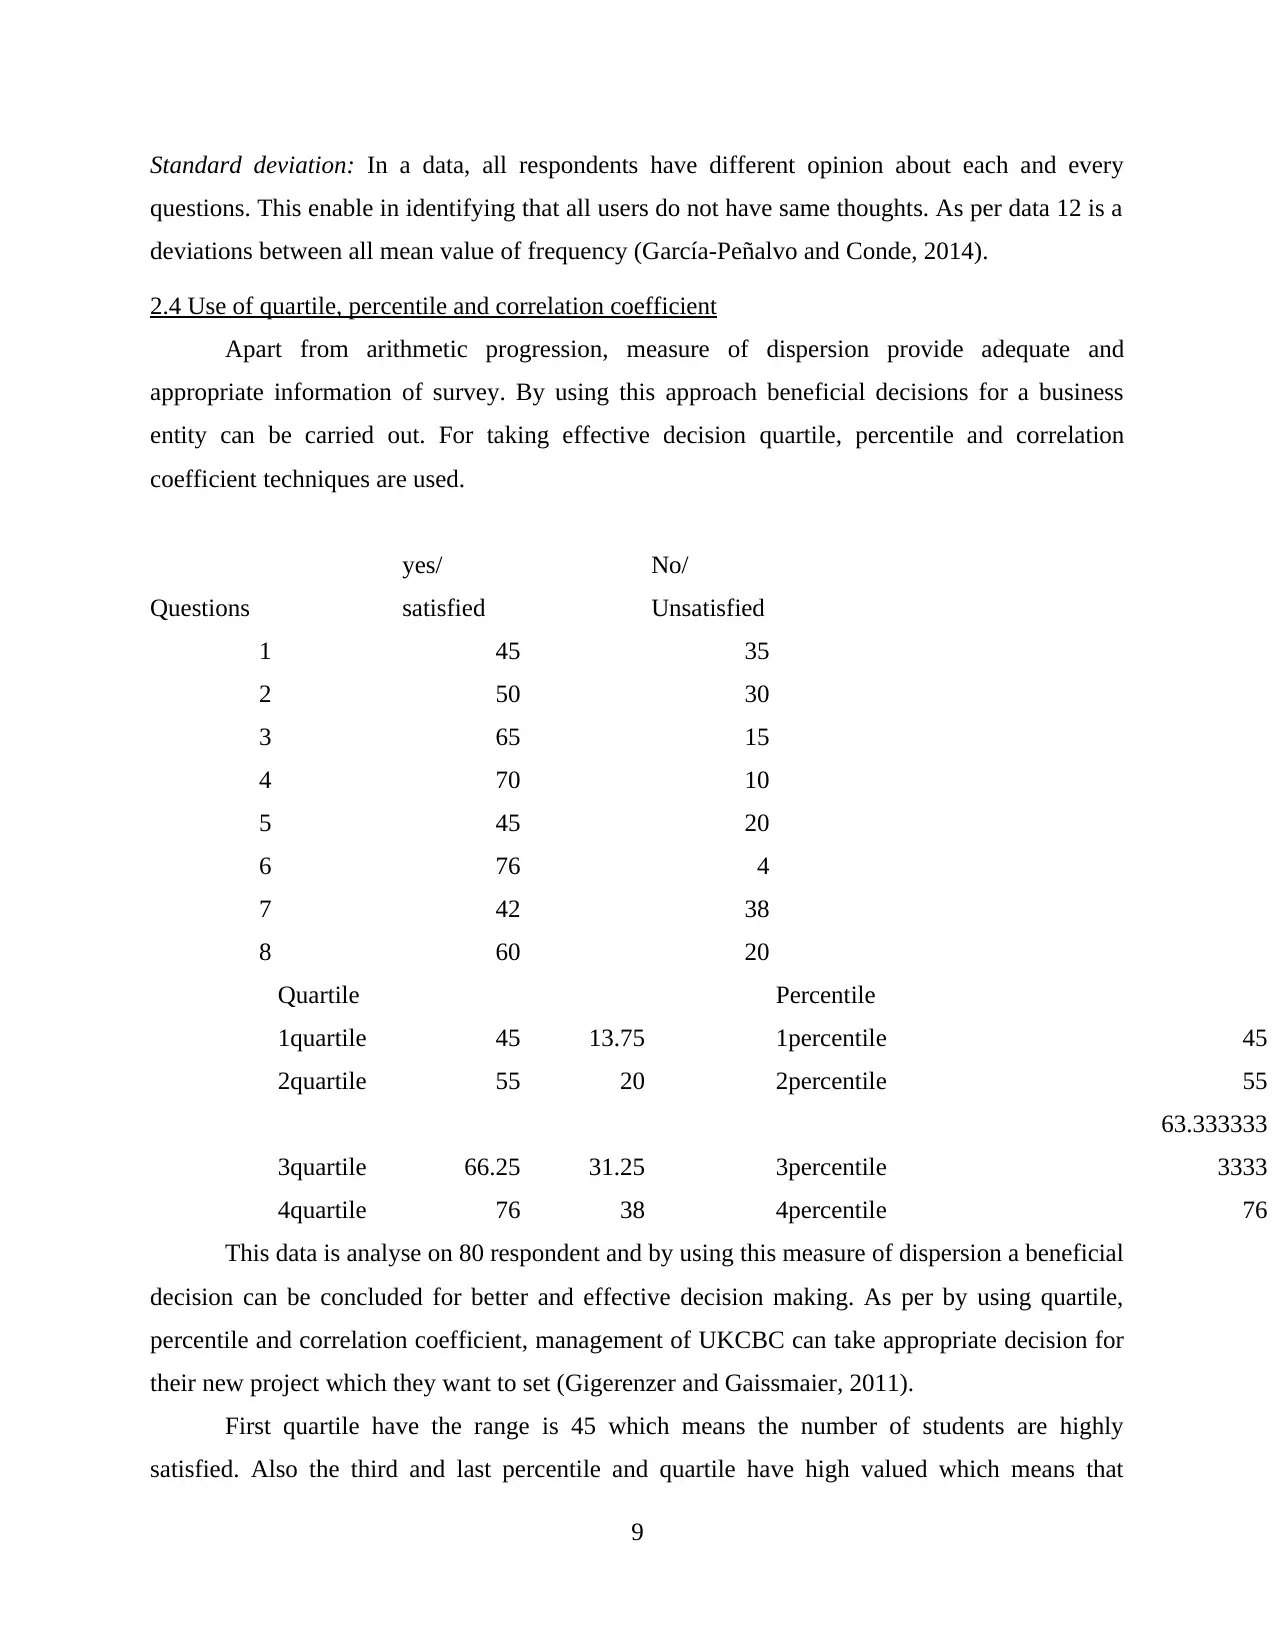
2.4 Use of quartile, percentile and correlation coefficient
Apart from arithmetic progression, measure of dispersion provide adequate and
appropriate information of survey. By using this approach beneficial decisions for a business
entity can be carried out. For taking effective decision quartile, percentile and correlation
coefficient techniques are used.
Questions
yes/
satisfied
No/
Unsatisfied
1 45 35
2 50 30
3 65 15
4 70 10
5 45 20
6 76 4
7 42 38
8 60 20
Quartile Percentile
1quartile 45 13.75 1percentile 45
2quartile 55 20 2percentile 55
3quartile 66.25 31.25 3percentile
63.333333
3333
4quartile 76 38 4percentile 76
This data is analyse on 80 respondent and by using this measure of dispersion a beneficial
decision can be concluded for better and effective decision making. As per by using quartile,
percentile and correlation coefficient, management of UKCBC can take appropriate decision for
their new project which they want to set (Gigerenzer and Gaissmaier, 2011).
First quartile have the range is 45 which means the number of students are highly
satisfied. Also the third and last percentile and quartile have high valued which means that
9
questions. This enable in identifying that all users do not have same thoughts. As per data 12 is a
deviations between all mean value of frequency (García-Peñalvo and Conde, 2014).
2.4 Use of quartile, percentile and correlation coefficient
Apart from arithmetic progression, measure of dispersion provide adequate and
appropriate information of survey. By using this approach beneficial decisions for a business
entity can be carried out. For taking effective decision quartile, percentile and correlation
coefficient techniques are used.
Questions
yes/
satisfied
No/
Unsatisfied
1 45 35
2 50 30
3 65 15
4 70 10
5 45 20
6 76 4
7 42 38
8 60 20
Quartile Percentile
1quartile 45 13.75 1percentile 45
2quartile 55 20 2percentile 55
3quartile 66.25 31.25 3percentile
63.333333
3333
4quartile 76 38 4percentile 76
This data is analyse on 80 respondent and by using this measure of dispersion a beneficial
decision can be concluded for better and effective decision making. As per by using quartile,
percentile and correlation coefficient, management of UKCBC can take appropriate decision for
their new project which they want to set (Gigerenzer and Gaissmaier, 2011).
First quartile have the range is 45 which means the number of students are highly
satisfied. Also the third and last percentile and quartile have high valued which means that
9
⊘ This is a preview!⊘
Do you want full access?
Subscribe today to unlock all pages.
Trusted by 1+ million students worldwide
1 out of 23
Related Documents


Your All-in-One AI-Powered Toolkit for Academic Success.
+13062052269
info@desklib.com
Available 24*7 on WhatsApp / Email
![[object Object]](/_next/static/media/star-bottom.7253800d.svg)
Unlock your academic potential
Copyright © 2020–2026 A2Z Services. All Rights Reserved. Developed and managed by ZUCOL.