Business Decision Making: Comprehensive Report on Amistar Fungicide
VerifiedAdded on 2020/02/03
|22
|3922
|27
Report
AI Summary
This report presents a comprehensive analysis of business decision-making processes related to the fungicide Amistar. It begins with an introduction outlining the scope of the study and its objectives. Task 1 focuses on the collection of primary and secondary data, detailing the methods used, including questionnaires and sampling techniques. Task 2 delves into statistical analysis, including the computation of mean, median, mode, measures of dispersion, quartiles, percentiles, and correlation coefficients, with detailed interpretations of the results. Task 3 involves graphical representations of data, trend analysis, and the drawing of conclusions, supported by charts illustrating sales, costs, and profits. Task 4 explores information processing tools, network diagrams, and project evaluation methods, including payback period, average rate of return, net present value, and internal rate of return, to assess the most profitable project. The report concludes with a summary of findings and references used.

BUSINESS DECISION MAKING
Paraphrase This Document
Need a fresh take? Get an instant paraphrase of this document with our AI Paraphraser
TABLE OF CONTENTS
INTRODUCTION....................................................................................................................................3
TASK 1....................................................................................................................................................3
1.1 Collection of primary and secondary data......................................................................................3
1.2 Sampling methods and survey methodology..................................................................................4
1.3 Questionnaire for study..................................................................................................................5
TASK 2....................................................................................................................................................6
2.1 Computation of mean median and mode........................................................................................6
2.2 Analysis of results..........................................................................................................................7
2.3 Measures of dispersion...................................................................................................................8
2.4 Quartile, percentile and correlation coefficient...............................................................................8
TASK 3..................................................................................................................................................10
3.1 Produce graphs and draw conclusions..........................................................................................10
3.2 Trend analysis chart......................................................................................................................12
3.3 Covered in PPT............................................................................................................................13
3.4 Formal business report.................................................................................................................13
TASK 4..................................................................................................................................................14
4.1 Information processing tools........................................................................................................14
4.2 Network diagram..........................................................................................................................15
4.3 Project evaluation.........................................................................................................................16
CONCLUSION......................................................................................................................................17
REFERENCES.......................................................................................................................................19
Figure 1 Calculation of mean...................................................................................................................7
Figure 2 Calculation of median................................................................................................................7
Figure 3 Calculation of mode...................................................................................................................8
Figure 4 Formula of Skewness.................................................................................................................9
Figure 5Calculation of standard deviation..............................................................................................10
Figure 6 Charting on firm sales..............................................................................................................12
Figure 7 Charting on cost.......................................................................................................................12
Figure 8 Charting on profit.....................................................................................................................13
Figure 9 Sales trend analysis chart.........................................................................................................14
Figure 10 Trend analysis chart of profit.................................................................................................14
Figure 11 GANTT chart.........................................................................................................................17
Figure 12Network diagram.....................................................................................................................17
Figure 13 Payback period method..........................................................................................................18
Figure 14 Average rate of return............................................................................................................18
Figure 15 Net present value....................................................................................................................19
Figure 16 Internal rate of return.............................................................................................................19
Table 5 Calculation of quartile and percentile........................................................................................10
⊘ This is a preview!⊘
Do you want full access?
Subscribe today to unlock all pages.
Trusted by 1+ million students worldwide
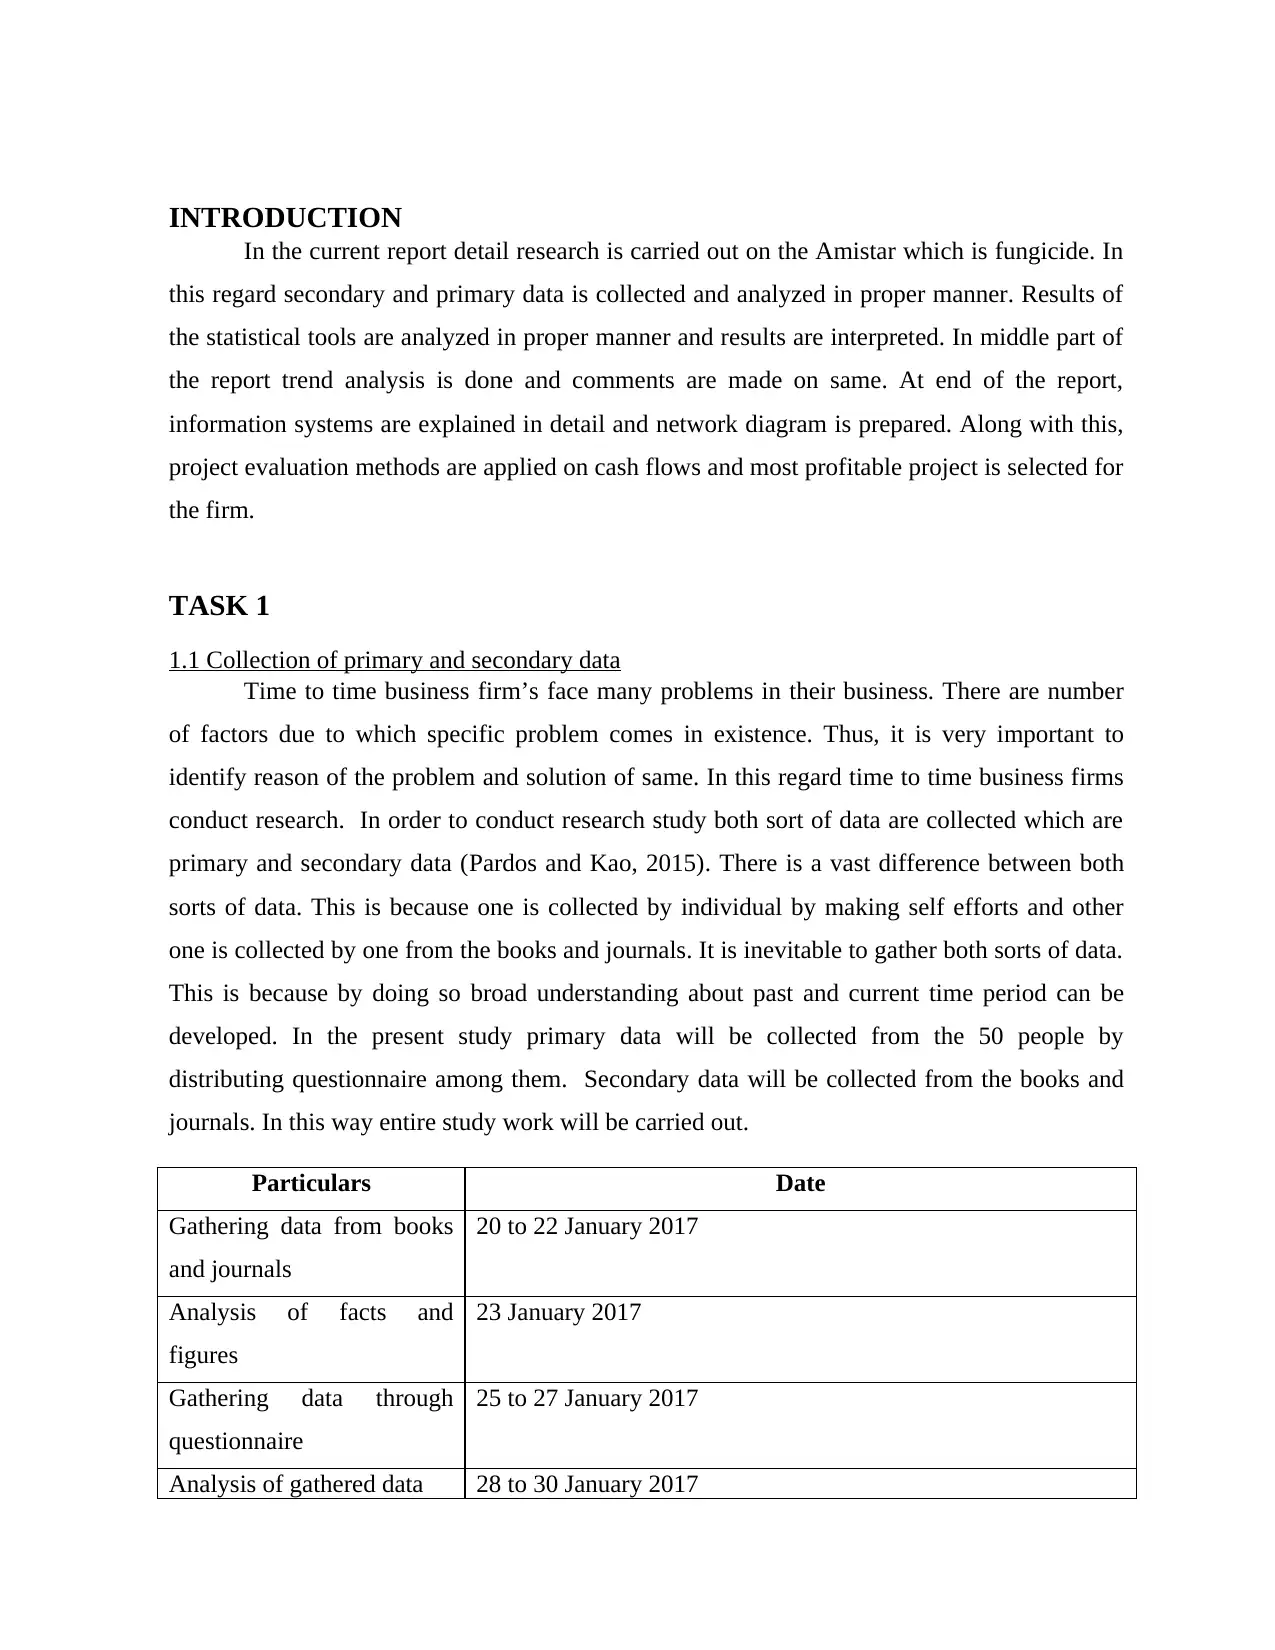
INTRODUCTION
In the current report detail research is carried out on the Amistar which is fungicide. In
this regard secondary and primary data is collected and analyzed in proper manner. Results of
the statistical tools are analyzed in proper manner and results are interpreted. In middle part of
the report trend analysis is done and comments are made on same. At end of the report,
information systems are explained in detail and network diagram is prepared. Along with this,
project evaluation methods are applied on cash flows and most profitable project is selected for
the firm.
TASK 1
1.1 Collection of primary and secondary data
Time to time business firm’s face many problems in their business. There are number
of factors due to which specific problem comes in existence. Thus, it is very important to
identify reason of the problem and solution of same. In this regard time to time business firms
conduct research. In order to conduct research study both sort of data are collected which are
primary and secondary data (Pardos and Kao, 2015). There is a vast difference between both
sorts of data. This is because one is collected by individual by making self efforts and other
one is collected by one from the books and journals. It is inevitable to gather both sorts of data.
This is because by doing so broad understanding about past and current time period can be
developed. In the present study primary data will be collected from the 50 people by
distributing questionnaire among them. Secondary data will be collected from the books and
journals. In this way entire study work will be carried out.
Particulars Date
Gathering data from books
and journals
20 to 22 January 2017
Analysis of facts and
figures
23 January 2017
Gathering data through
questionnaire
25 to 27 January 2017
Analysis of gathered data 28 to 30 January 2017
Paraphrase This Document
Need a fresh take? Get an instant paraphrase of this document with our AI Paraphraser
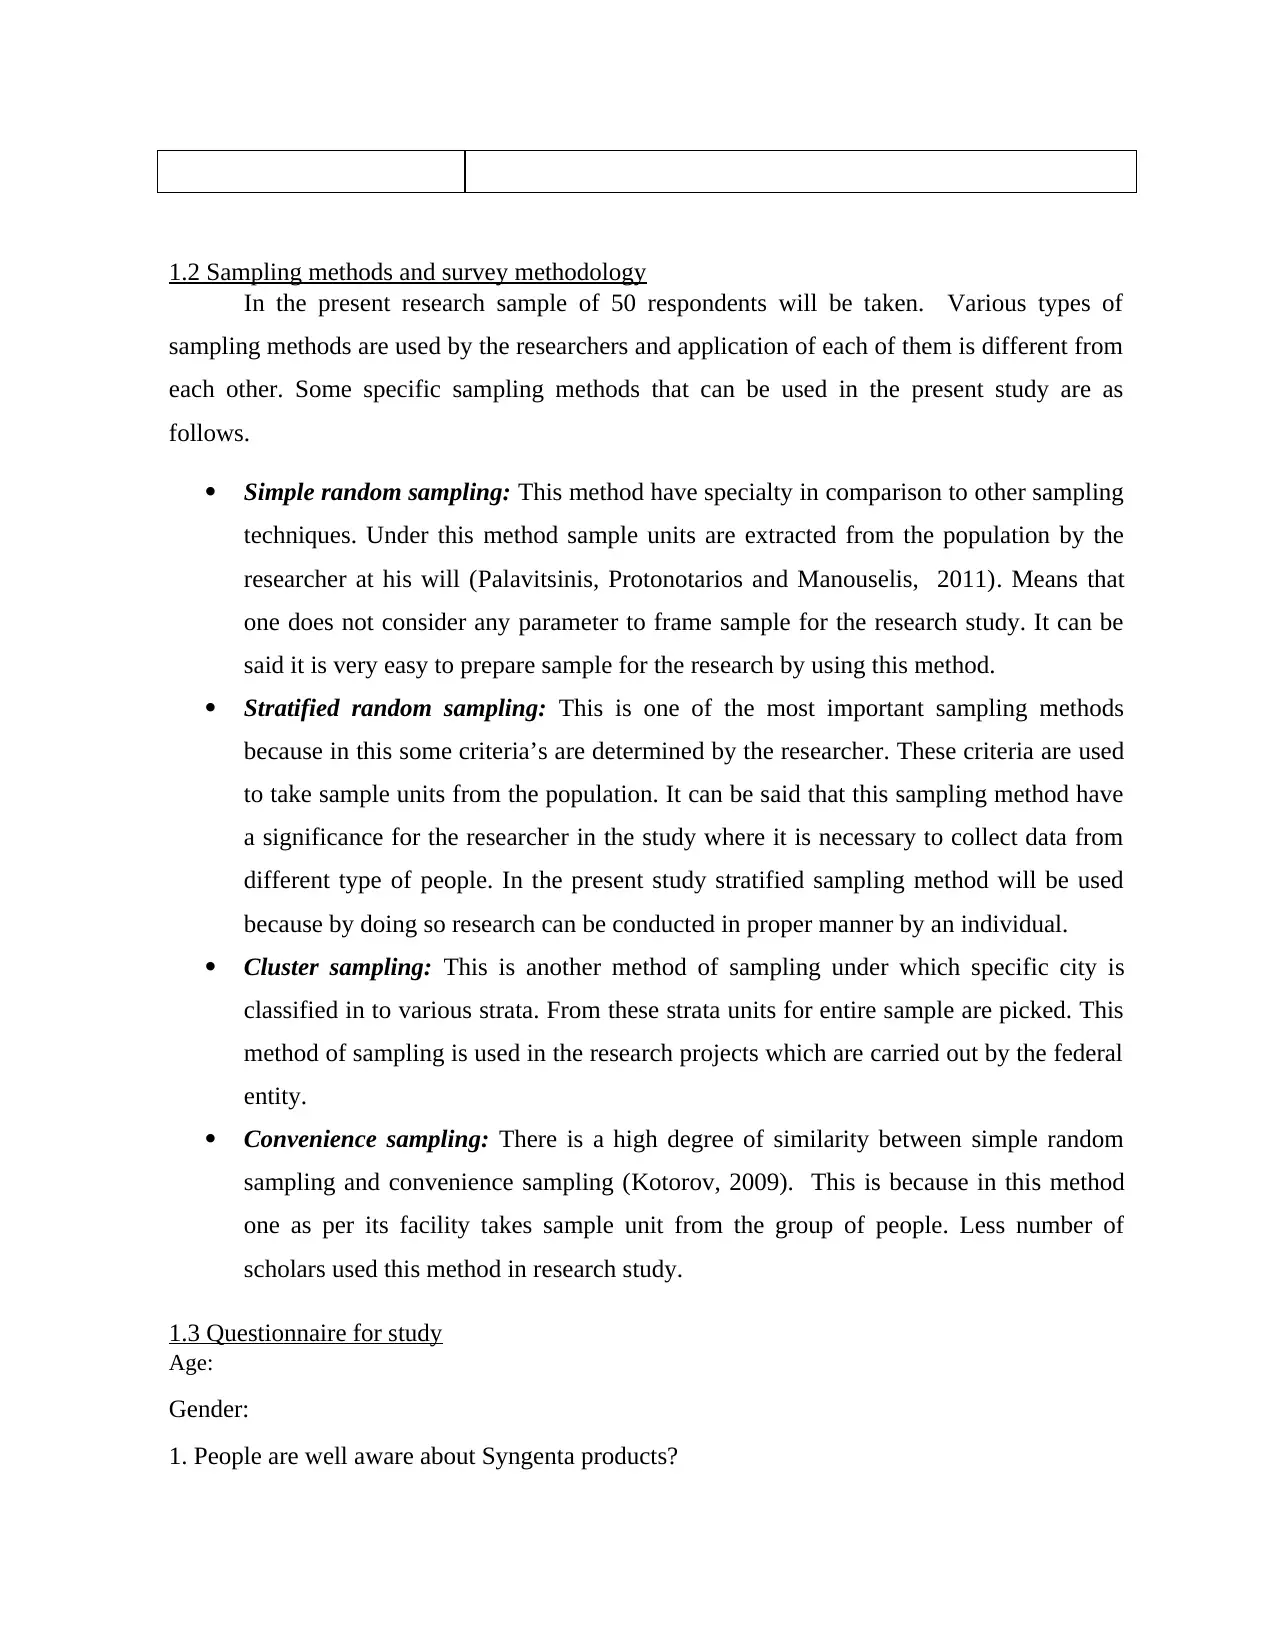
1.2 Sampling methods and survey methodology
In the present research sample of 50 respondents will be taken. Various types of
sampling methods are used by the researchers and application of each of them is different from
each other. Some specific sampling methods that can be used in the present study are as
follows.
Simple random sampling: This method have specialty in comparison to other sampling
techniques. Under this method sample units are extracted from the population by the
researcher at his will (Palavitsinis, Protonotarios and Manouselis, 2011). Means that
one does not consider any parameter to frame sample for the research study. It can be
said it is very easy to prepare sample for the research by using this method.
Stratified random sampling: This is one of the most important sampling methods
because in this some criteria’s are determined by the researcher. These criteria are used
to take sample units from the population. It can be said that this sampling method have
a significance for the researcher in the study where it is necessary to collect data from
different type of people. In the present study stratified sampling method will be used
because by doing so research can be conducted in proper manner by an individual.
Cluster sampling: This is another method of sampling under which specific city is
classified in to various strata. From these strata units for entire sample are picked. This
method of sampling is used in the research projects which are carried out by the federal
entity.
Convenience sampling: There is a high degree of similarity between simple random
sampling and convenience sampling (Kotorov, 2009). This is because in this method
one as per its facility takes sample unit from the group of people. Less number of
scholars used this method in research study.
1.3 Questionnaire for study
Age:
Gender:
1. People are well aware about Syngenta products?
Yes
No
2. Syngenta products are doing well in respect eliminating pest from plantations?
Yes
No
3. There are some factors to which consumer give due importance while purchasing a product.
Which of these factors highly influence your relevant decisions?
Price
Quality
Other factors
4. Amistar that Syngenta launched in USA will achieve huge success in relevant market?
Strongly agree
Agree
Somewhat agree
Disagree
Highly disagree
5. If price of Amistar will increase then you will shift to other product?
Yes
No
6 Amistar in terms of quality will be of excellent quality than alternative one.
Strongly agree
Agree
Somewhat agree
Disagree
Highly disagree
No
2. Syngenta products are doing well in respect eliminating pest from plantations?
Yes
No
3. There are some factors to which consumer give due importance while purchasing a product.
Which of these factors highly influence your relevant decisions?
Price
Quality
Other factors
4. Amistar that Syngenta launched in USA will achieve huge success in relevant market?
Strongly agree
Agree
Somewhat agree
Disagree
Highly disagree
5. If price of Amistar will increase then you will shift to other product?
Yes
No
6 Amistar in terms of quality will be of excellent quality than alternative one.
Strongly agree
Agree
Somewhat agree
Disagree
Highly disagree
⊘ This is a preview!⊘
Do you want full access?
Subscribe today to unlock all pages.
Trusted by 1+ million students worldwide
TASK 2
2.1 Computation of mean median and mode
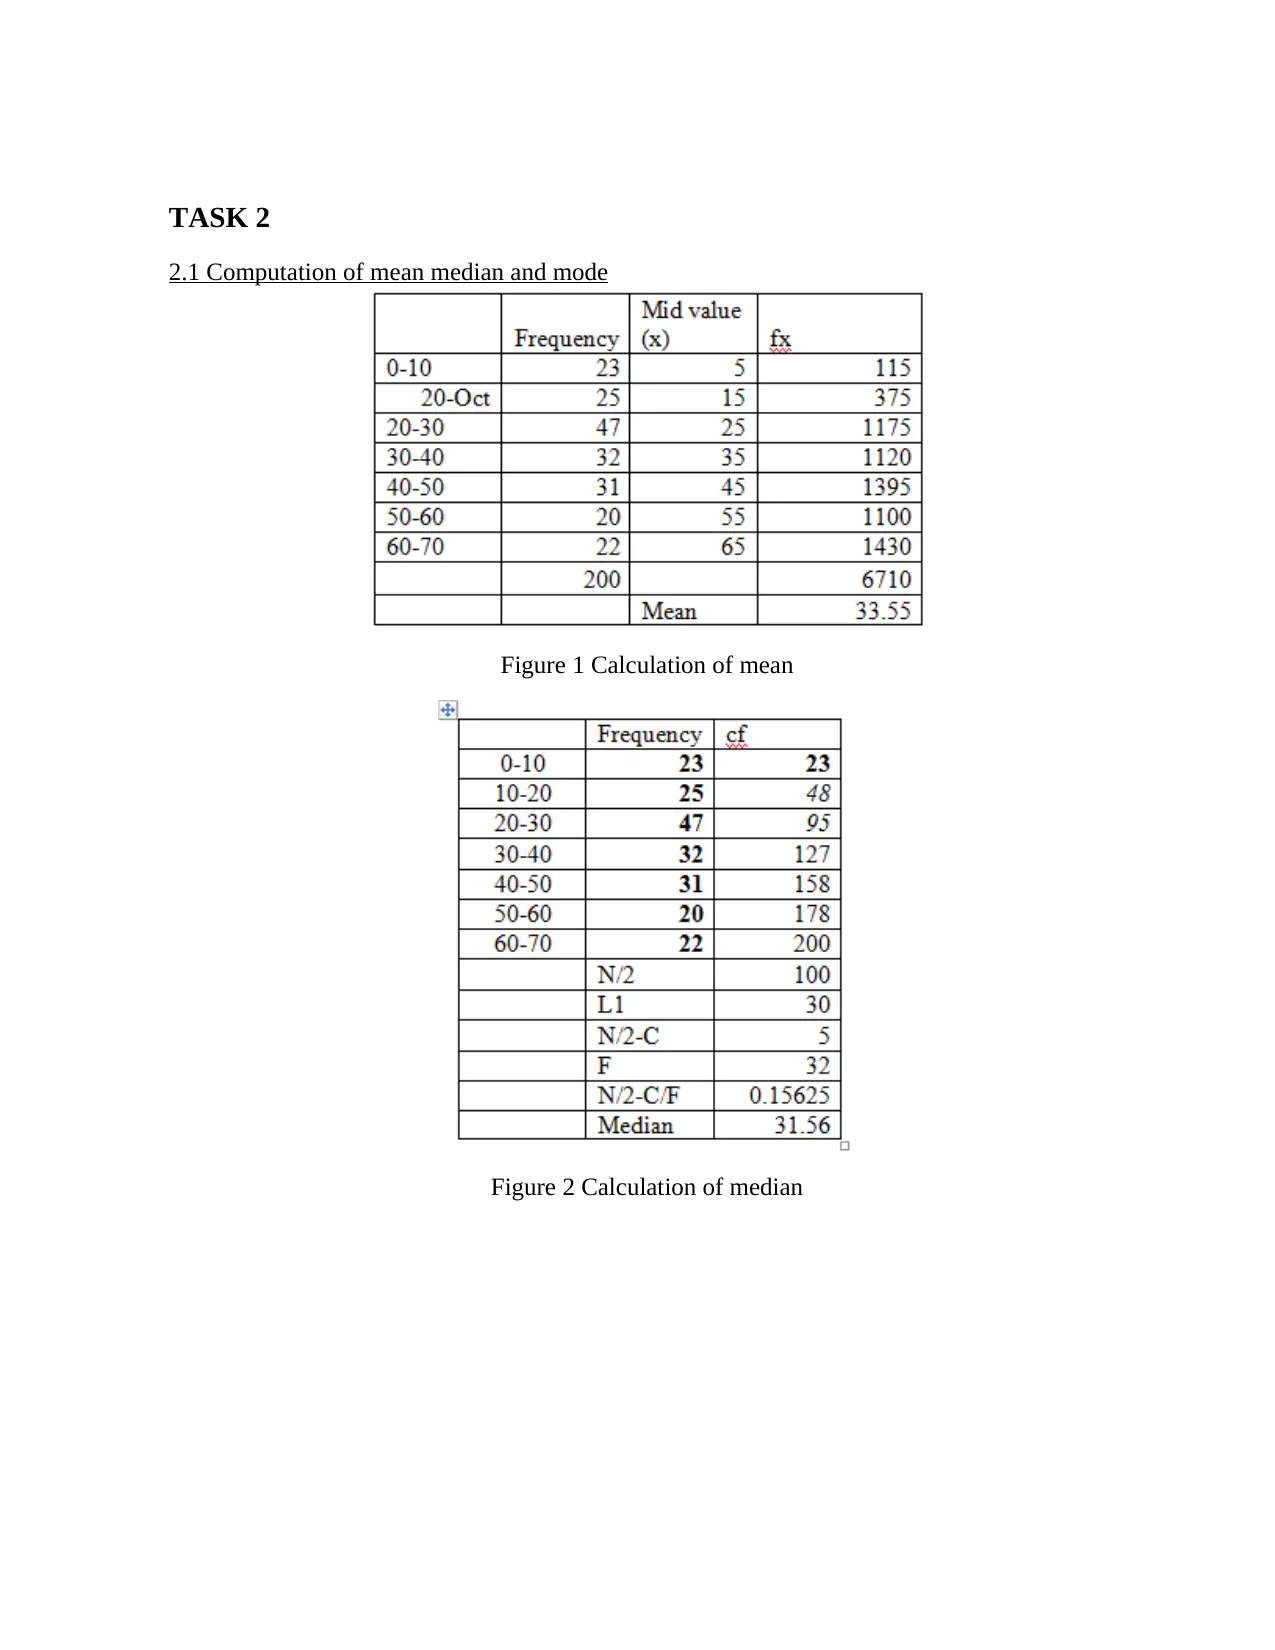
Figure 1 Calculation of mean
Figure 2 Calculation of median
2.1 Computation of mean median and mode
Figure 1 Calculation of mean
Figure 2 Calculation of median
Paraphrase This Document
Need a fresh take? Get an instant paraphrase of this document with our AI Paraphraser
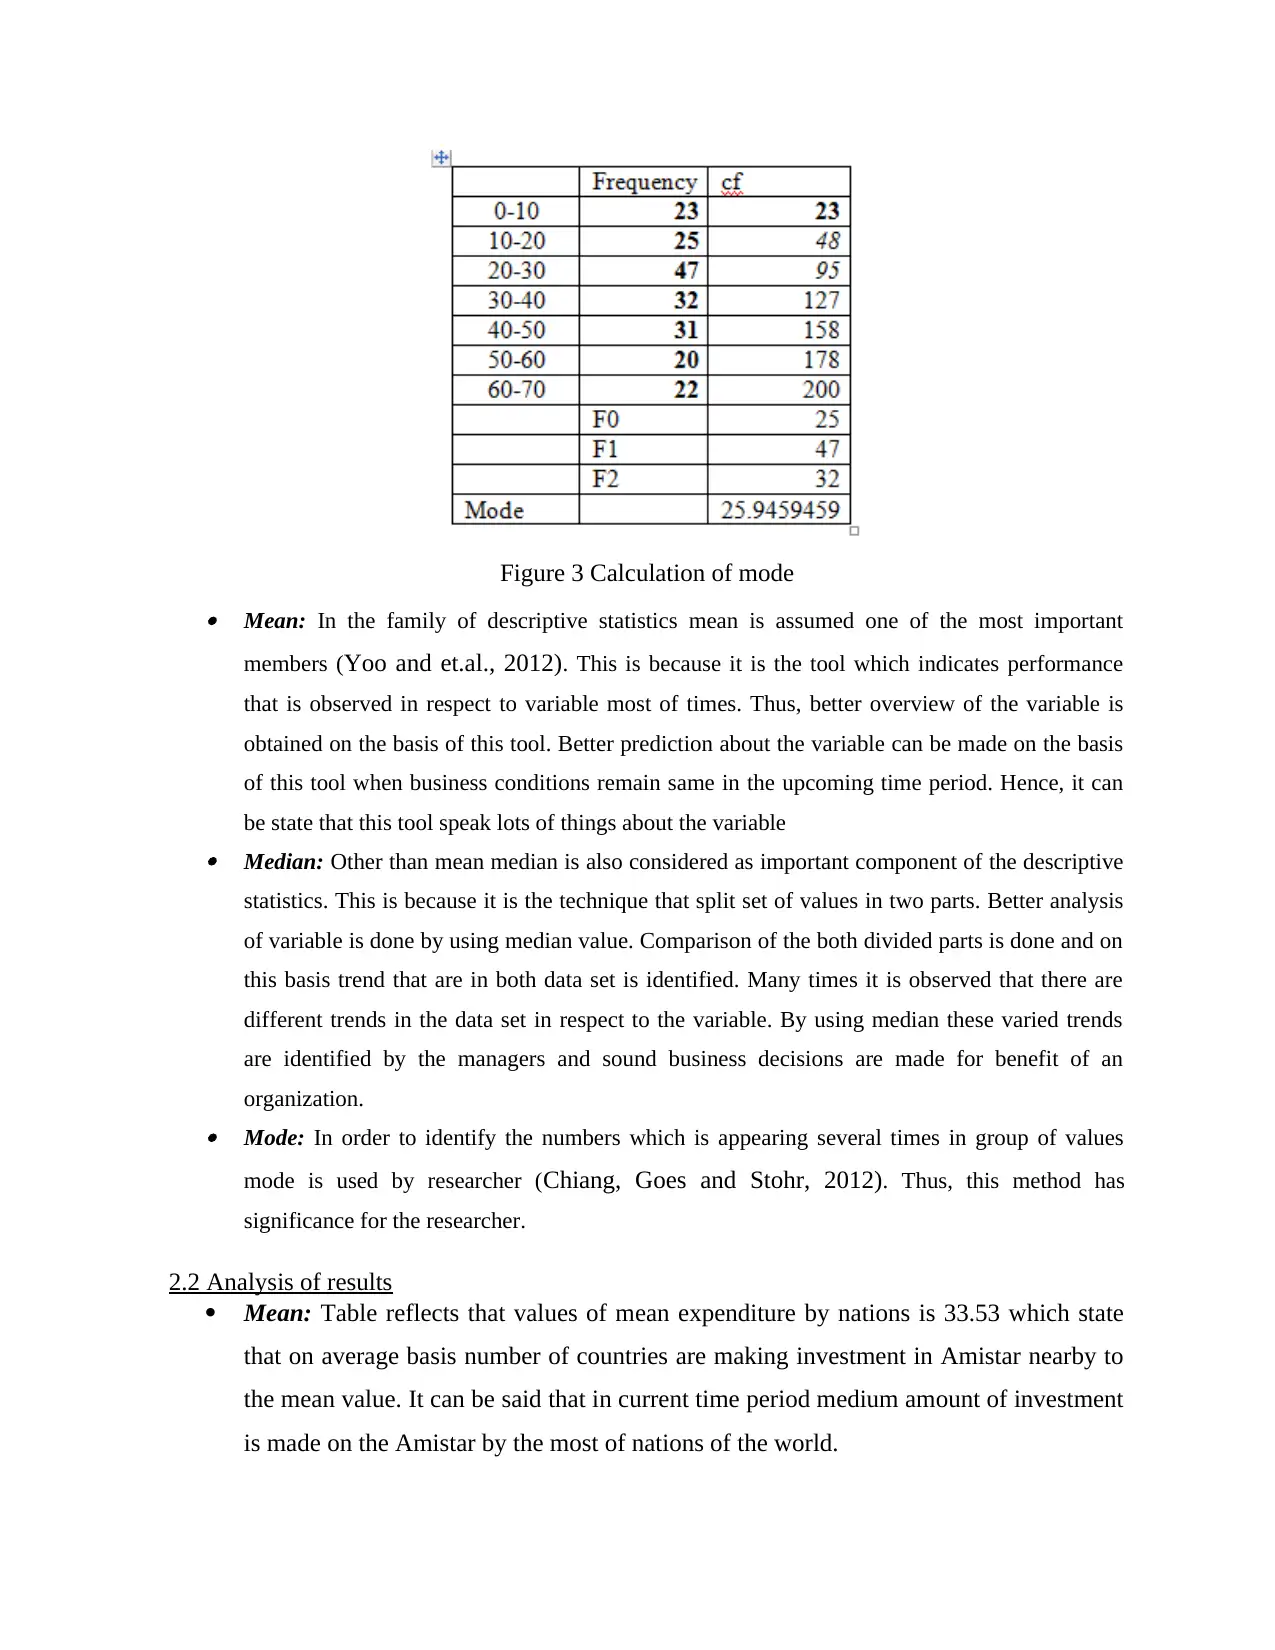
Figure 3 Calculation of mode Mean: In the family of descriptive statistics mean is assumed one of the most important
members (Yoo and et.al., 2012). This is because it is the tool which indicates performance
that is observed in respect to variable most of times. Thus, better overview of the variable is
obtained on the basis of this tool. Better prediction about the variable can be made on the basis
of this tool when business conditions remain same in the upcoming time period. Hence, it can
be state that this tool speak lots of things about the variable
Median: Other than mean median is also considered as important component of the descriptive
statistics. This is because it is the technique that split set of values in two parts. Better analysis
of variable is done by using median value. Comparison of the both divided parts is done and on
this basis trend that are in both data set is identified. Many times it is observed that there are
different trends in the data set in respect to the variable. By using median these varied trends
are identified by the managers and sound business decisions are made for benefit of an
organization.
Mode: In order to identify the numbers which is appearing several times in group of values
mode is used by researcher (Chiang, Goes and Stohr, 2012). Thus, this method has
significance for the researcher.
2.2 Analysis of results
Mean: Table reflects that values of mean expenditure by nations is 33.53 which state
that on average basis number of countries are making investment in Amistar nearby to
the mean value. It can be said that in current time period medium amount of investment
is made on the Amistar by the most of nations of the world.
Median: Median value is 31.56 and this number divide above set of expenditure that is
made on Amistar by number of nations of the world. It is clear that most of nations of
the world are making investment in the Amistar above median value which is 31.56. it
can be said that less amount is spend on Amistar by the nations.
Mode: Value of mode is 25.94 which indicate that large number of countries of the
world is making investment in Amistar equivalent to mentioned value.
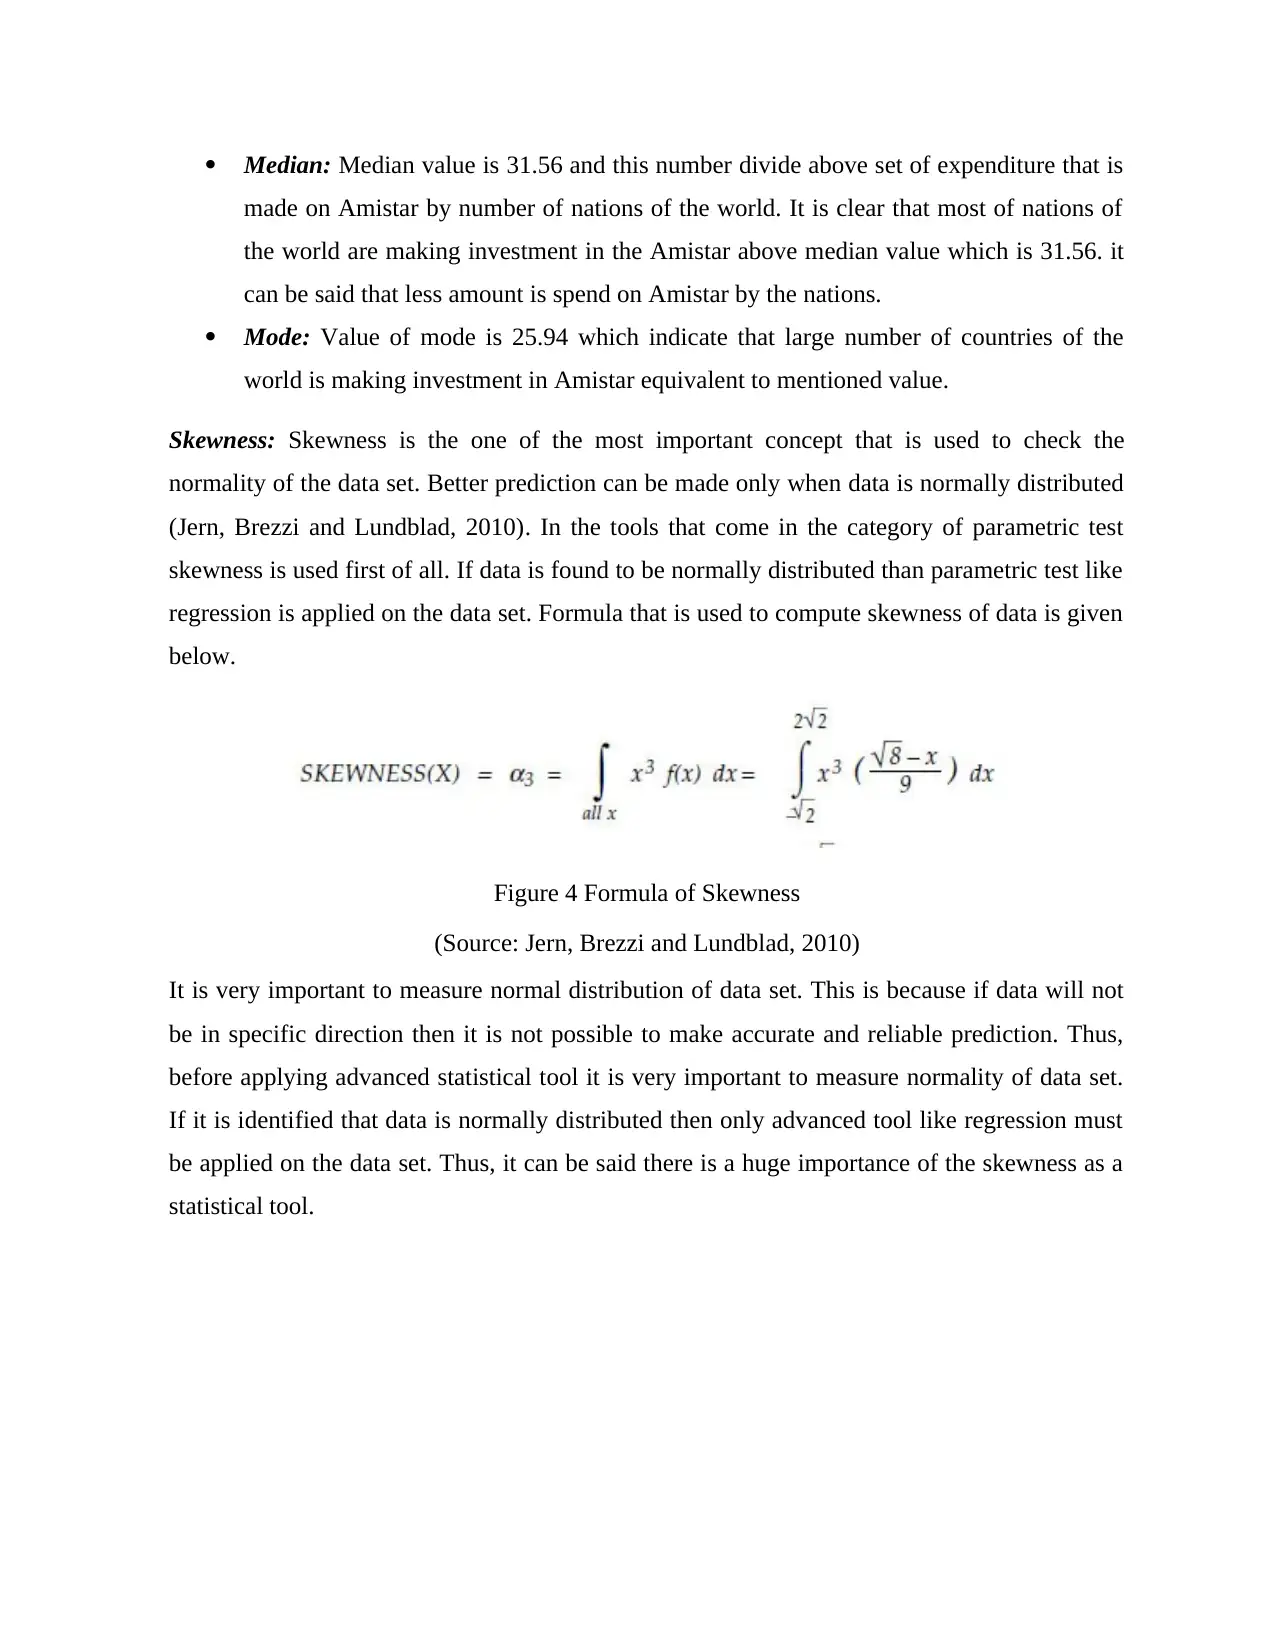
Skewness: Skewness is the one of the most important concept that is used to check the
normality of the data set. Better prediction can be made only when data is normally distributed
(Jern, Brezzi and Lundblad, 2010). In the tools that come in the category of parametric test
skewness is used first of all. If data is found to be normally distributed than parametric test like
regression is applied on the data set. Formula that is used to compute skewness of data is given
below.
Figure 4 Formula of Skewness
(Source: Jern, Brezzi and Lundblad, 2010)
It is very important to measure normal distribution of data set. This is because if data will not
be in specific direction then it is not possible to make accurate and reliable prediction. Thus,
before applying advanced statistical tool it is very important to measure normality of data set.
If it is identified that data is normally distributed then only advanced tool like regression must
be applied on the data set. Thus, it can be said there is a huge importance of the skewness as a
statistical tool.
made on Amistar by number of nations of the world. It is clear that most of nations of
the world are making investment in the Amistar above median value which is 31.56. it
can be said that less amount is spend on Amistar by the nations.
Mode: Value of mode is 25.94 which indicate that large number of countries of the
world is making investment in Amistar equivalent to mentioned value.
Skewness: Skewness is the one of the most important concept that is used to check the
normality of the data set. Better prediction can be made only when data is normally distributed
(Jern, Brezzi and Lundblad, 2010). In the tools that come in the category of parametric test
skewness is used first of all. If data is found to be normally distributed than parametric test like
regression is applied on the data set. Formula that is used to compute skewness of data is given
below.
Figure 4 Formula of Skewness
(Source: Jern, Brezzi and Lundblad, 2010)
It is very important to measure normal distribution of data set. This is because if data will not
be in specific direction then it is not possible to make accurate and reliable prediction. Thus,
before applying advanced statistical tool it is very important to measure normality of data set.
If it is identified that data is normally distributed then only advanced tool like regression must
be applied on the data set. Thus, it can be said there is a huge importance of the skewness as a
statistical tool.
⊘ This is a preview!⊘
Do you want full access?
Subscribe today to unlock all pages.
Trusted by 1+ million students worldwide
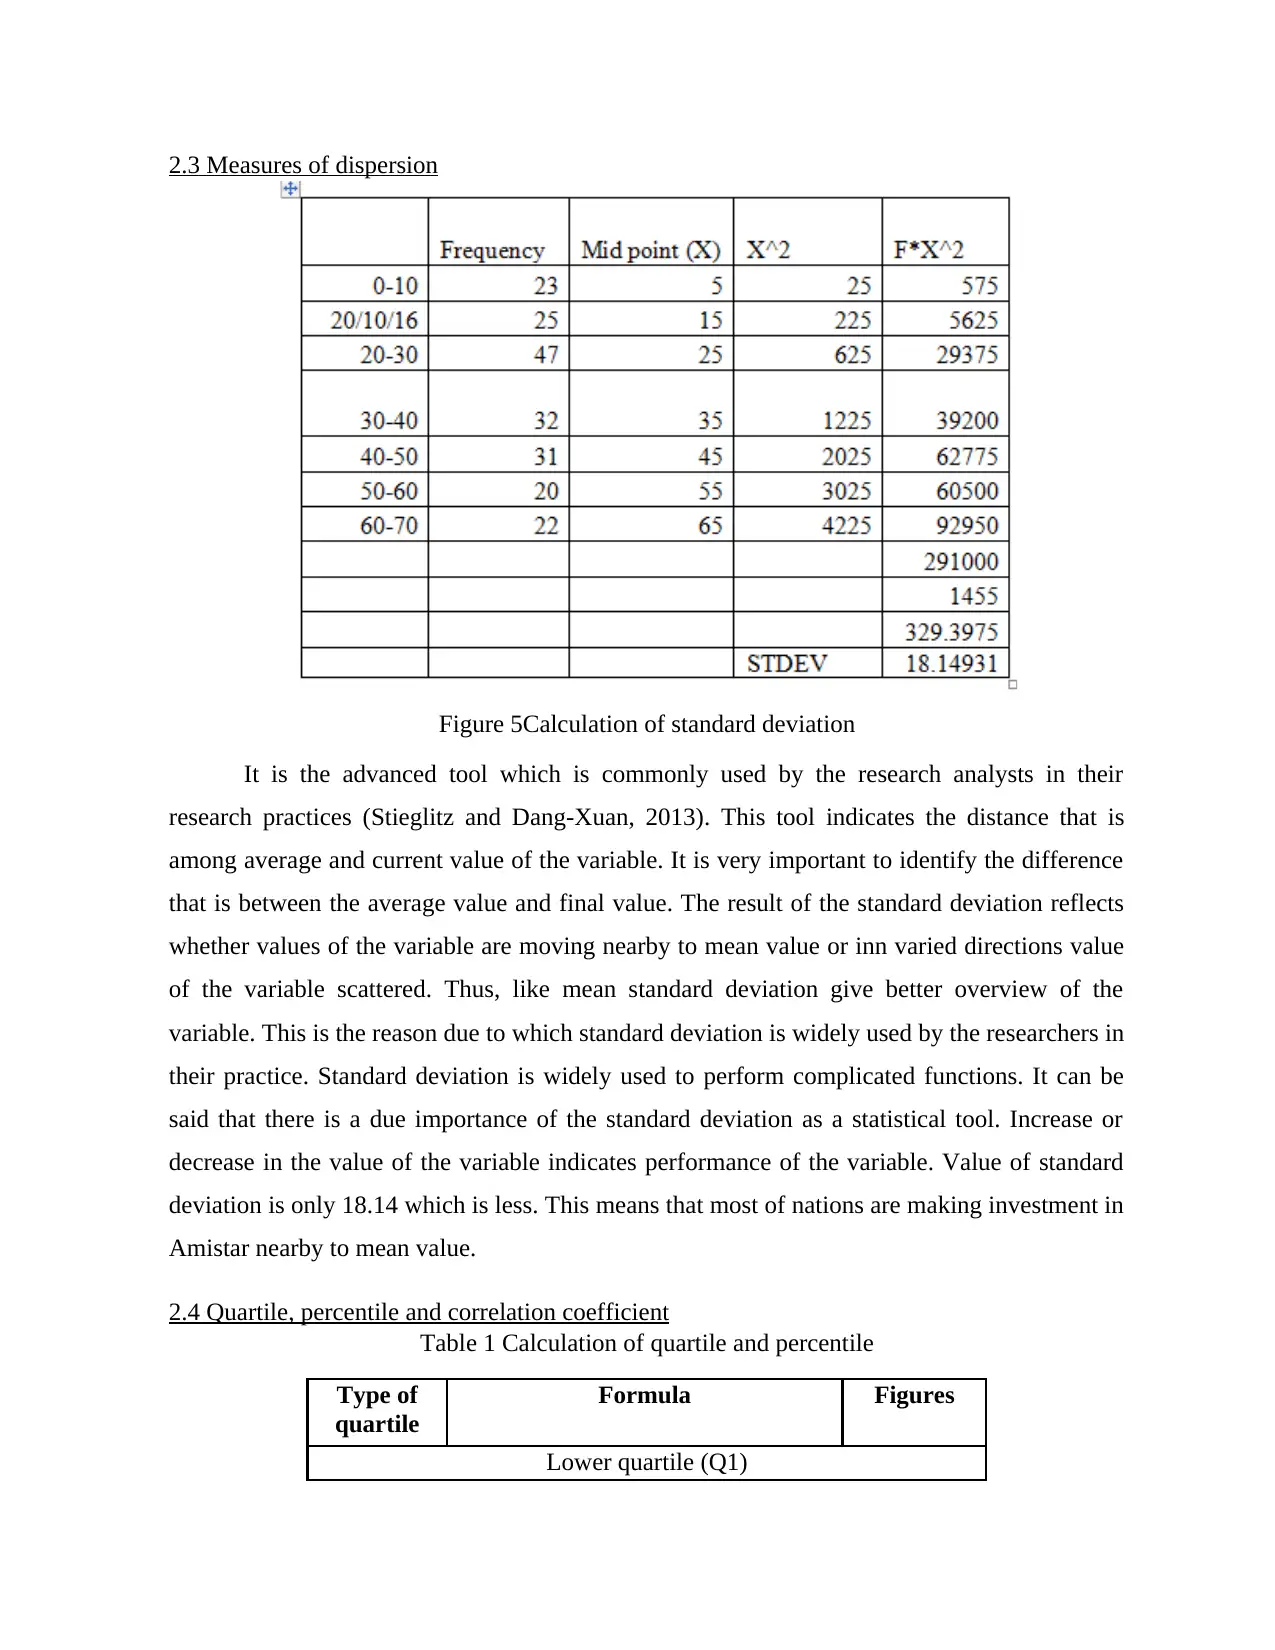
2.3 Measures of dispersion
Figure 5Calculation of standard deviation
It is the advanced tool which is commonly used by the research analysts in their
research practices (Stieglitz and Dang-Xuan, 2013). This tool indicates the distance that is
among average and current value of the variable. It is very important to identify the difference
that is between the average value and final value. The result of the standard deviation reflects
whether values of the variable are moving nearby to mean value or inn varied directions value
of the variable scattered. Thus, like mean standard deviation give better overview of the
variable. This is the reason due to which standard deviation is widely used by the researchers in
their practice. Standard deviation is widely used to perform complicated functions. It can be
said that there is a due importance of the standard deviation as a statistical tool. Increase or
decrease in the value of the variable indicates performance of the variable. Value of standard
deviation is only 18.14 which is less. This means that most of nations are making investment in
Amistar nearby to mean value.
2.4 Quartile, percentile and correlation coefficient
Table 1 Calculation of quartile and percentile
Type of
quartile
Formula Figures
Lower quartile (Q1)
Paraphrase This Document
Need a fresh take? Get an instant paraphrase of this document with our AI Paraphraser
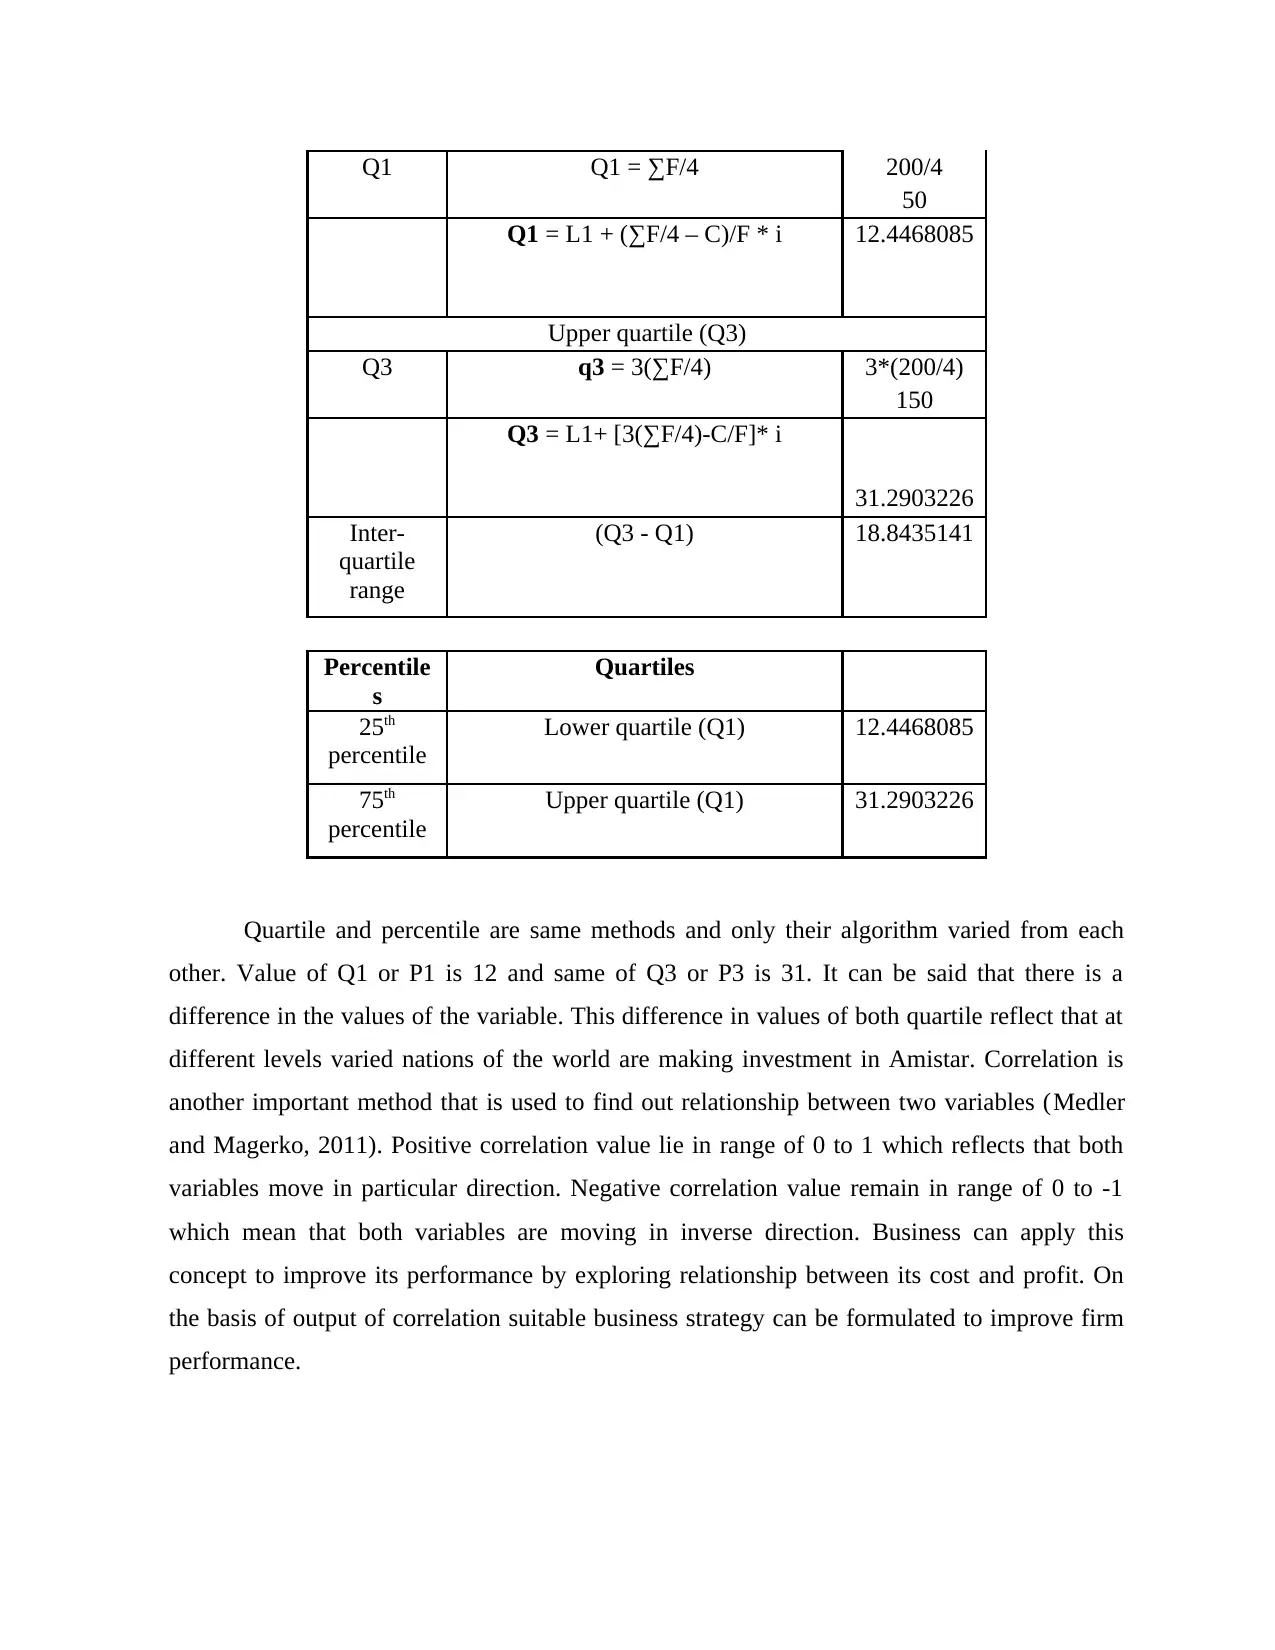
Q1 Q1 = ∑F/4 200/4
50
Q1 = L1 + (∑F/4 – C)/F * i 12.4468085
Upper quartile (Q3)
Q3 q3 = 3(∑F/4) 3*(200/4)
150
Q3 = L1+ [3(∑F/4)-C/F]* i
31.2903226
Inter-
quartile
range
(Q3 - Q1) 18.8435141
Percentile
s
Quartiles
25th
percentile
Lower quartile (Q1) 12.4468085
75th
percentile
Upper quartile (Q1) 31.2903226
Quartile and percentile are same methods and only their algorithm varied from each
other. Value of Q1 or P1 is 12 and same of Q3 or P3 is 31. It can be said that there is a
difference in the values of the variable. This difference in values of both quartile reflect that at
different levels varied nations of the world are making investment in Amistar. Correlation is
another important method that is used to find out relationship between two variables (Medler
and Magerko, 2011). Positive correlation value lie in range of 0 to 1 which reflects that both
variables move in particular direction. Negative correlation value remain in range of 0 to -1
which mean that both variables are moving in inverse direction. Business can apply this
concept to improve its performance by exploring relationship between its cost and profit. On
the basis of output of correlation suitable business strategy can be formulated to improve firm
performance.
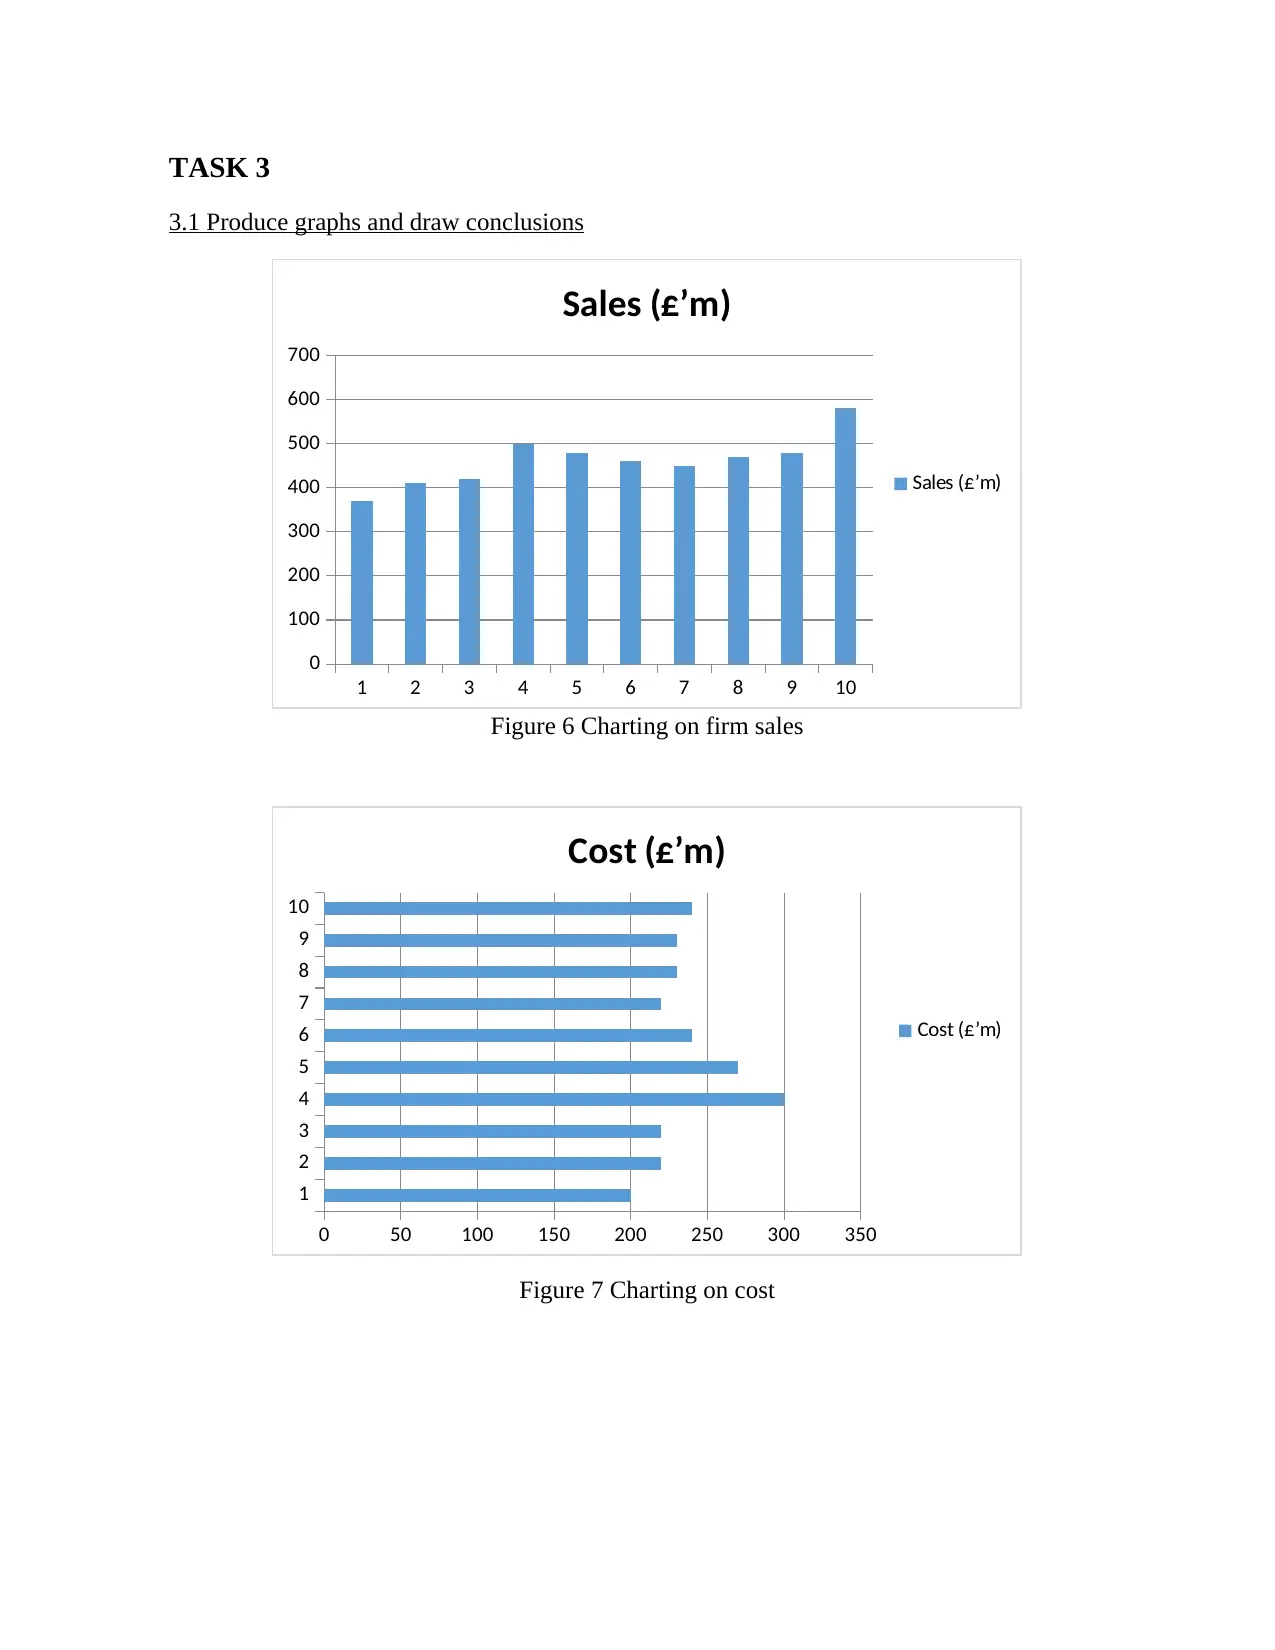
TASK 3
3.1 Produce graphs and draw conclusions
1 2 3 4 5 6 7 8 9 10
0
100
200
300
400
500
600
700
Sales (£’m)
Sales (£’m)
Figure 6 Charting on firm sales
1
2
3
4
5
6
7
8
9
10
0 50 100 150 200 250 300 350
Cost (£’m)
Cost (£’m)
Figure 7 Charting on cost
3.1 Produce graphs and draw conclusions
1 2 3 4 5 6 7 8 9 10
0
100
200
300
400
500
600
700
Sales (£’m)
Sales (£’m)
Figure 6 Charting on firm sales
1
2
3
4
5
6
7
8
9
10
0 50 100 150 200 250 300 350
Cost (£’m)
Cost (£’m)
Figure 7 Charting on cost
⊘ This is a preview!⊘
Do you want full access?
Subscribe today to unlock all pages.
Trusted by 1+ million students worldwide
1 out of 22
Related Documents


Your All-in-One AI-Powered Toolkit for Academic Success.
+13062052269
info@desklib.com
Available 24*7 on WhatsApp / Email
![[object Object]](/_next/static/media/star-bottom.7253800d.svg)
Unlock your academic potential
Copyright © 2020–2026 A2Z Services. All Rights Reserved. Developed and managed by ZUCOL.