Business Decision-Making Report: Customer Shopping Habits Analysis
VerifiedAdded on 2020/10/22
|22
|4985
|221
Report
AI Summary
This report analyzes business decision-making processes, focusing on the impact of technology and multichannel approaches on high street shops and malls. The research investigates customer shopping habits through primary and secondary data collection, employing questionnaires, interviews, and internet communication. The report details research methodologies, including descriptive, qualitative, and quantitative methods, along with sampling techniques like random and cluster sampling. Data collected is interpreted using measures of central tendency and is presented through charts and graphs for analysis. The report also covers financial information systems and investment appraisal tools. The findings aim to understand customer preferences and provide insights for business strategies, as well as a formal report summarizing positive and negative impacts examined in the research. Evaluation of data is done by using measure of dispersion.
Business Decision-making
Paraphrase This Document
Need a fresh take? Get an instant paraphrase of this document with our AI Paraphraser
Table of Contents
INTRODUCTION...........................................................................................................................1
TASK 1............................................................................................................................................1
1.1: Effective data collection strategies from various students across certain campuses...........1
1.2: Research Methodologies......................................................................................................2
1.3: Framing questionnaire..........................................................................................................3
TASK 2............................................................................................................................................5
2.1: Interpretation of data collection by using representative views...........................................5
2.2: Analysing outcomes collected out of research to get reliable conclusion...........................8
2.3: Evaluation of data by using measure of dispersion..............................................................9
2.4: Definition of various statistical tools...................................................................................9
TASK 3..........................................................................................................................................10
3.1: Charts and graphs analysis.................................................................................................10
3.2: Trend line analysis.............................................................................................................13
3.3: Covered in poster...............................................................................................................14
3.4: Preparation of formal report...............................................................................................14
TASK 4..........................................................................................................................................15
4.1: Benefits of using various types of financial information system ......................................15
4.2: Network diagram................................................................................................................16
4.3: Investment appraisal tools and techniques.........................................................................18
CONCLUSION..............................................................................................................................19
REFERENCES..............................................................................................................................20
INTRODUCTION
A decision can be valuable course of action that is purposely selected from a wide set of
alternatives to attain organisation aims and objectives. Business decision is continuous
component of managing any organisation or any business activities. According to the mentioned
case study, it has been found that technology innovation and evaluation of using multichannel
way those are making huge impacts on high street shops and malls. In this particular segment
one of leading companies are operating in more effective manner. This project research is done
to draw the attention of customers towards online shopping. Under this module, valuable data
collection sources as well as effective research methodologies those are responsible for providing
necessary to the company.
All the data that are collected for this particular research are analyse by using various
charts and graphs. Apart for this, a formal report is design to summaries all positive and negative
impacts that are examine in the research. Evaluation of data is done by using measure of
dispersion. Likewise, a well organise formal report is being prepared from research work are
summaries by using charts that are useful at the period of time. Lastly, certain collection of data
is being analyse by the help of investment appraisal techniques (Hwang and Masud, 2012).
TASK 1
1.1: Effective data collection strategies from various students across certain campuses
Research is combination of various creative work those are undertaken to enhance the
performance of various facts and reach to certain level of conclusion. It can be associated with
various creative activity those are undertaken in order to increase valuation of culture and society
within an organisation. As per the mentioned scenario, a specific research is conducted by using
primary and secondary research on the selected matter to determine customers shopping habits
and factors or other socio- economic implications. For this purpose, various data collection
sources are taken into accounts. These are more reliable for making better understanding of
various crucial aspects which are essential enough to increase ability and future sustainability for
an organisation (García-Peñalvo and Conde, 2014). Data collection procedure from all relevant
sources to determine research issues, test all hypothesis and analysis for attaining maximum
return within an accounting period of time. The process through which researcher used to collect
essential information those are needed to search solution to a given issues. Some of them
collection measure are:
1
⊘ This is a preview!⊘
Do you want full access?
Subscribe today to unlock all pages.
Trusted by 1+ million students worldwide
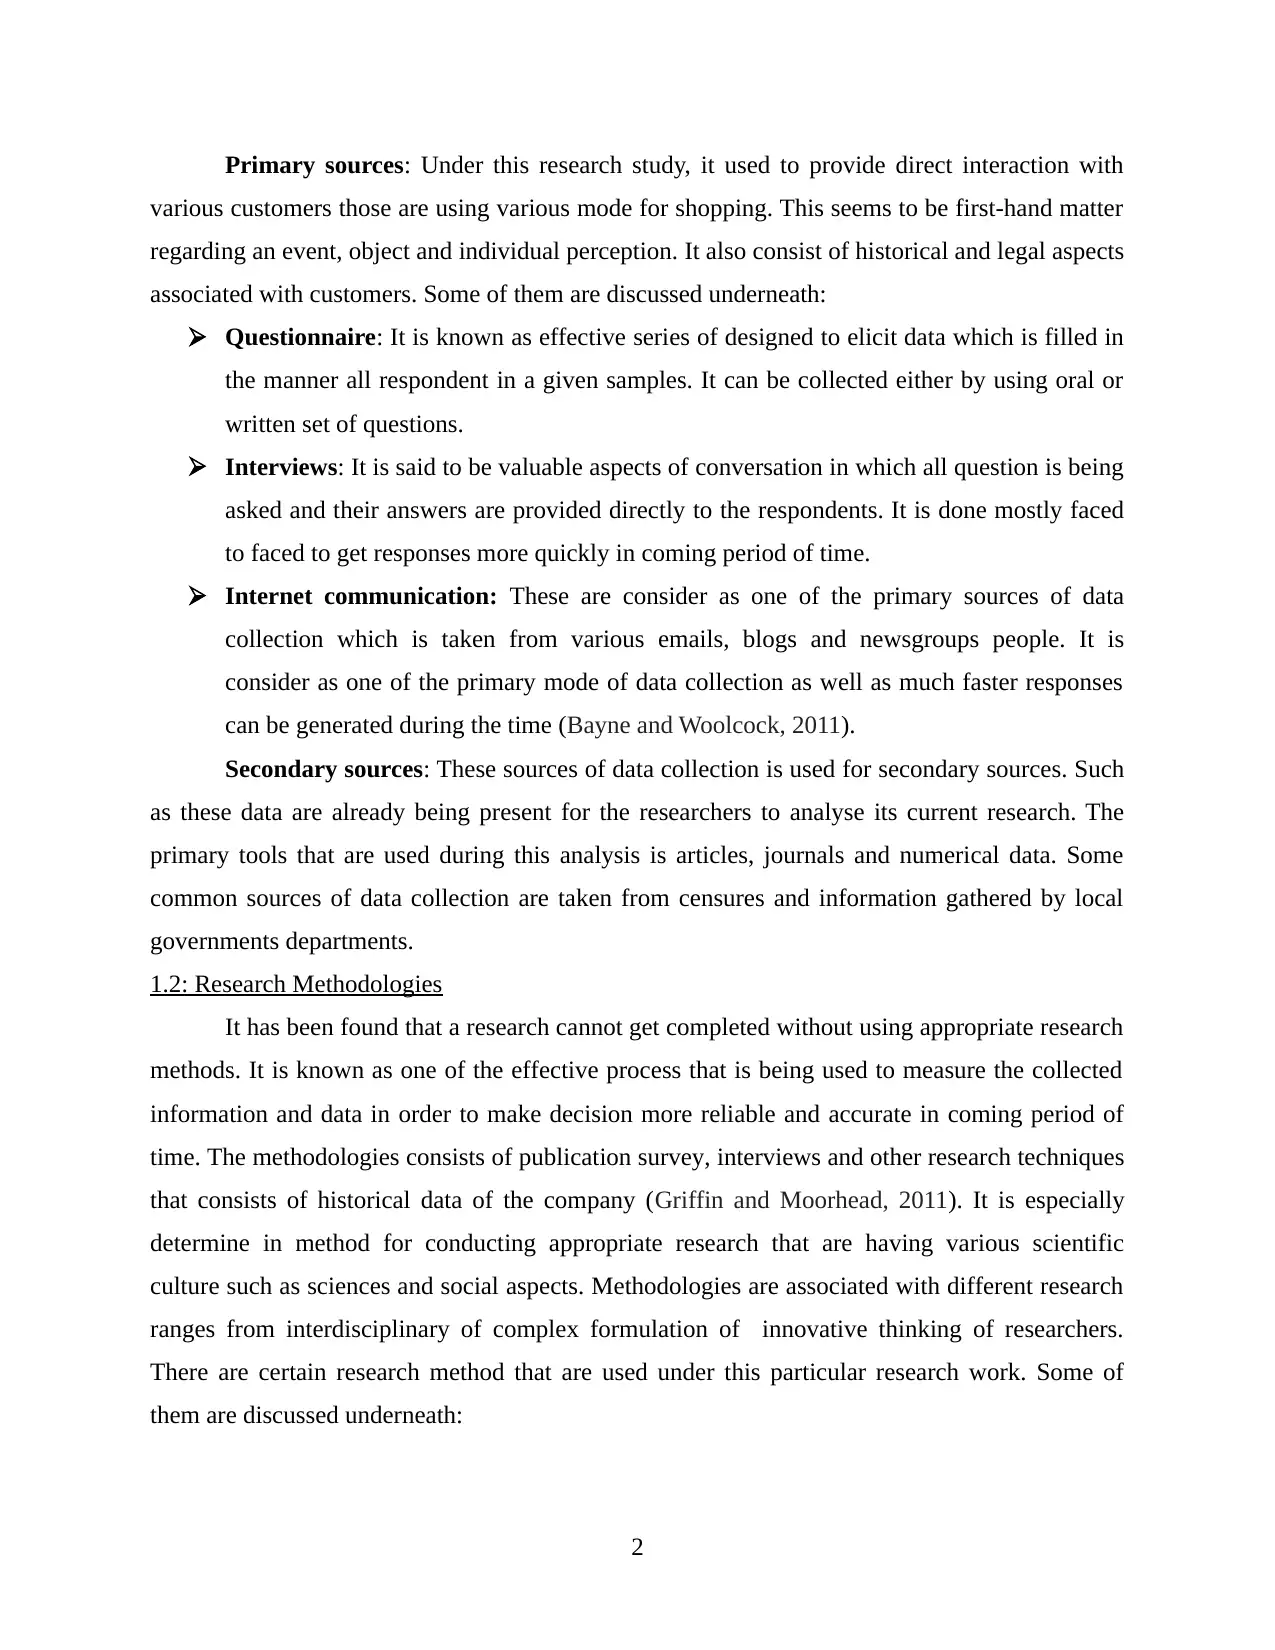
Primary sources: Under this research study, it used to provide direct interaction with
various customers those are using various mode for shopping. This seems to be first-hand matter
regarding an event, object and individual perception. It also consist of historical and legal aspects
associated with customers. Some of them are discussed underneath:
Questionnaire: It is known as effective series of designed to elicit data which is filled in
the manner all respondent in a given samples. It can be collected either by using oral or
written set of questions.
Interviews: It is said to be valuable aspects of conversation in which all question is being
asked and their answers are provided directly to the respondents. It is done mostly faced
to faced to get responses more quickly in coming period of time.
Internet communication: These are consider as one of the primary sources of data
collection which is taken from various emails, blogs and newsgroups people. It is
consider as one of the primary mode of data collection as well as much faster responses
can be generated during the time (Bayne and Woolcock, 2011).
Secondary sources: These sources of data collection is used for secondary sources. Such
as these data are already being present for the researchers to analyse its current research. The
primary tools that are used during this analysis is articles, journals and numerical data. Some
common sources of data collection are taken from censures and information gathered by local
governments departments.
1.2: Research Methodologies
It has been found that a research cannot get completed without using appropriate research
methods. It is known as one of the effective process that is being used to measure the collected
information and data in order to make decision more reliable and accurate in coming period of
time. The methodologies consists of publication survey, interviews and other research techniques
that consists of historical data of the company (Griffin and Moorhead, 2011). It is especially
determine in method for conducting appropriate research that are having various scientific
culture such as sciences and social aspects. Methodologies are associated with different research
ranges from interdisciplinary of complex formulation of innovative thinking of researchers.
There are certain research method that are used under this particular research work. Some of
them are discussed underneath:
2
Paraphrase This Document
Need a fresh take? Get an instant paraphrase of this document with our AI Paraphraser
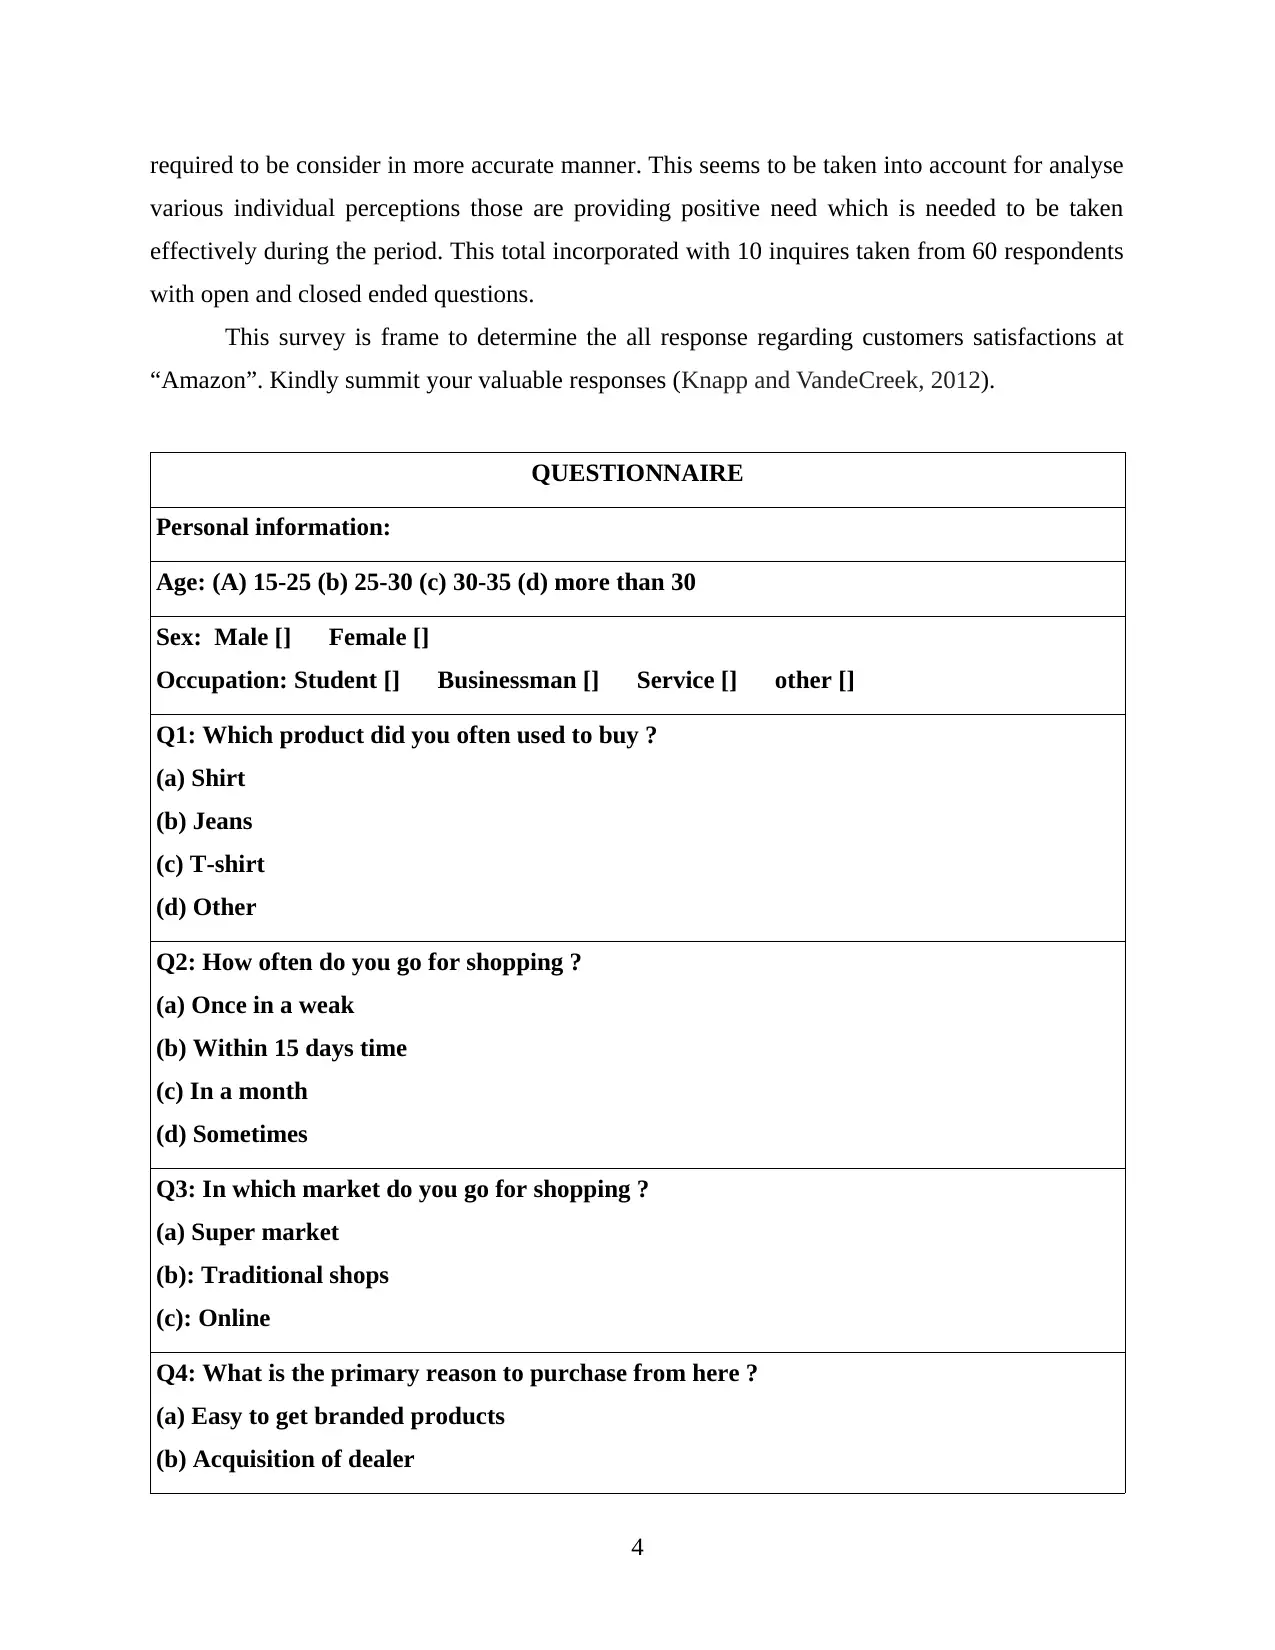
Descriptive research: It is known as more reliable research method which is used to
determine overall population. It draws the attention of all specific kind of situation that are
usually categorised some situation such as to analyse causal relationships amount given two set
of variables.
Qualitative research method: It seems to be specific collection of data and making
analysis of various perception of people and their overall experiences that they feel sometime
while shopping by using application and any digital gadgets. This happens to more subjective
and hard techniques of data collection to analyse in-depth analyse of any kind of research.
Quantitative research: It is known as one of the primary research method which is used
to analyse numerical analysis of an any kind of research. It is consider more systematic
investigation of variable observation done through using statistical evaluation. It is used to
enable in framing and analysing more better outcomes of an all kind of research-practice
(Goodwin and Wright, 2014).
Sampling method: It is classified for the purpose of probability sampling of member of
population that are having non-zero probability from the selected respondent. It is selection of
subset of individuals from within an statistical respondents to determine overall characteristics of
entire populations. It is essential to choose best appropriate respondent through using total
number of 60 respondents that are taken into account. Some vital sampling techniques are
discussed underneath:
Random sampling: It is known as one of the major sampling method which is being
used by managers to make enable all the thinks that are more effectively responsible for
analysing overall populations. The chosen sample will be used to analyse the experiences
of various customers those are using online shopping.
Cluster sampling: It is known as one the complete set of group that is being divided into
various effective part so that better results can be achieve in coming period of time. This
will be consider more liable to determine appropriate outcomes selected from entire
populations. All the researchers used to consider this particular analysis from the chosen
samples from cluster.
1.3: Framing questionnaire
Research is said to be more appropriate in case all essential requirements are followed in
effective manner. There are certain important viewpoints and things which are needed to be
3
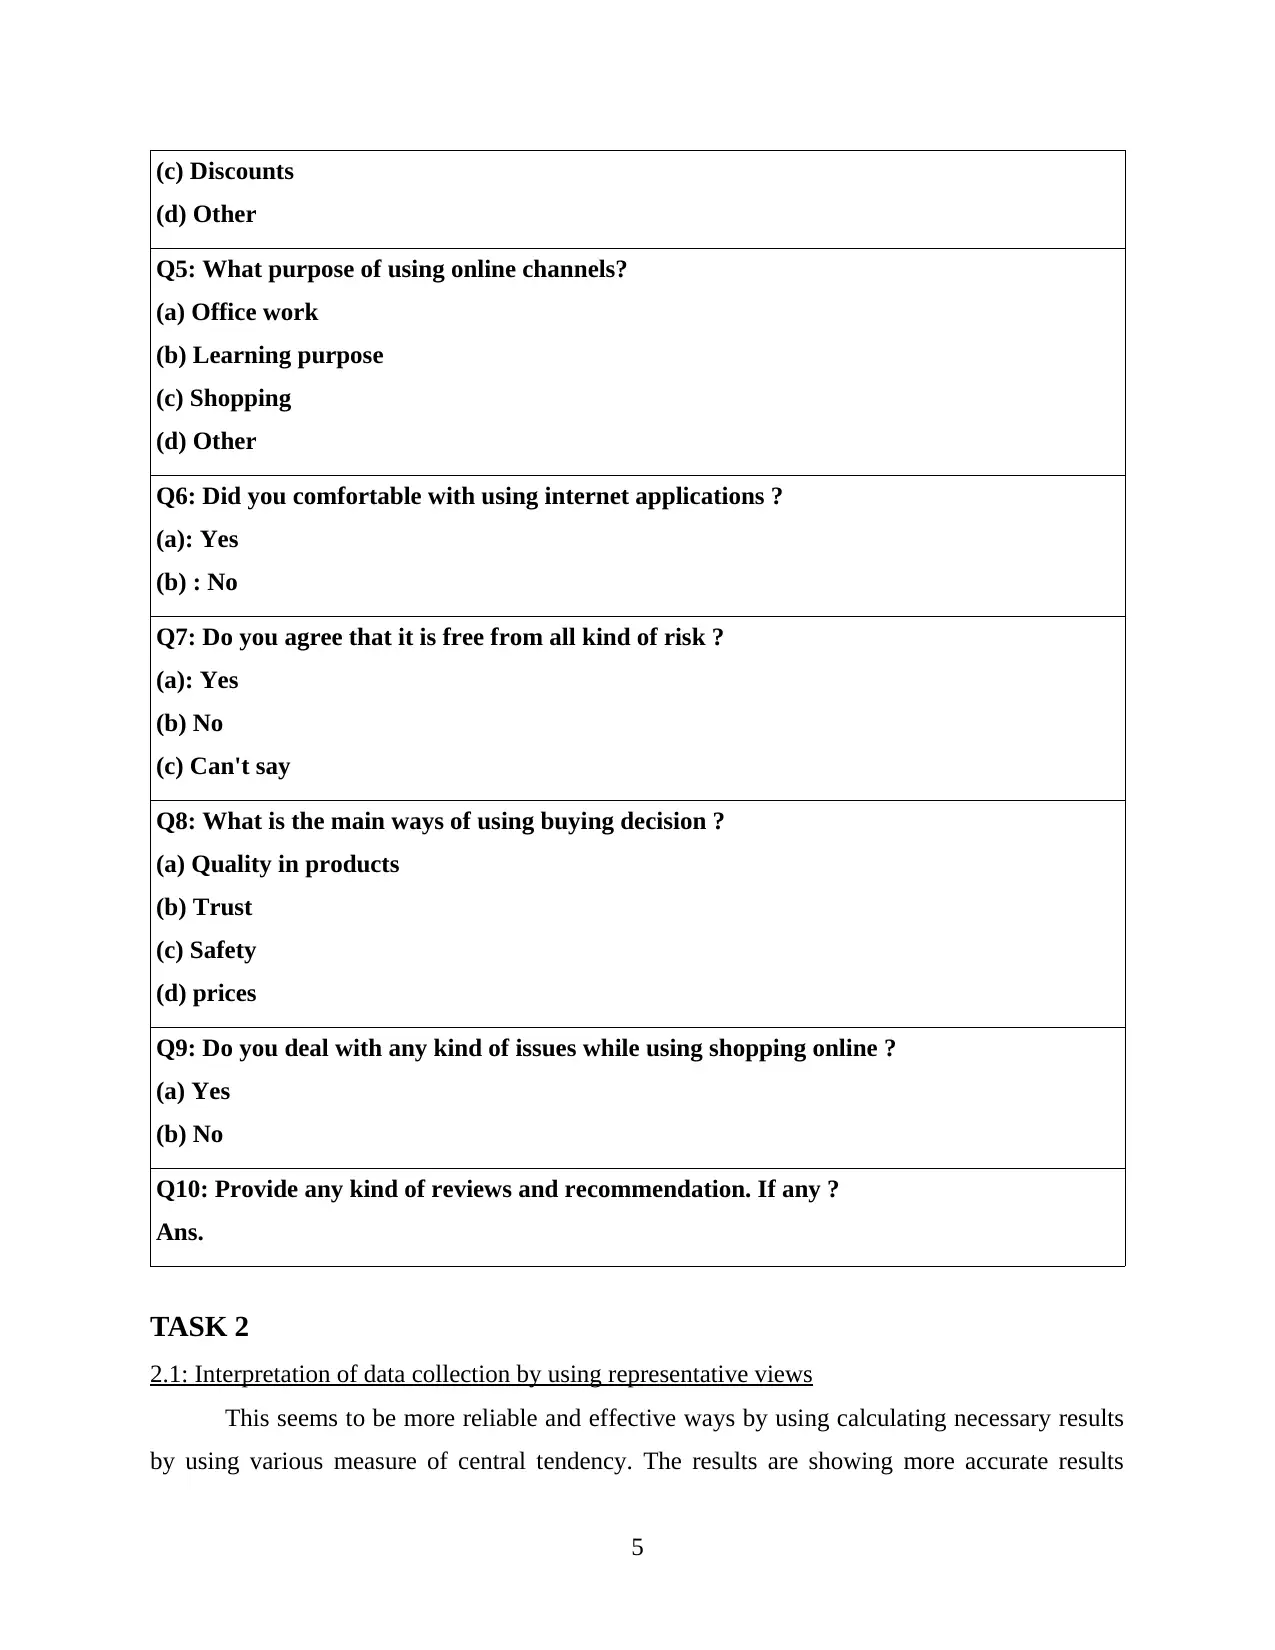
required to be consider in more accurate manner. This seems to be taken into account for analyse
various individual perceptions those are providing positive need which is needed to be taken
effectively during the period. This total incorporated with 10 inquires taken from 60 respondents
with open and closed ended questions.
This survey is frame to determine the all response regarding customers satisfactions at
“Amazon”. Kindly summit your valuable responses (Knapp and VandeCreek, 2012).
QUESTIONNAIRE
Personal information:
Age: (A) 15-25 (b) 25-30 (c) 30-35 (d) more than 30
Sex: Male [] Female []
Occupation: Student [] Businessman [] Service [] other []
Q1: Which product did you often used to buy ?
(a) Shirt
(b) Jeans
(c) T-shirt
(d) Other
Q2: How often do you go for shopping ?
(a) Once in a weak
(b) Within 15 days time
(c) In a month
(d) Sometimes
Q3: In which market do you go for shopping ?
(a) Super market
(b): Traditional shops
(c): Online
Q4: What is the primary reason to purchase from here ?
(a) Easy to get branded products
(b) Acquisition of dealer
4
⊘ This is a preview!⊘
Do you want full access?
Subscribe today to unlock all pages.
Trusted by 1+ million students worldwide
(c) Discounts
(d) Other
Q5: What purpose of using online channels?
(a) Office work
(b) Learning purpose
(c) Shopping
(d) Other
Q6: Did you comfortable with using internet applications ?
(a): Yes
(b) : No
Q7: Do you agree that it is free from all kind of risk ?
(a): Yes
(b) No
(c) Can't say
Q8: What is the main ways of using buying decision ?
(a) Quality in products
(b) Trust
(c) Safety
(d) prices
Q9: Do you deal with any kind of issues while using shopping online ?
(a) Yes
(b) No
Q10: Provide any kind of reviews and recommendation. If any ?
Ans.
TASK 2
2.1: Interpretation of data collection by using representative views
This seems to be more reliable and effective ways by using calculating necessary results
by using various measure of central tendency. The results are showing more accurate results
5
(d) Other
Q5: What purpose of using online channels?
(a) Office work
(b) Learning purpose
(c) Shopping
(d) Other
Q6: Did you comfortable with using internet applications ?
(a): Yes
(b) : No
Q7: Do you agree that it is free from all kind of risk ?
(a): Yes
(b) No
(c) Can't say
Q8: What is the main ways of using buying decision ?
(a) Quality in products
(b) Trust
(c) Safety
(d) prices
Q9: Do you deal with any kind of issues while using shopping online ?
(a) Yes
(b) No
Q10: Provide any kind of reviews and recommendation. If any ?
Ans.
TASK 2
2.1: Interpretation of data collection by using representative views
This seems to be more reliable and effective ways by using calculating necessary results
by using various measure of central tendency. The results are showing more accurate results
5
Paraphrase This Document
Need a fresh take? Get an instant paraphrase of this document with our AI Paraphraser
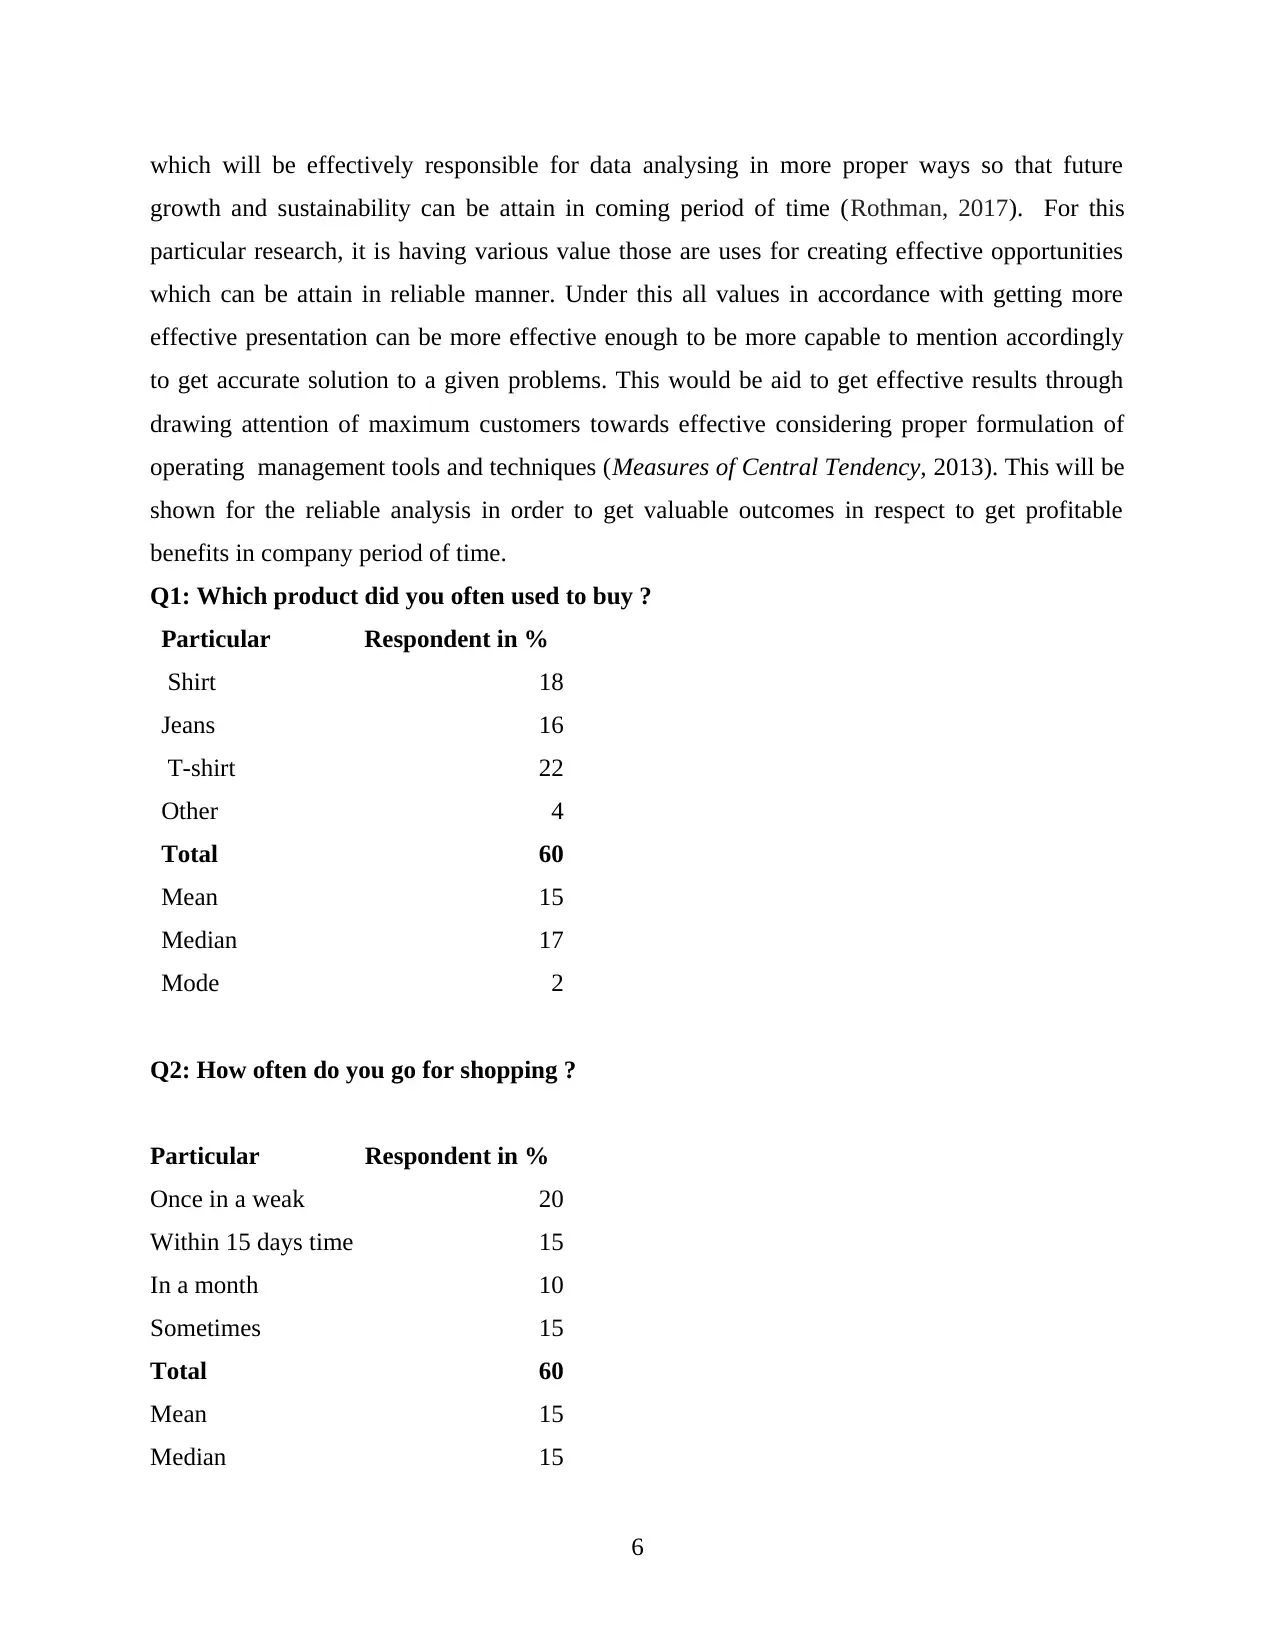
which will be effectively responsible for data analysing in more proper ways so that future
growth and sustainability can be attain in coming period of time (Rothman, 2017). For this
particular research, it is having various value those are uses for creating effective opportunities
which can be attain in reliable manner. Under this all values in accordance with getting more
effective presentation can be more effective enough to be more capable to mention accordingly
to get accurate solution to a given problems. This would be aid to get effective results through
drawing attention of maximum customers towards effective considering proper formulation of
operating management tools and techniques (Measures of Central Tendency, 2013). This will be
shown for the reliable analysis in order to get valuable outcomes in respect to get profitable
benefits in company period of time.
Q1: Which product did you often used to buy ?
Particular Respondent in %
Shirt 18
Jeans 16
T-shirt 22
Other 4
Total 60
Mean 15
Median 17
Mode 2
Q2: How often do you go for shopping ?
Particular Respondent in %
Once in a weak 20
Within 15 days time 15
In a month 10
Sometimes 15
Total 60
Mean 15
Median 15
6
Mode 5
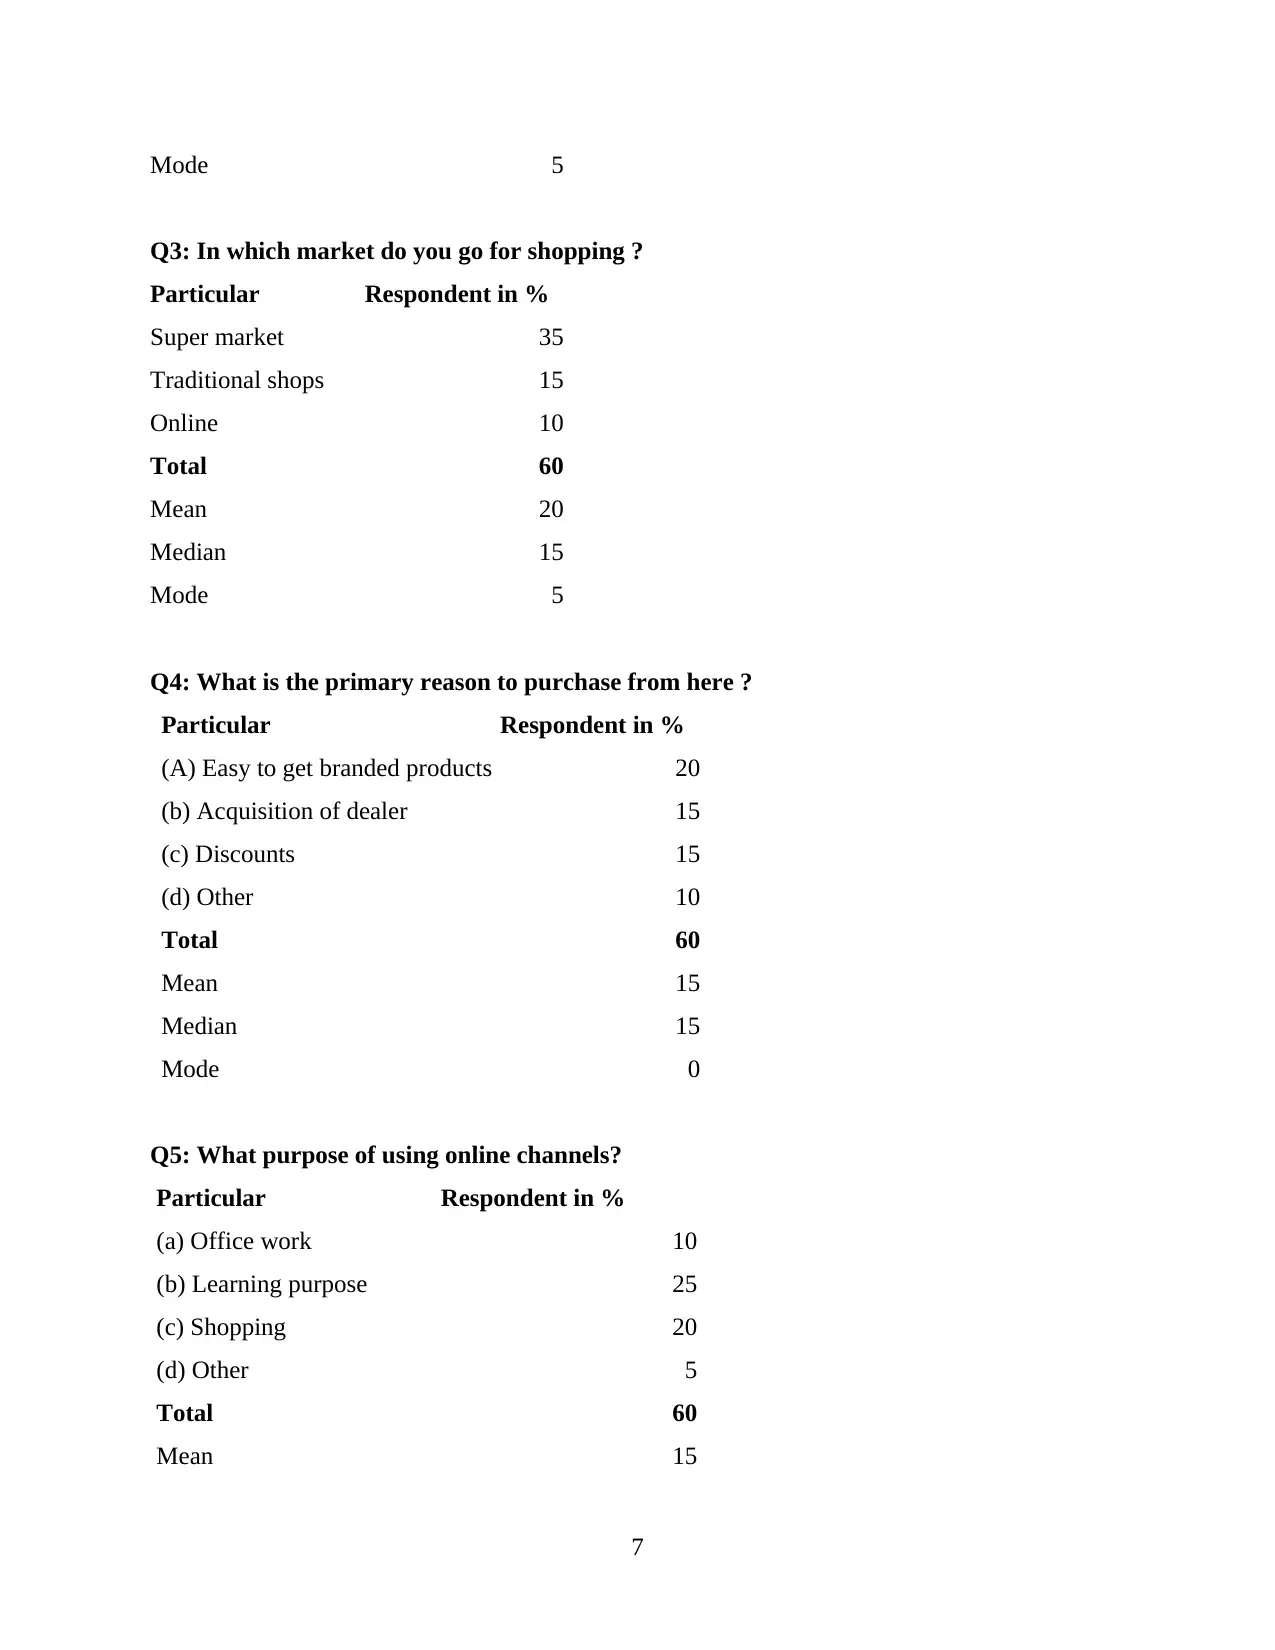
Q3: In which market do you go for shopping ?
Particular Respondent in %
Super market 35
Traditional shops 15
Online 10
Total 60
Mean 20
Median 15
Mode 5
Q4: What is the primary reason to purchase from here ?
Particular Respondent in %
(A) Easy to get branded products 20
(b) Acquisition of dealer 15
(c) Discounts 15
(d) Other 10
Total 60
Mean 15
Median 15
Mode 0
Q5: What purpose of using online channels?
Particular Respondent in %
(a) Office work 10
(b) Learning purpose 25
(c) Shopping 20
(d) Other 5
Total 60
Mean 15
7
⊘ This is a preview!⊘
Do you want full access?
Subscribe today to unlock all pages.
Trusted by 1+ million students worldwide
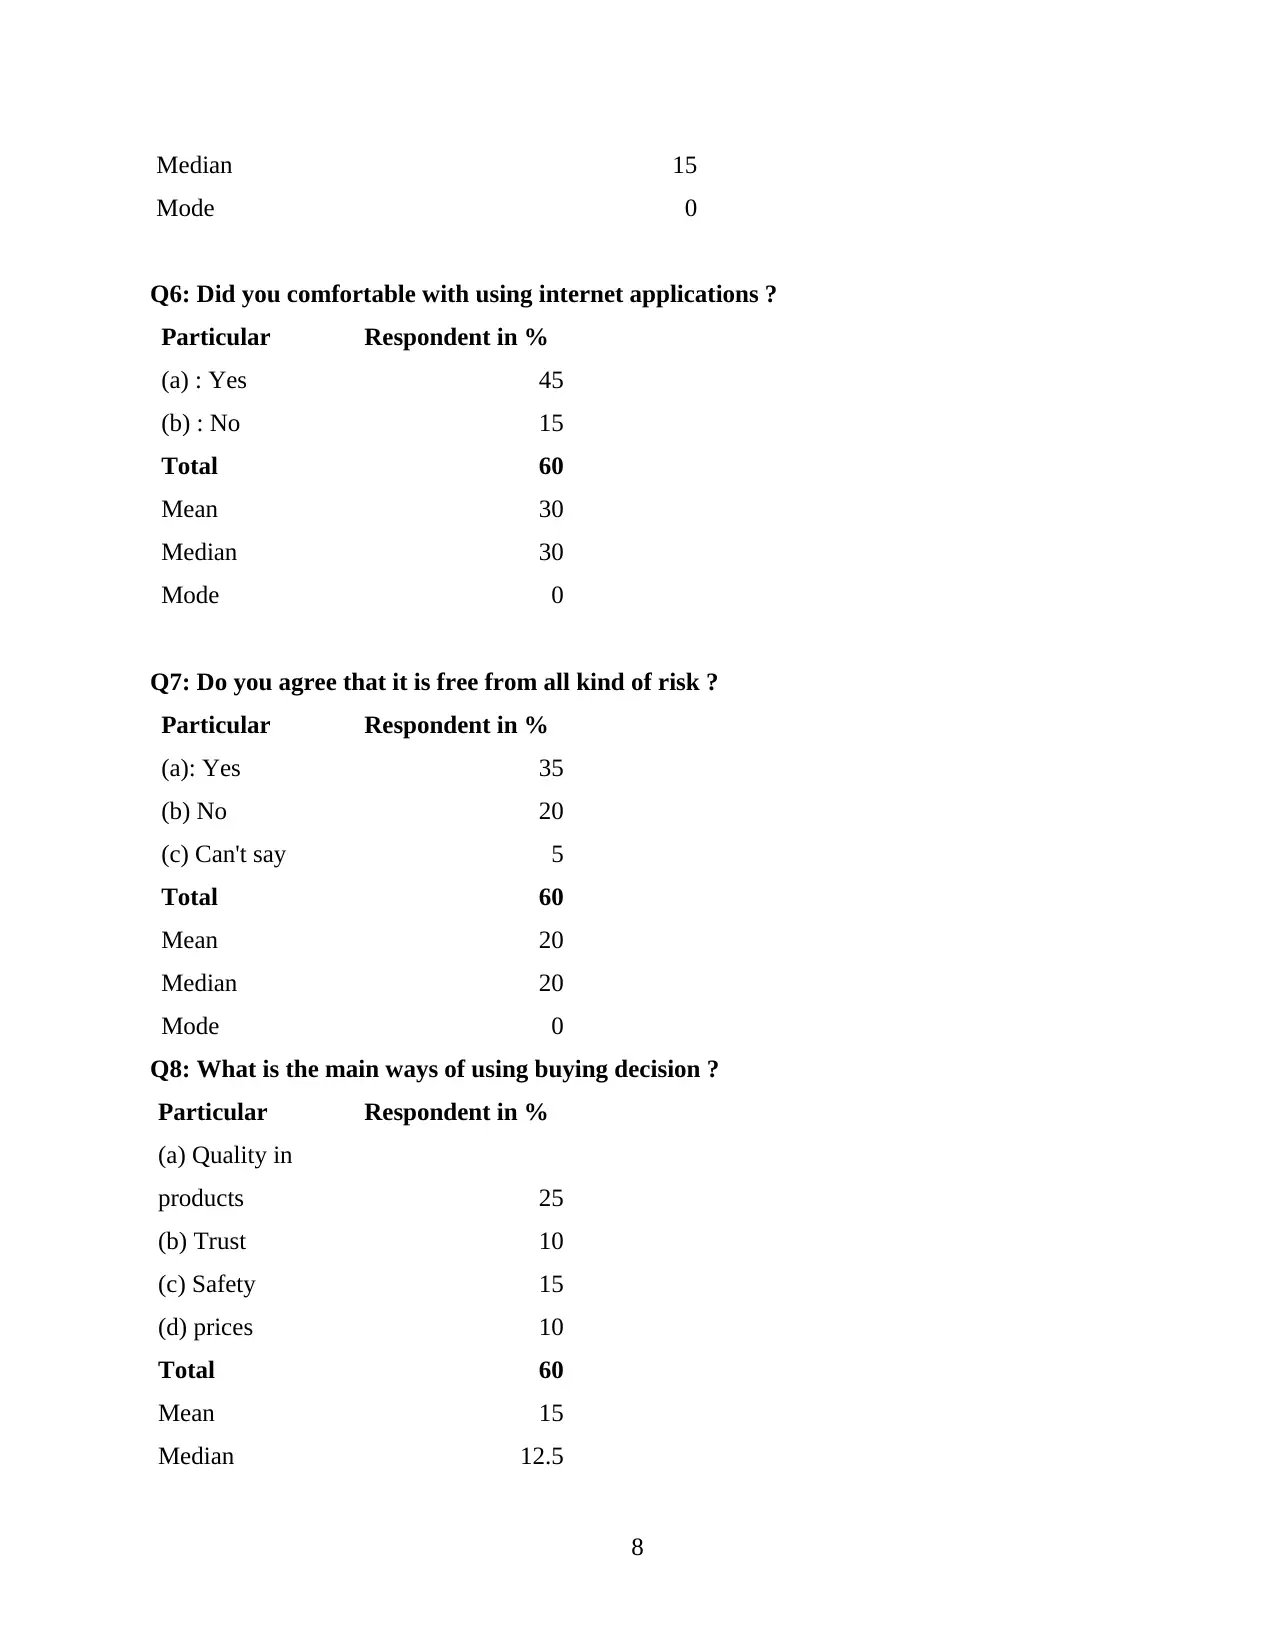
Median 15
Mode 0
Q6: Did you comfortable with using internet applications ?
Particular Respondent in %
(a) : Yes 45
(b) : No 15
Total 60
Mean 30
Median 30
Mode 0
Q7: Do you agree that it is free from all kind of risk ?
Particular Respondent in %
(a): Yes 35
(b) No 20
(c) Can't say 5
Total 60
Mean 20
Median 20
Mode 0
Q8: What is the main ways of using buying decision ?
Particular Respondent in %
(a) Quality in
products 25
(b) Trust 10
(c) Safety 15
(d) prices 10
Total 60
Mean 15
Median 12.5
8
Mode 0
Q6: Did you comfortable with using internet applications ?
Particular Respondent in %
(a) : Yes 45
(b) : No 15
Total 60
Mean 30
Median 30
Mode 0
Q7: Do you agree that it is free from all kind of risk ?
Particular Respondent in %
(a): Yes 35
(b) No 20
(c) Can't say 5
Total 60
Mean 20
Median 20
Mode 0
Q8: What is the main ways of using buying decision ?
Particular Respondent in %
(a) Quality in
products 25
(b) Trust 10
(c) Safety 15
(d) prices 10
Total 60
Mean 15
Median 12.5
8
Paraphrase This Document
Need a fresh take? Get an instant paraphrase of this document with our AI Paraphraser
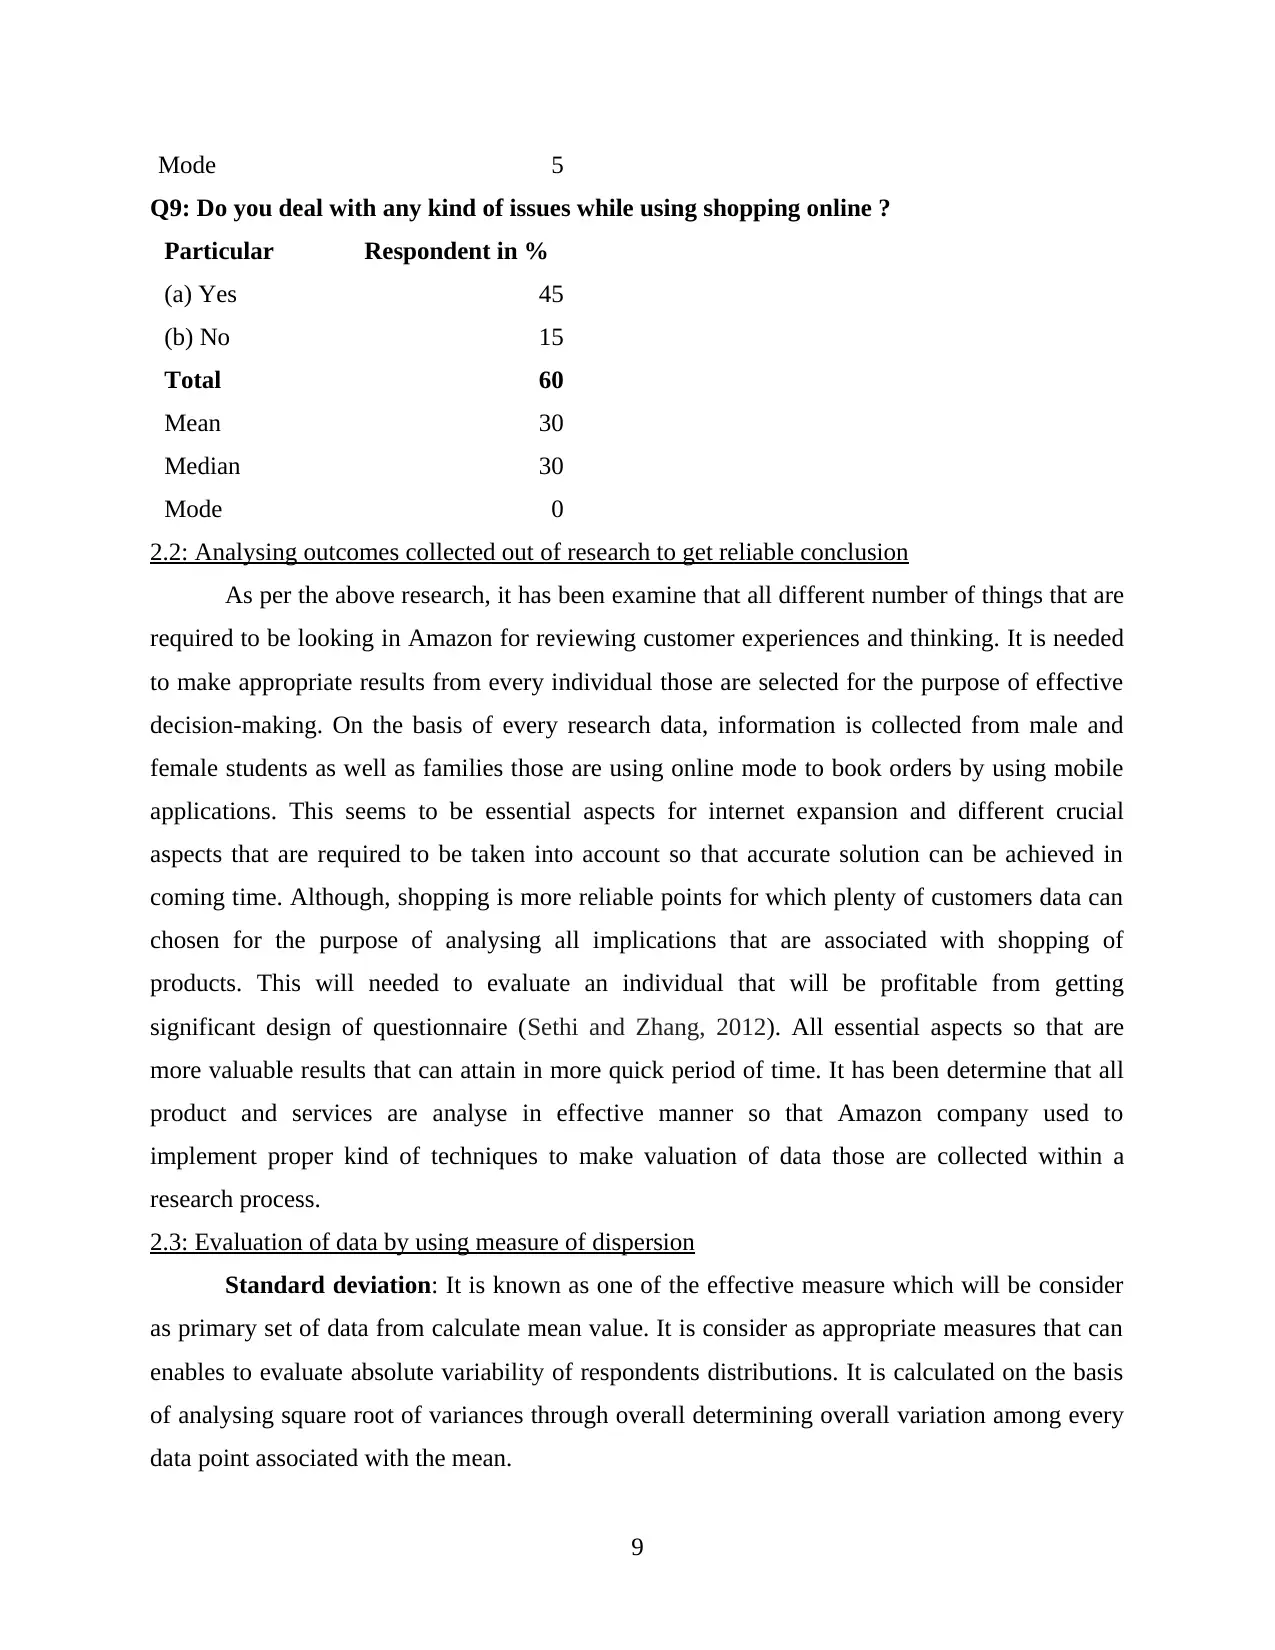
Mode 5
Q9: Do you deal with any kind of issues while using shopping online ?
Particular Respondent in %
(a) Yes 45
(b) No 15
Total 60
Mean 30
Median 30
Mode 0
2.2: Analysing outcomes collected out of research to get reliable conclusion
As per the above research, it has been examine that all different number of things that are
required to be looking in Amazon for reviewing customer experiences and thinking. It is needed
to make appropriate results from every individual those are selected for the purpose of effective
decision-making. On the basis of every research data, information is collected from male and
female students as well as families those are using online mode to book orders by using mobile
applications. This seems to be essential aspects for internet expansion and different crucial
aspects that are required to be taken into account so that accurate solution can be achieved in
coming time. Although, shopping is more reliable points for which plenty of customers data can
chosen for the purpose of analysing all implications that are associated with shopping of
products. This will needed to evaluate an individual that will be profitable from getting
significant design of questionnaire (Sethi and Zhang, 2012). All essential aspects so that are
more valuable results that can attain in more quick period of time. It has been determine that all
product and services are analyse in effective manner so that Amazon company used to
implement proper kind of techniques to make valuation of data those are collected within a
research process.
2.3: Evaluation of data by using measure of dispersion
Standard deviation: It is known as one of the effective measure which will be consider
as primary set of data from calculate mean value. It is consider as appropriate measures that can
enables to evaluate absolute variability of respondents distributions. It is calculated on the basis
of analysing square root of variances through overall determining overall variation among every
data point associated with the mean.
9
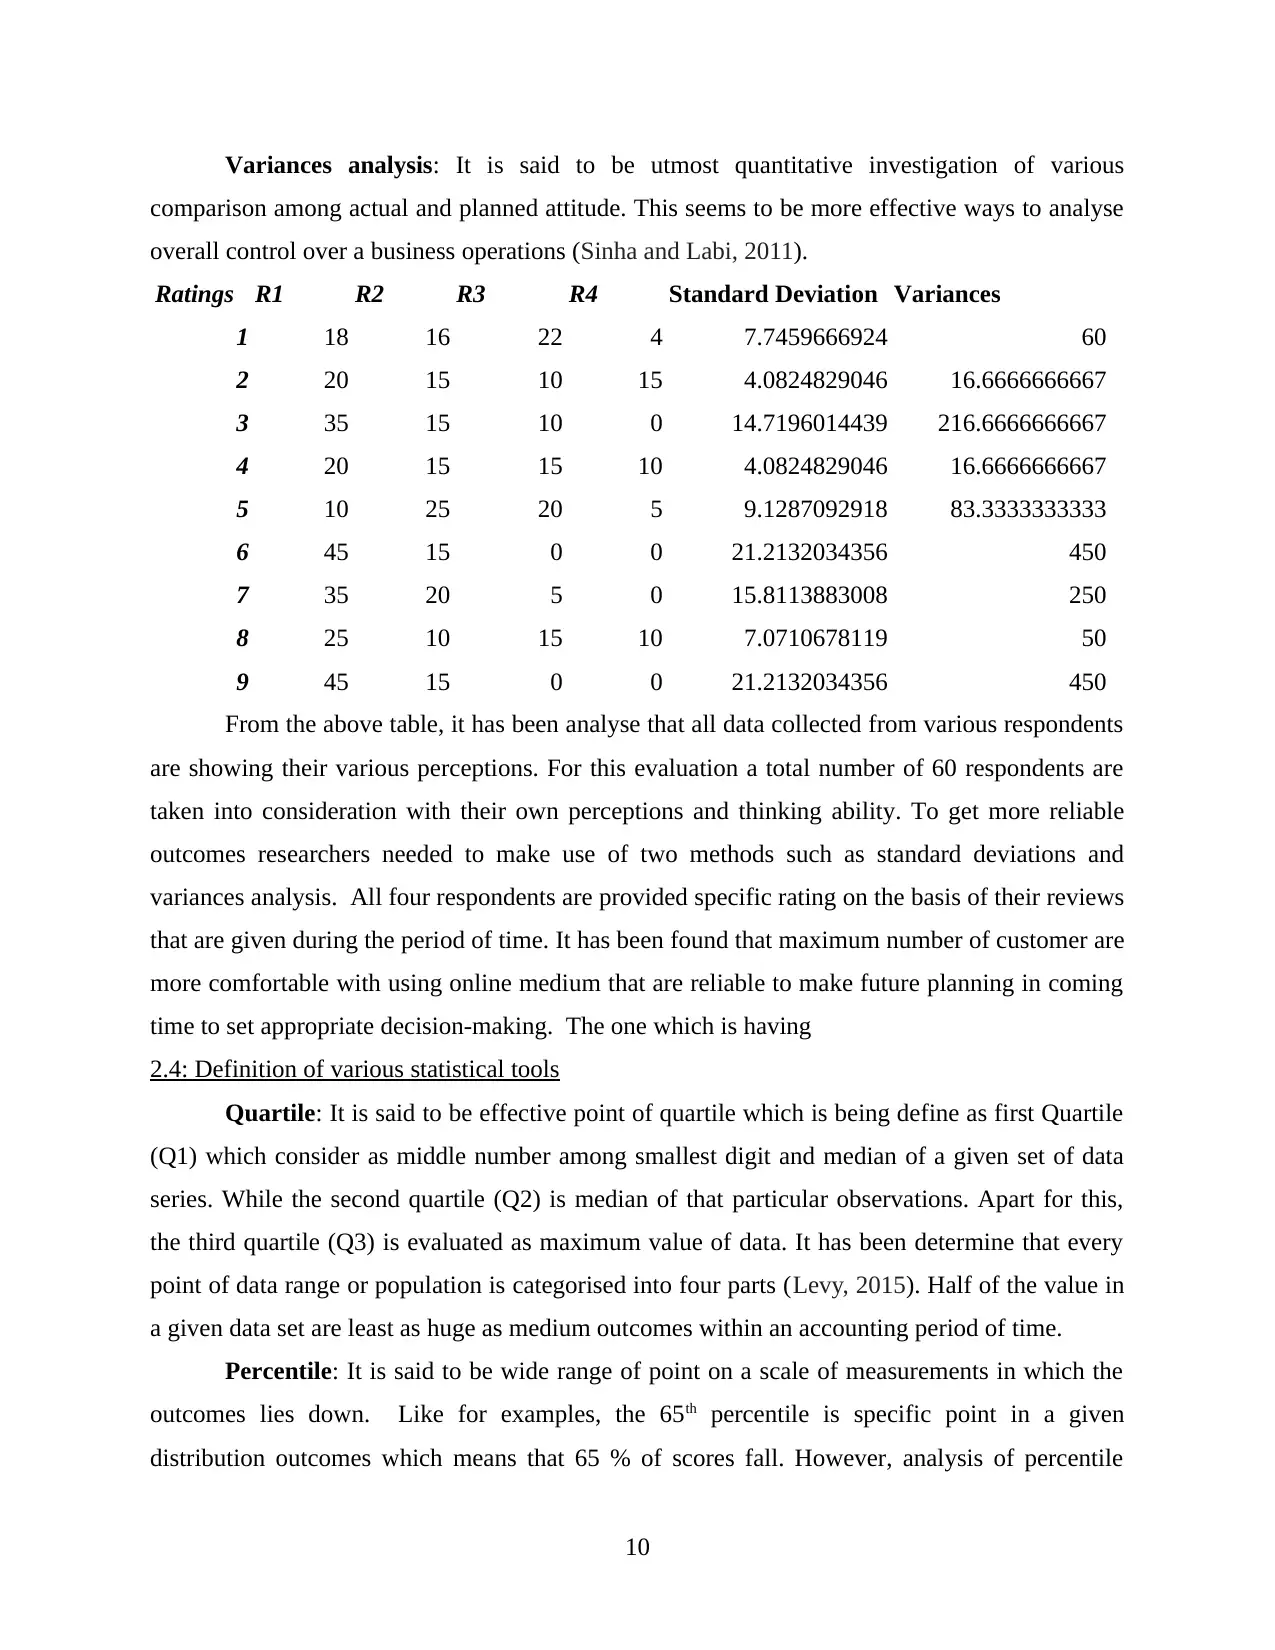
Variances analysis: It is said to be utmost quantitative investigation of various
comparison among actual and planned attitude. This seems to be more effective ways to analyse
overall control over a business operations (Sinha and Labi, 2011).
Ratings R1 R2 R3 R4 Standard Deviation Variances
1 18 16 22 4 7.7459666924 60
2 20 15 10 15 4.0824829046 16.6666666667
3 35 15 10 0 14.7196014439 216.6666666667
4 20 15 15 10 4.0824829046 16.6666666667
5 10 25 20 5 9.1287092918 83.3333333333
6 45 15 0 0 21.2132034356 450
7 35 20 5 0 15.8113883008 250
8 25 10 15 10 7.0710678119 50
9 45 15 0 0 21.2132034356 450
From the above table, it has been analyse that all data collected from various respondents
are showing their various perceptions. For this evaluation a total number of 60 respondents are
taken into consideration with their own perceptions and thinking ability. To get more reliable
outcomes researchers needed to make use of two methods such as standard deviations and
variances analysis. All four respondents are provided specific rating on the basis of their reviews
that are given during the period of time. It has been found that maximum number of customer are
more comfortable with using online medium that are reliable to make future planning in coming
time to set appropriate decision-making. The one which is having
2.4: Definition of various statistical tools
Quartile: It is said to be effective point of quartile which is being define as first Quartile
(Q1) which consider as middle number among smallest digit and median of a given set of data
series. While the second quartile (Q2) is median of that particular observations. Apart for this,
the third quartile (Q3) is evaluated as maximum value of data. It has been determine that every
point of data range or population is categorised into four parts (Levy, 2015). Half of the value in
a given data set are least as huge as medium outcomes within an accounting period of time.
Percentile: It is said to be wide range of point on a scale of measurements in which the
outcomes lies down. Like for examples, the 65th percentile is specific point in a given
distribution outcomes which means that 65 % of scores fall. However, analysis of percentile
10
⊘ This is a preview!⊘
Do you want full access?
Subscribe today to unlock all pages.
Trusted by 1+ million students worldwide
1 out of 22
Related Documents


Your All-in-One AI-Powered Toolkit for Academic Success.
+13062052269
info@desklib.com
Available 24*7 on WhatsApp / Email
![[object Object]](/_next/static/media/star-bottom.7253800d.svg)
Unlock your academic potential
Copyright © 2020–2026 A2Z Services. All Rights Reserved. Developed and managed by ZUCOL.