Business Decision Making: Data Analysis for Balti Palace Expansion
VerifiedAdded on 2020/06/06
|22
|4216
|117
Report
AI Summary
This report provides a detailed analysis of business decision-making processes, focusing on the expansion of the Balti Palace restaurant chain. It begins by outlining a plan for collecting both primary and secondary data, followed by a discussion of the survey methodology and sampling frame used, along with the design of a customer questionnaire. The report then delves into data analysis techniques, including the creation of representative values, trend analysis, and the use of measures of dispersion to draw valid conclusions in a business context. Charts, graphs, and financial tools are employed to support decision-making, culminating in a business presentation and a formal business report. The analysis includes the use of mean, median, and mode to summarize data, and the application of these techniques to sales and profit figures over several years. The report concludes with recommendations for Balti Palace's future expansion based on the data analysis and customer feedback.

BUSINESS DECISION
MAKING
MAKING
Paraphrase This Document
Need a fresh take? Get an instant paraphrase of this document with our AI Paraphraser
Table of Contents
INTRODUCTION...........................................................................................................................1
TASK 1............................................................................................................................................1
1.1 Produce a plan for collection of primary and secondary data for a given business problem1
1.2 Present the survey methodology and sampling frame used..................................................2
1.3 Design a questionnaire for a given business problem...........................................................3
TASK 2............................................................................................................................................4
2.1 Create information for decision making by summarising data using representative values.4
2.2 Analyse the results to draw valid conclusion in a business context......................................6
2.3 Analyse data using measures of dispersion as per given business scenario.........................7
2.4 Quartiles, percentiles and the correlation coefficient used for conclusion...........................8
TASK 3............................................................................................................................................9
3.1 Graphs and charts to produce valid conclusion based on the information derived...............9
3.2 Trend lines in spreadsheet graphs to assist in forecasting for specified business
information................................................................................................................................13
3.3 Business presentation using suitable software and techniques to disseminate information
...................................................................................................................................................14
3.4 Formal business report........................................................................................................14
TASK 4..........................................................................................................................................15
4.1 Appropriate information processing tools...........................................................................15
4.2 Prepare a project plan for an activity and determine the critical path.................................17
4.3 using financial tools for decision making...........................................................................19
CONCLUSION..............................................................................................................................19
REFERENCES..............................................................................................................................20
INTRODUCTION
Business decision making is considered as a concept which is known as decision making
tool. It helps to analyse the proposed plans and strategic management decision which remain
associated with the growth and development of an organisation (Yang and et. al., 2011). This
report is prepared to define various type of sources for the collection of data both primary and
secondary. Range of techniques are defined to analyse data effectively for business purpose.
Balti Palace restaurant is opted organisation to define the aspects of business decision making
process to explore the size of business. Information is presented in specific format for effective
decision making in business context. Software generated information is used to analyse the data
and business equations.
TASK 1
1.1 Produce a plan for collection of primary and secondary data for a given business problem
Accurate information and details are main part for every organisation subject to
evaluating the project plan and exploring the scope of business at next level. It is seen that the
organisation which is able to produce the information in order to determine the cost of the project
and analyse the effectiveness of proposed plans for better forecast and plan. Business decision
making is one of the essential aspect which is introduced within the organisation to boost the
structure of organisation.
There is an expansion plan is proposed in respect of exploring the scope of Balti Palace
restaurant chain at further places. In decision making process critical analysis and evaluation
done in statistical form. Various type of strategies and plans are prepared subject to evaluating
the performance or organisation.
Primary data: this is one of the common sources of collecting information and details by
connecting with the responds and participants. This sources provides accurate information and
details by direct interaction. Figures and data are analyse with the help of collected information
from direct sources. It is seen that information and data which are directly analysed with this
sources produce relevant information and data associated with the project and plans.
Secondary data: this is considered one of the essential resources in order to determine
the relevant aspect associated with task and project (Tzeng and Huang, 2011). There is a use of
implemented research and data are used to get relevant information and details. Data and figures
are taken as a supportive tools subject to execute project plans and task.
1
⊘ This is a preview!⊘
Do you want full access?
Subscribe today to unlock all pages.
Trusted by 1+ million students worldwide
Research: this is one of the expensive method of collecting information and details
subject to analysing project plans and strategies. There is a basic research is done which contains
from basic structure to last stage. There are various type of research methodologies are
considered in this source of data. Mostly the data and information remain associated with the
project plans and tasks.
Questionnaire: this method is also considered one of the cost effective method subject to
analyse the data and information and data to effective analysis (Sethi and Zhang, 2012). There is
a set of question and queries are directly asked with the customers and public in respect of
analysing the nature and mind set of public.
Public opinion polls: this is the method of getting the results and opinion from people
with by collecting information and data directly from clients and customers. Specific group of
people are selected to get the general information in respect of project plans.
1.2 Present the survey methodology and sampling frame used
Survey method is considered as a research which is basically part of statistical research
and methodology. There are some essential information and aspects are covered to analyse the
results and performance analysis for better results. Various type of methods are used to
determine the comparability of project.
Descriptive research: this is one of the part of survey methodology which helps to
determine the aspects of project plans and tasks. This research contains the detailed analysis of
information and details subject to project plans and tasks. Descriptive research is also known as
complete research subject to analysing the capacity of bearing uncertainty and challenges.
Analysis of project plans are done form ground level.
Exploratory researches: this research methodology helps to bifurcate the nature of
project plans and tasks (Saaty and Peniwati, 2013). There is a specific order is prepared in this
methodology to ascertain the future exploration possibilities and expectations. Managers and
senior level authorities become eligible to detect the possible outcomes with the implementation
of project plans.
Quantitative and qualitative research: for analysing all the aspects and figures it is
required to explore the project plan in right direction. Qualitative and quantitate figures need to
be presented in the research methodology (Rothman, 2017.). Qualitative research indicates
towards positive and negative aspects which only represent the virtue and specifications of task
2
Paraphrase This Document
Need a fresh take? Get an instant paraphrase of this document with our AI Paraphraser
and projects. Whereas quantitative research helps to count the results and figures in numbers and
statistical format.
Sampling Framing: this method helps to determine the essential aspects and figures in
order to determine overall results. This method prevent the complexities subject to analysing the
results in group.
Random sampling: this method helps to identify the potential results and figures
regarding tasks and project plans (Routledge, Sinhaand Labi, 2011). It is essential to estimate the
results and figures to analyse wanted results. Random sampling indicates towards specific
criteria such as;
Customer price
Quality and facilities
Treatment given by staff members
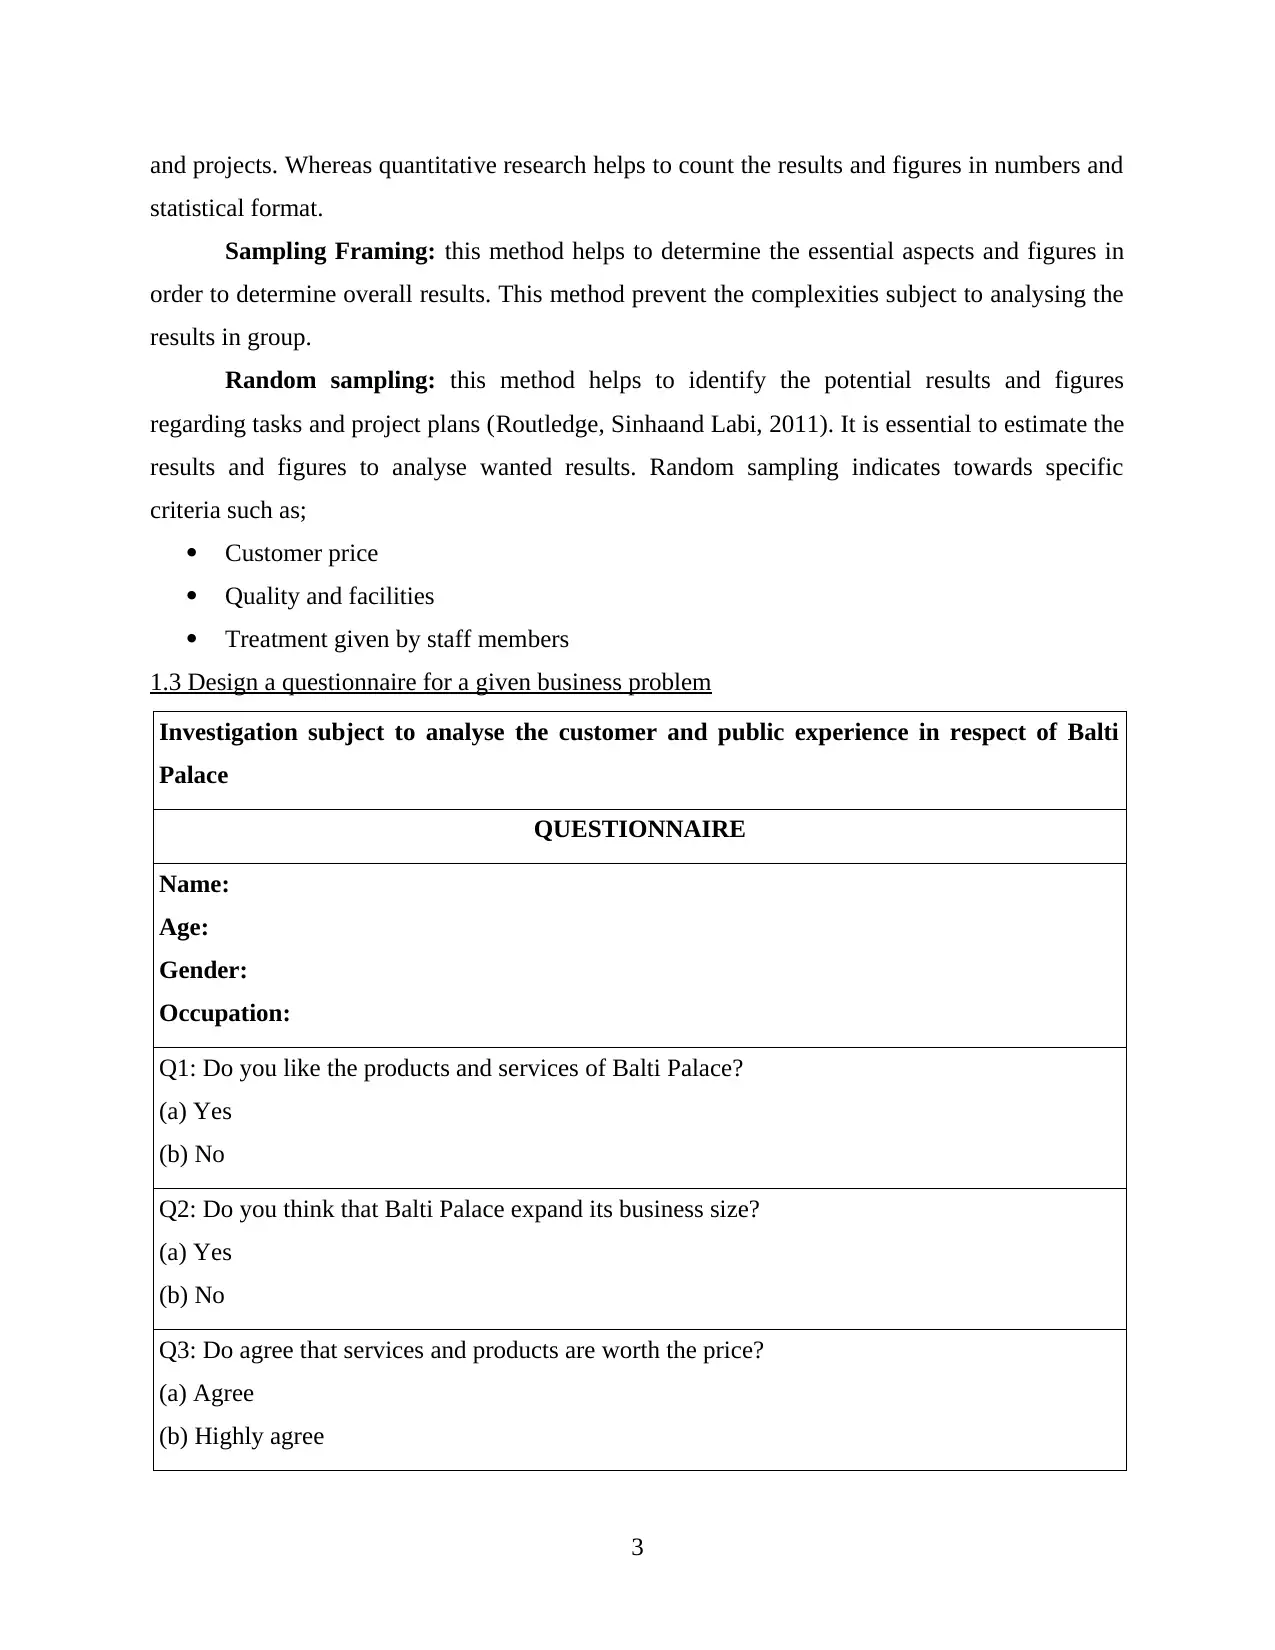
1.3 Design a questionnaire for a given business problem
Investigation subject to analyse the customer and public experience in respect of Balti
Palace
QUESTIONNAIRE
Name:
Age:
Gender:
Occupation:
Q1: Do you like the products and services of Balti Palace?
(a) Yes
(b) No
Q2: Do you think that Balti Palace expand its business size?
(a) Yes
(b) No
Q3: Do agree that services and products are worth the price?
(a) Agree
(b) Highly agree
3
statistical format.
Sampling Framing: this method helps to determine the essential aspects and figures in
order to determine overall results. This method prevent the complexities subject to analysing the
results in group.
Random sampling: this method helps to identify the potential results and figures
regarding tasks and project plans (Routledge, Sinhaand Labi, 2011). It is essential to estimate the
results and figures to analyse wanted results. Random sampling indicates towards specific
criteria such as;
Customer price
Quality and facilities
Treatment given by staff members
1.3 Design a questionnaire for a given business problem
Investigation subject to analyse the customer and public experience in respect of Balti
Palace
QUESTIONNAIRE
Name:
Age:
Gender:
Occupation:
Q1: Do you like the products and services of Balti Palace?
(a) Yes
(b) No
Q2: Do you think that Balti Palace expand its business size?
(a) Yes
(b) No
Q3: Do agree that services and products are worth the price?
(a) Agree
(b) Highly agree
3
(c) Neutral response
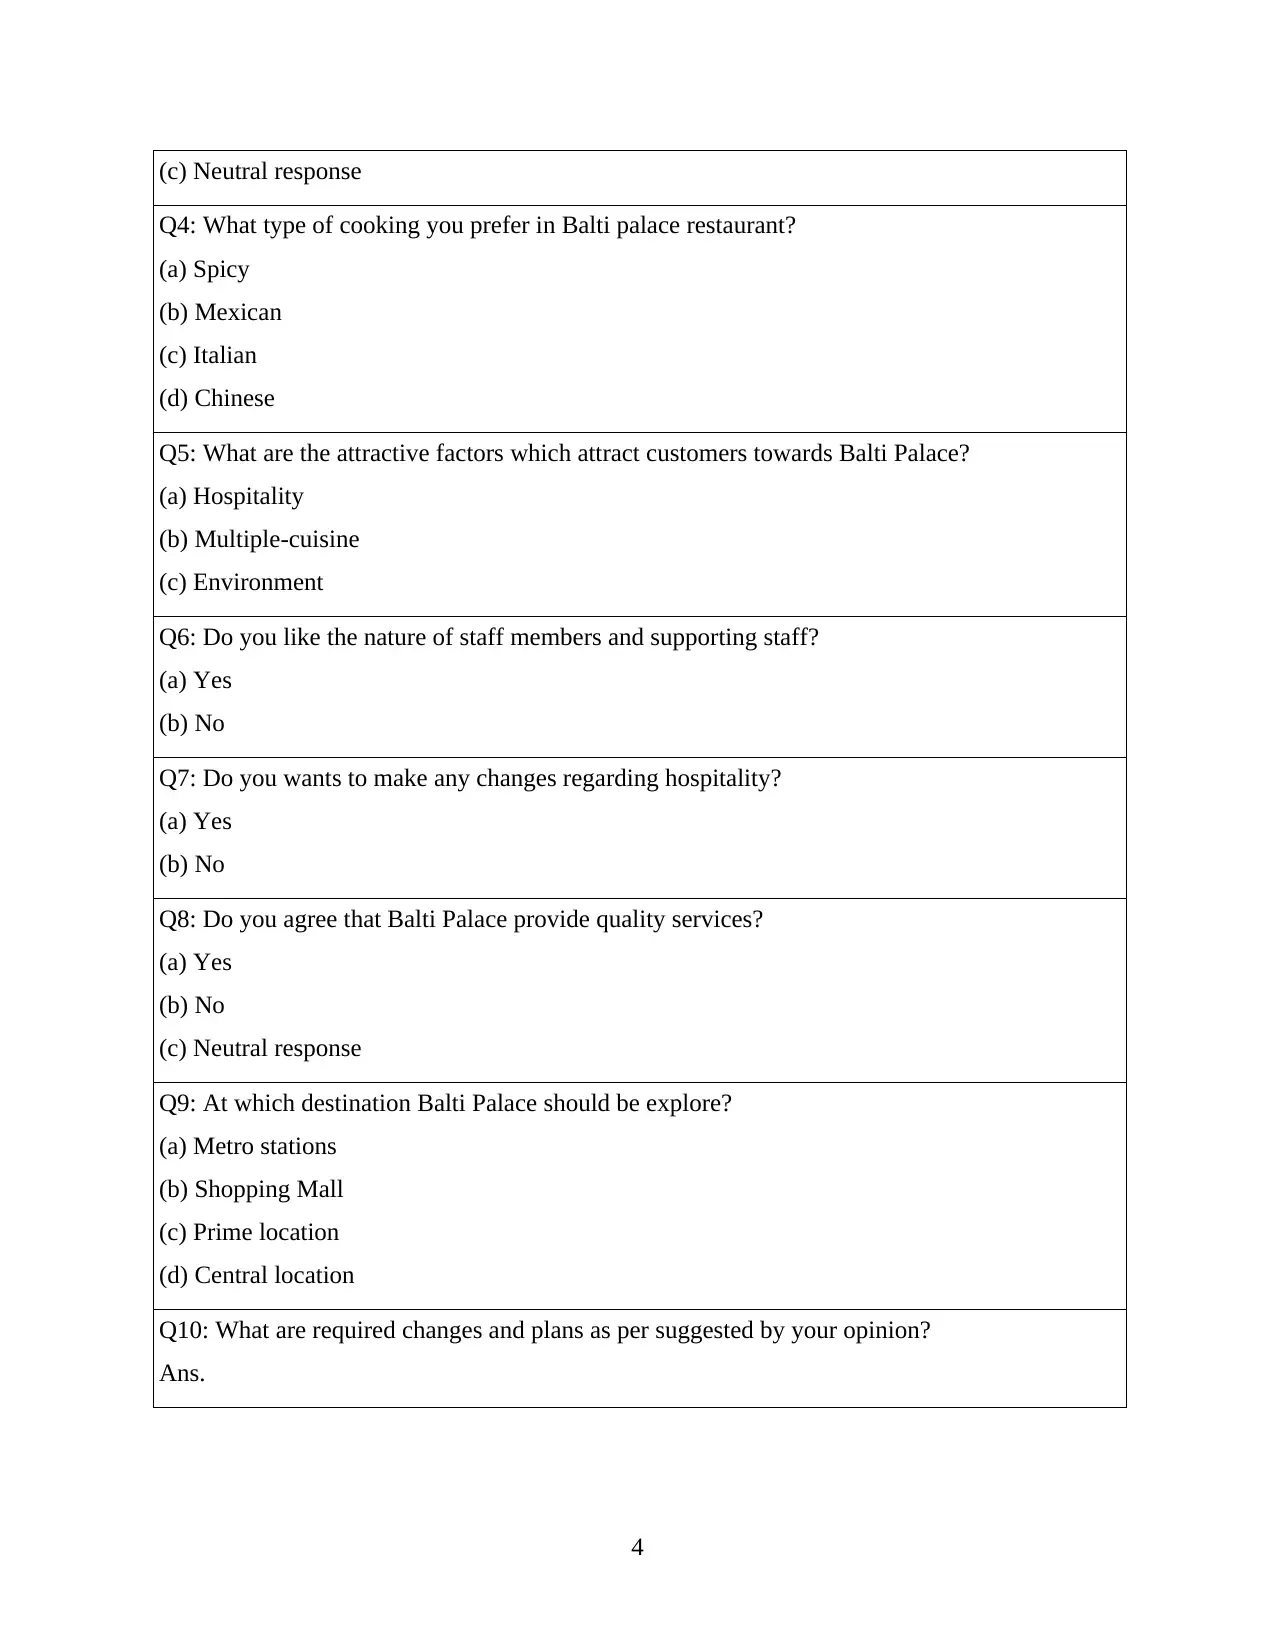
Q4: What type of cooking you prefer in Balti palace restaurant?
(a) Spicy
(b) Mexican
(c) Italian
(d) Chinese
Q5: What are the attractive factors which attract customers towards Balti Palace?
(a) Hospitality
(b) Multiple-cuisine
(c) Environment
Q6: Do you like the nature of staff members and supporting staff?
(a) Yes
(b) No
Q7: Do you wants to make any changes regarding hospitality?
(a) Yes
(b) No
Q8: Do you agree that Balti Palace provide quality services?
(a) Yes
(b) No
(c) Neutral response
Q9: At which destination Balti Palace should be explore?
(a) Metro stations
(b) Shopping Mall
(c) Prime location
(d) Central location
Q10: What are required changes and plans as per suggested by your opinion?
Ans.
4
⊘ This is a preview!⊘
Do you want full access?
Subscribe today to unlock all pages.
Trusted by 1+ million students worldwide
TASK 2
2.1 Create information for decision making by summarising data using representative values
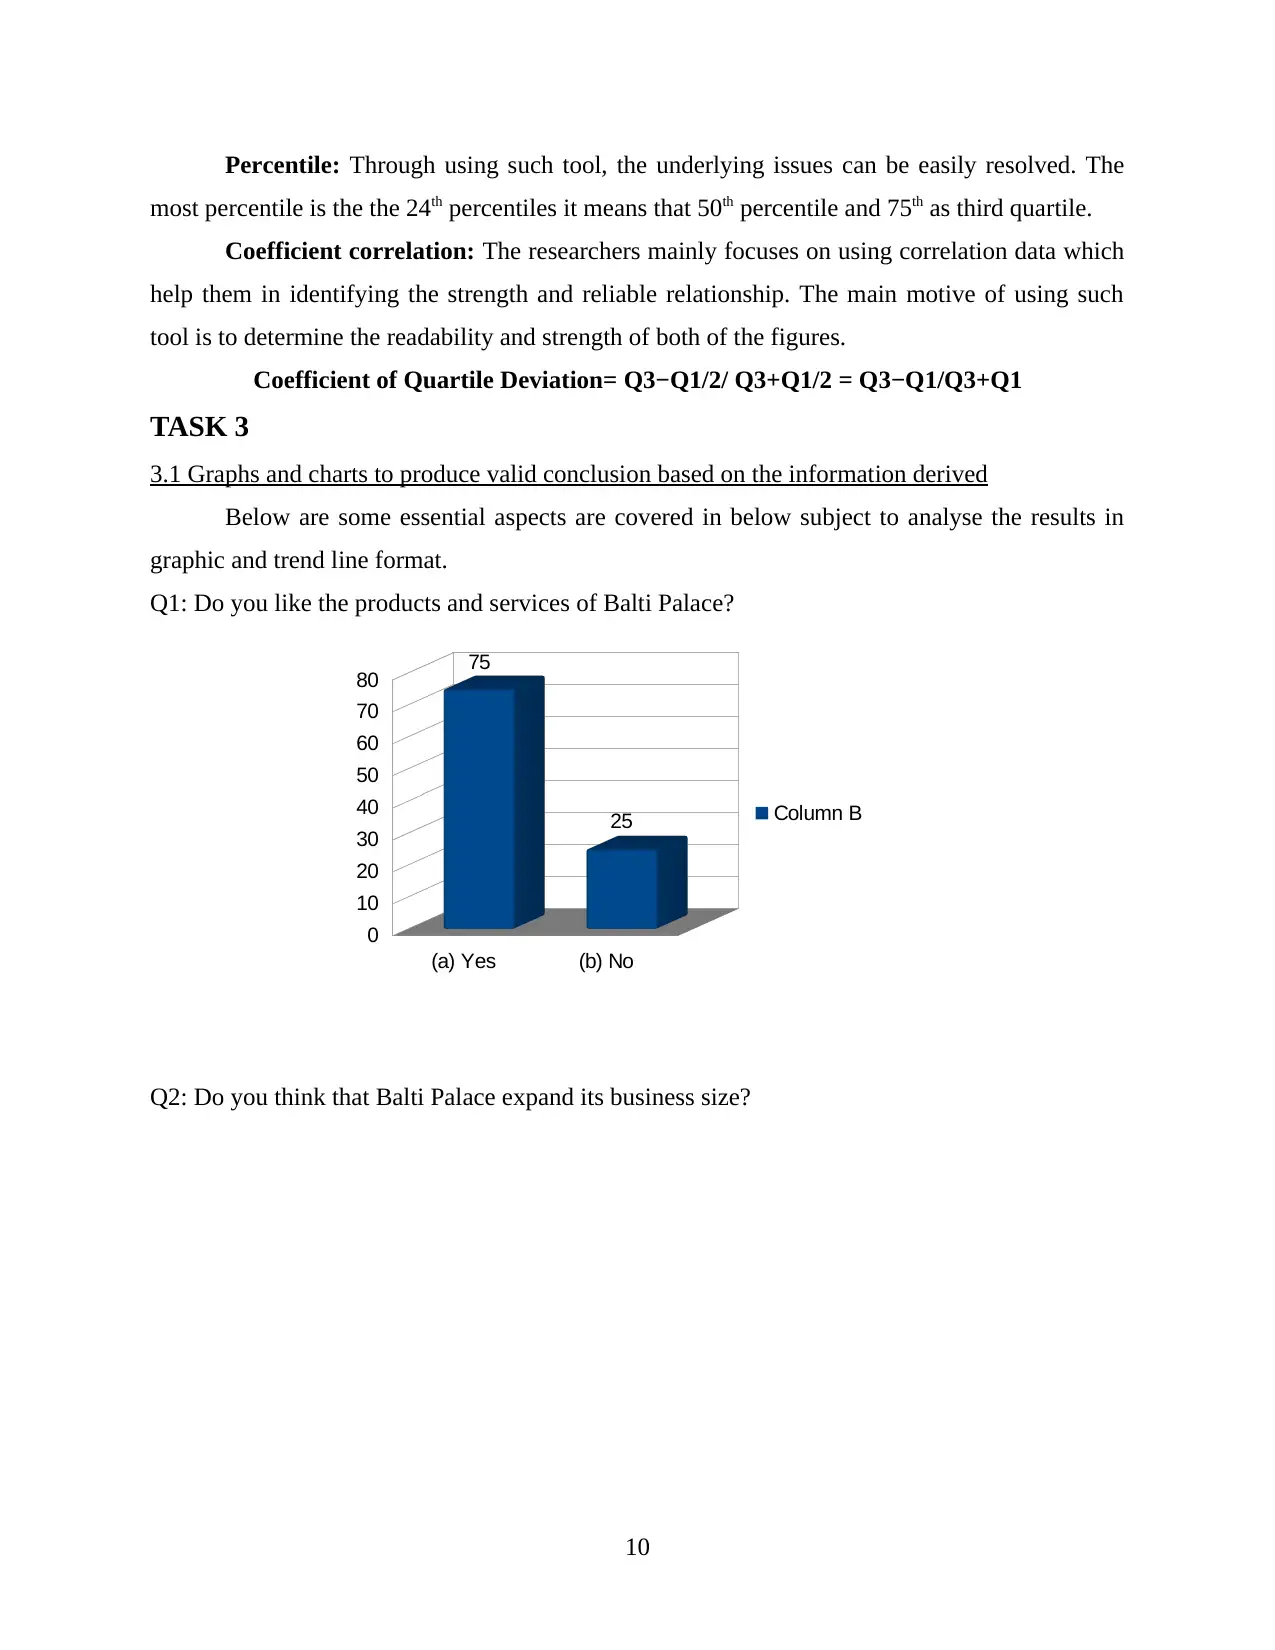
Q1: Do you like the products and services of Balti Palace?
Particular Figures
(a) Yes 75
(b) No 25
Total 100
Mean 50
Median 50
Mode 0
Q2: Do you think that Balti Palace expand its business size?
Particulars Figures
(a) Yes 78
(b) No 22
Total 100
Mean 50
Median 50
Mode 12
Q3: Do agree that services and products are worth the price?
Particular Figures
(a) Agree 55
(b) Highly agree 20
(c) Neutral response 25
Total 100
Mean 22.5
Median 22.5
Mode 20
Q4: What type of cooking you prefer in Balti palace restaurant?
5
2.1 Create information for decision making by summarising data using representative values
Q1: Do you like the products and services of Balti Palace?
Particular Figures
(a) Yes 75
(b) No 25
Total 100
Mean 50
Median 50
Mode 0
Q2: Do you think that Balti Palace expand its business size?
Particulars Figures
(a) Yes 78
(b) No 22
Total 100
Mean 50
Median 50
Mode 12
Q3: Do agree that services and products are worth the price?
Particular Figures
(a) Agree 55
(b) Highly agree 20
(c) Neutral response 25
Total 100
Mean 22.5
Median 22.5
Mode 20
Q4: What type of cooking you prefer in Balti palace restaurant?
5
Paraphrase This Document
Need a fresh take? Get an instant paraphrase of this document with our AI Paraphraser
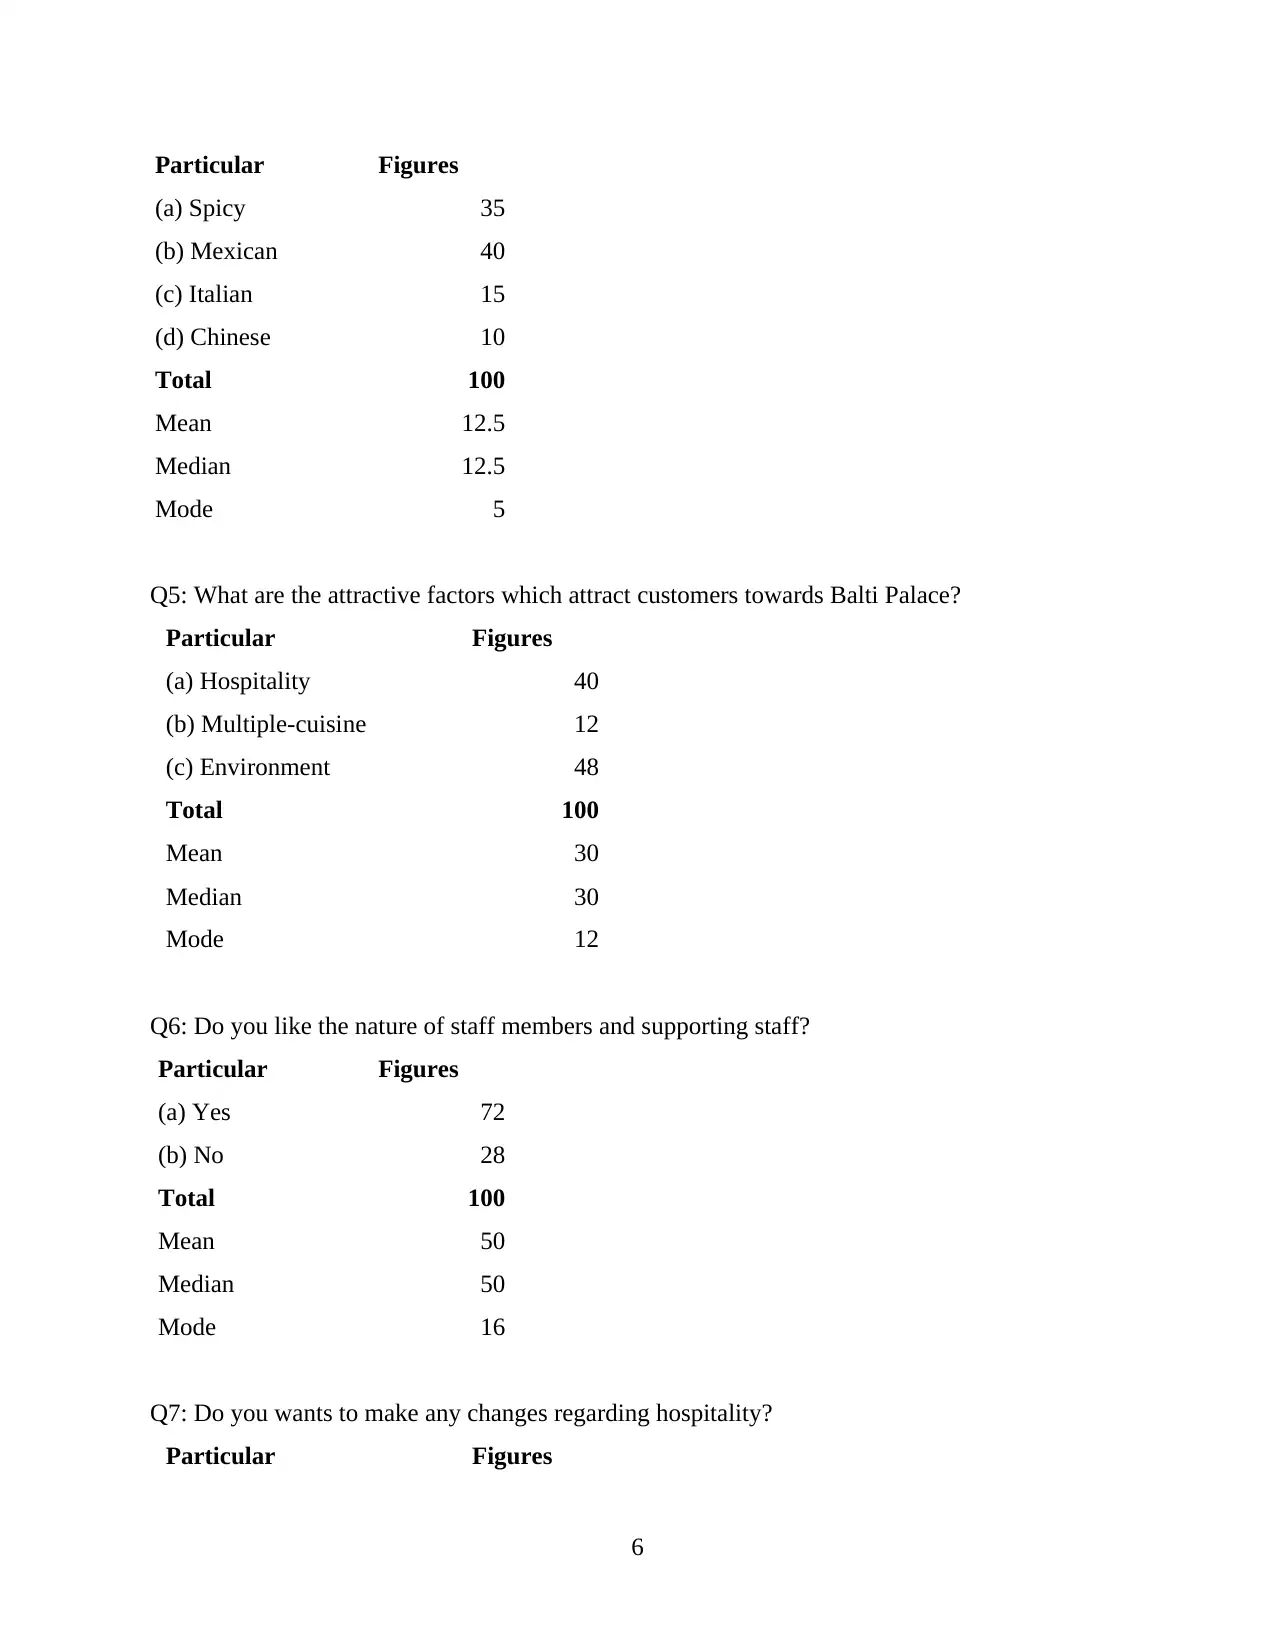
Particular Figures
(a) Spicy 35
(b) Mexican 40
(c) Italian 15
(d) Chinese 10
Total 100
Mean 12.5
Median 12.5
Mode 5
Q5: What are the attractive factors which attract customers towards Balti Palace?
Particular Figures
(a) Hospitality 40
(b) Multiple-cuisine 12
(c) Environment 48
Total 100
Mean 30
Median 30
Mode 12
Q6: Do you like the nature of staff members and supporting staff?
Particular Figures
(a) Yes 72
(b) No 28
Total 100
Mean 50
Median 50
Mode 16
Q7: Do you wants to make any changes regarding hospitality?
Particular Figures
6
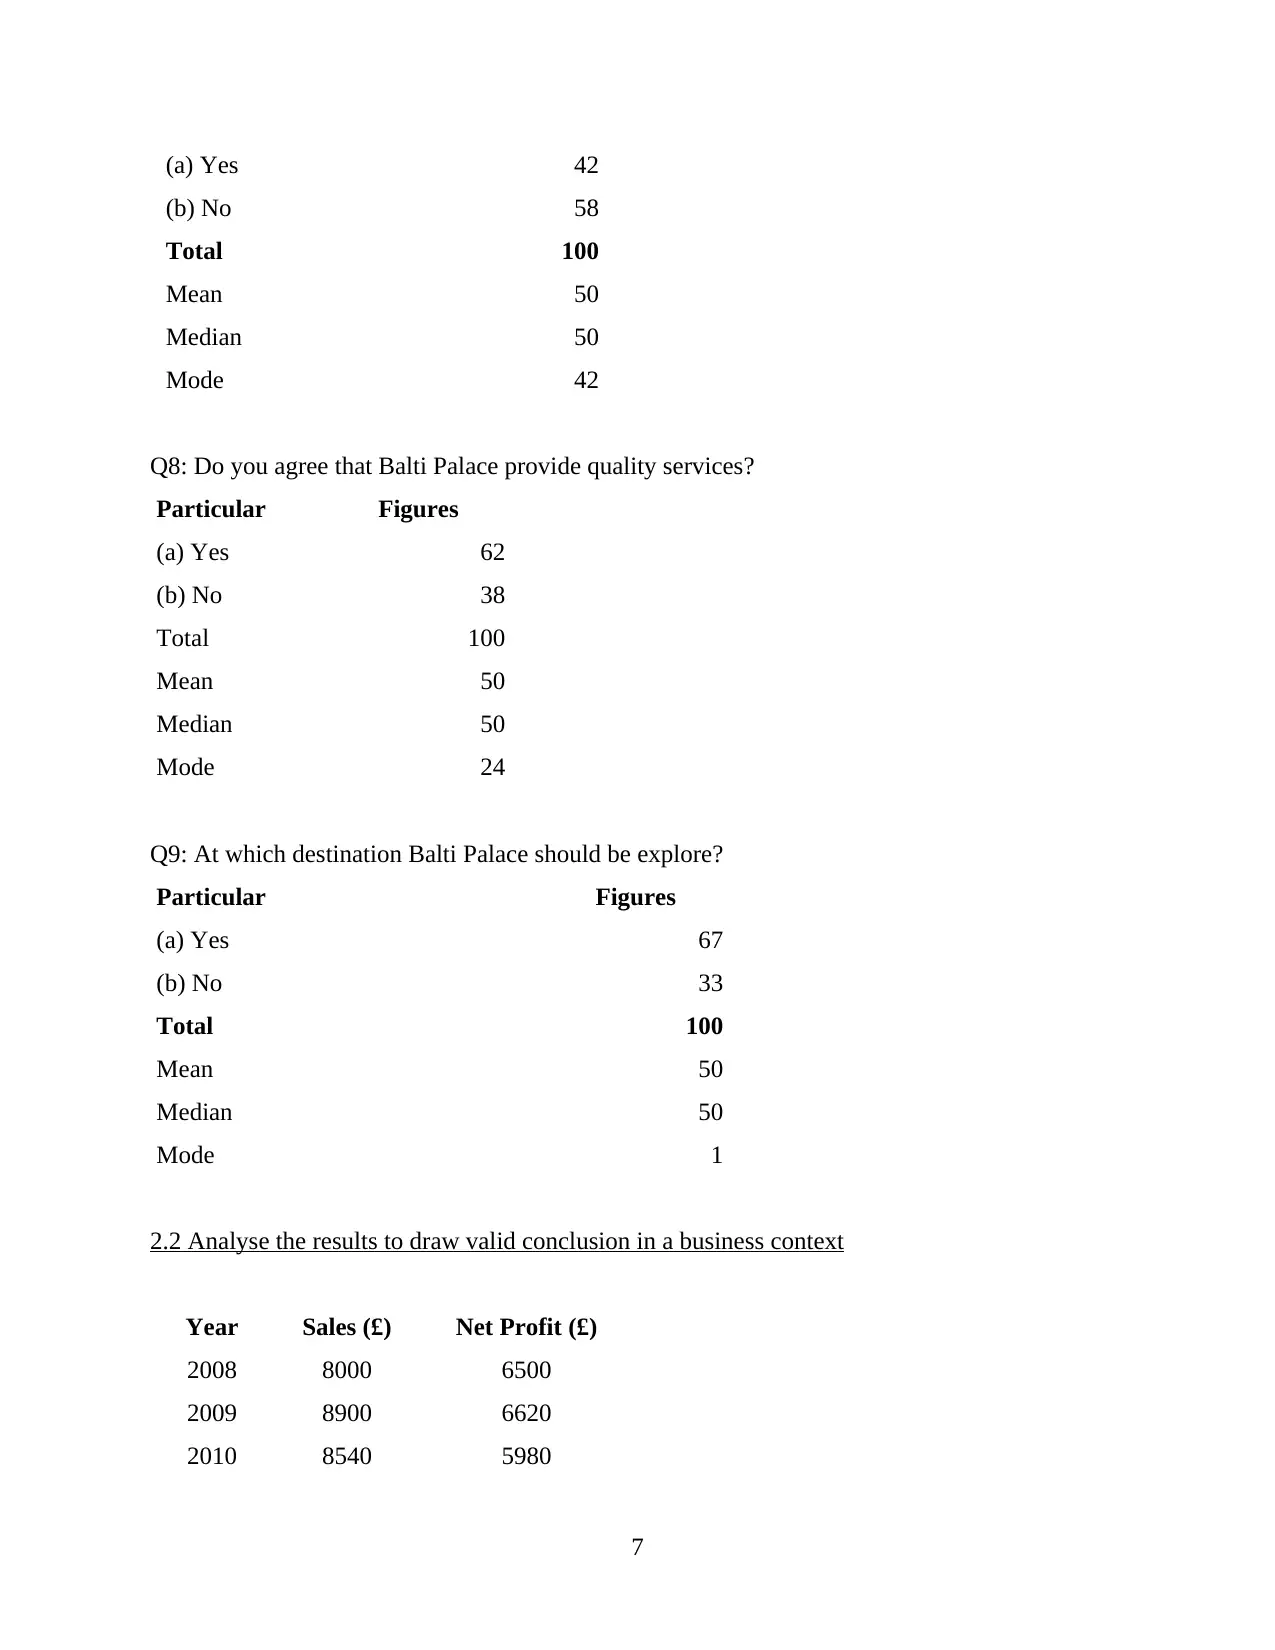
(a) Yes 42
(b) No 58
Total 100
Mean 50
Median 50
Mode 42
Q8: Do you agree that Balti Palace provide quality services?
Particular Figures
(a) Yes 62
(b) No 38
Total 100
Mean 50
Median 50
Mode 24
Q9: At which destination Balti Palace should be explore?
Particular Figures
(a) Yes 67
(b) No 33
Total 100
Mean 50
Median 50
Mode 1
2.2 Analyse the results to draw valid conclusion in a business context
Year Sales (£) Net Profit (£)
2008 8000 6500
2009 8900 6620
2010 8540 5980
7
⊘ This is a preview!⊘
Do you want full access?
Subscribe today to unlock all pages.
Trusted by 1+ million students worldwide
2011 9400 7000
2012 9500 7200
2013 9550 7500
2014 10650 8900
2015 11200 8950
2016 12500 9700
2017 12800 9800
Mean 10104 7815
Median 9525 7350
Mode 8000 6500
Mean: It basically indicates towards the average figures. An average number and figures
are considered in this method to evaluate the optimum level of project plans and strategies
(Measurement of Central tendency, 2017). The mean is called as an optimum level or figures
subject to proposed plan. It is calculated as the adding the numbers and calculated as
consolidated results. As per above analysis mean of sales and profit are calculated as £10104
and £7815.
Mean: ∑X/N
Median: It is calculate as data and which indicates towards main elements and data
which helps to analyse the cost of project. There is a set of data from smallest to the largest then
the number of elements added to main research. This basically indicates towards the middle
value from the table or frequency. As per the above data analysis there is median of sales is
computed as £9525 and for profit £7350.
Median: [L1 + (N/2) – c/F*i]
Mode: it is calculated that with the help of frequency levels. There is a measurement of
mode done with the help of upper limit and lower limit found in frequency. Mode indicates
towards the repetitive frequency of number in sets (Pourshahid, Richards and Amyot, 2011). As
per above analysis Mode of sales and profit are calculated as £8000 and £6500.
Mode: L + h ( fm – f1 / 2fm – f1 - f2 )
2.3 Analyse data using measures of dispersion as per given business scenario
Year Sales (£) Net Profit (£)
8
Paraphrase This Document
Need a fresh take? Get an instant paraphrase of this document with our AI Paraphraser
2008 8000 6500
2009 8900 6620
2010 8540 5980
2011 9400 7000
2012 9500 7200
2013 9550 7500
2014 10650 8900
2015 11200 8950
2016 12500 9700
2017 12800 9800
Particular Sales (£) Profit (£)
Maximum range 12800 9800
Minimum range 8000 5980
Standard deviation 1632.94 1399.41
Correlation coefficient 0.97
Range: it indicates toward the maximum number and minimum number presented in
series. As per above calculation maximum number is computed as £12800 and minimum range is
computed as £9800.
Standard deviation: there are following figures are identified subject to standard
deviation. Such as £1632.94 for sales and £1399.41 for profit.
σ : √∑Fdx2/N – (∑Fdx/N)2
Variance: it indicates towards the statistical results and information which are provided
to get estimated and accurate results subject to project plans.
Variances: S2 = ∑(X – X )2 / n-1
2.4 Quartiles, percentiles and the correlation coefficient used for conclusion
Quartile: It is considered as an effective method which is useful in calculating total
deviations in a given data series (Cosgrove and Rijsberman, 2014). The main advantage of using
this tool is that it doesn't requires mathematical obligations. It take mid 50% terms thus, it
measure better than range and percentile value.
Q.D. = Q3−Q1 / 2
9
Percentile: Through using such tool, the underlying issues can be easily resolved. The
most percentile is the the 24th percentiles it means that 50th percentile and 75th as third quartile.
Coefficient correlation: The researchers mainly focuses on using correlation data which
help them in identifying the strength and reliable relationship. The main motive of using such
tool is to determine the readability and strength of both of the figures.
Coefficient of Quartile Deviation= Q3−Q1/2/ Q3+Q1/2 = Q3−Q1/Q3+Q1
TASK 3
3.1 Graphs and charts to produce valid conclusion based on the information derived
Below are some essential aspects are covered in below subject to analyse the results in
graphic and trend line format.
Q1: Do you like the products and services of Balti Palace?
Q2: Do you think that Balti Palace expand its business size?
10
(a) Yes (b) No
0
10
20
30
40
50
60
70
80 75
25 Column B
⊘ This is a preview!⊘
Do you want full access?
Subscribe today to unlock all pages.
Trusted by 1+ million students worldwide
1 out of 22
Related Documents


Your All-in-One AI-Powered Toolkit for Academic Success.
+13062052269
info@desklib.com
Available 24*7 on WhatsApp / Email
![[object Object]](/_next/static/media/star-bottom.7253800d.svg)
Unlock your academic potential
Copyright © 2020–2026 A2Z Services. All Rights Reserved. Developed and managed by ZUCOL.