Business Decision Making Report: Analysis of ABC Company's Operations
VerifiedAdded on 2019/12/03
|22
|4282
|162
Report
AI Summary
This report analyzes the business decision-making process for ABC Company, a fresh juice manufacturer and retailer. It begins with an introduction to the importance of effective decision-making in the current business environment, highlighting the use of statistical tools and market analysis. Task 1 focuses on data collection methods, including primary data through surveys and secondary data from various sources. Task 2 delves into the analysis of collected data, summarizing sales and profit data, analyzing primary data results, and using measures of dispersion to assess data variability. The report also explores the use of quartile, quantile, and correlation coefficients in relation to the fresh juice drink market. Task 3 discusses the use of spreadsheet graphs, trend lines for forecasting, business presentations, and formal business report production. Task 4 covers the use of information processing and financial tools, along with project planning and critical path determination. The report concludes by summarizing the findings and providing references.

Business Decision Making
Paraphrase This Document
Need a fresh take? Get an instant paraphrase of this document with our AI Paraphraser
Table of Contents
INTRODUCTION ..........................................................................................................................1
TASK 1............................................................................................................................................1
1.1 Planning for the collection of primary and secondary data...................................................1
1.2 Presenting the survey methodology and sampling frame used for the research purpose......2
1.3 Designing of questionnaire...................................................................................................3
TASK 2............................................................................................................................................4
2.1 Summarization of secondary data which aid in the decision making...................................4
2.2 Analysis of the result ............................................................................................................5
2.3 Analysis of data by using measures of dispersion................................................................7
2.4 Use of quartile, quantile and correlation coefficient for the decision making in relation to
the the fresh juice drink market...................................................................................................8
TASK 3............................................................................................................................................9
3.1 Producing graph by using spreadsheet to draw the valid conclusion....................................9
3.2 Creation of the trend line to forecast the business trend.....................................................11
3.3 Business presentation for the effective dissemination of information................................11
3.4 Producing of formal business report...................................................................................12
TASK 4..........................................................................................................................................12
4.1 Using suitable information processing tools.......................................................................12
4.2 Preparing a project plan and determining the critical path ................................................13
4.3 Use of financial tools in the decision making aspects.........................................................15
CONCLUSION..............................................................................................................................16
REFERENCES..............................................................................................................................17
INTRODUCTION
Looking at the present business environment it has become important for the senior
authority to make smart and effective judgment so that operations can be executed in the best
possible manner and generates desired results and outcomes (How to Make Effective Business
Decisions, 2015). Thus, making optimum utilization of available tools and techniques as well as
assessing the conditions of market always assist in making reliable decisions (Ferrell and
Fraedrich, 2014). The present report is based upon ABC Company which is the fresh juice
manufacturer and retailer in London. Through the means of different statistical tools and
graphical presentation assist in providing better understanding to managers so that they can make
the best possible judgment. Besides this, it states secondary research to identify the size and
potential of market. Further, it develops an understanding regarding the measures of dispersion
which helps in analyzing the large amount of data. It also states the use of information
processing tools and financial tools in the decision making aspects.
TASK 1
1.1
For carrying out the research it is important for the investigator to collect wide range of
data or information so that in-depth analysis can be made. Herein, report focuses on gathering
data related to the demand of fresh juice in the market and for which researcher undertakes
primary and secondary data collection methods. The main purpose behind using both these
methods is that it helps in developing suitable base for the investigator form which smart
conclusion or recommendations can be made. Both primary and secondary data helps the
researcher is assessing the market potentials for the new juice drink product.
Plan for the primary data collection: Primary data is collected by the researcher for the
first time to specifically fulfill the purpose of research. There are various sources of primary data
collection such as survey, observation etc. which researcher can use to meet their research
purpose. For the collection of primary data, researcher will focus on undertaking survey
methodology to collect wide range of valuable and realistic data regarding the same. Survey is
the best technique which provides assistance to the researcher in assessing consumer preference
and attitude towards the new juice drink (Zsambok and Klein, 2014). Researcher prepares the
questionnaire which contains questions regarding the customer’s attitude and buying behavior in
1
⊘ This is a preview!⊘
Do you want full access?
Subscribe today to unlock all pages.
Trusted by 1+ million students worldwide
relation to the fresh juice product. In order to carry out the survey in an effective manner,
researcher requires selecting the sample size among population upon which the research is
conducted. Once the sample size is framed thereafter, researcher prepares the questionnaire
which contains both close and open ended questions. These questions assist the researcher in
identifying consumer preference towards the fresh juice product.
Plan for the secondary data collection: Secondary data can be defined as the information
which is already gathered by some other authorities for their research. Researcher can also use
the secondary data which is highly related to their research topic. Further, different methods will
be employed in secondary research to gather wide range of data to develop suitable theoretical
base. Library is one of the best sources which provides huge amount of data to the researcher
which helps them in conducting their research study effectively. Besides this, journals and
research papers also help the researcher in finding out the solution of problem (García-Peñalvo
and Conde, 2014). Further, government also published periodical data in relation to the market
trends, consumer income, preference and buying pattern. It is also one of the effective reliable
sources of secondary data.
1.2
Survey methodology states the steps according to which researcher needs to find the
solution of problem. It prevents confusion in the mind of researcher and facilitates quick and
accurate solution of the problem. To identify the attitude, preference and buying behavior of
potential customers of ABC towards fresh juice drink product, researcher conducts survey. In
order to conduct the survey, researcher will get the e-mail id of customers. Thereafter, researcher
sends the questionnaire on the e-mail id of potential customers (Meyer and Kiymaz, 2015). It
helps the researcher in assessing the needs, wants and expectations of customers towards the
product that is introduced by ABC.
Sample is the small part of population which researcher needs to determine by taking into
consideration various sampling techniques. Moreover, it is not possible for the researcher to
conduct survey upon all potential customers of ABC. Thus, researcher needs to select the sample
from the population to derive reliable results (Anderson and et.al, 2015). However, success of a
research is highly based upon the selected sample size from researcher aims to gather wide range
of information. Sample size should not be too large or too small. Sample size should be in such a
form which helps the researcher in getting accurate results of the problem. In this, researcher
2
Paraphrase This Document
Need a fresh take? Get an instant paraphrase of this document with our AI Paraphraser
undertakes purposive sampling method to find out the suitable sample upon which the research
will be conducted. Researcher selects 50 people for the survey which will help him in getting
appropriate information regarding the attitude of customers towards new juice product.
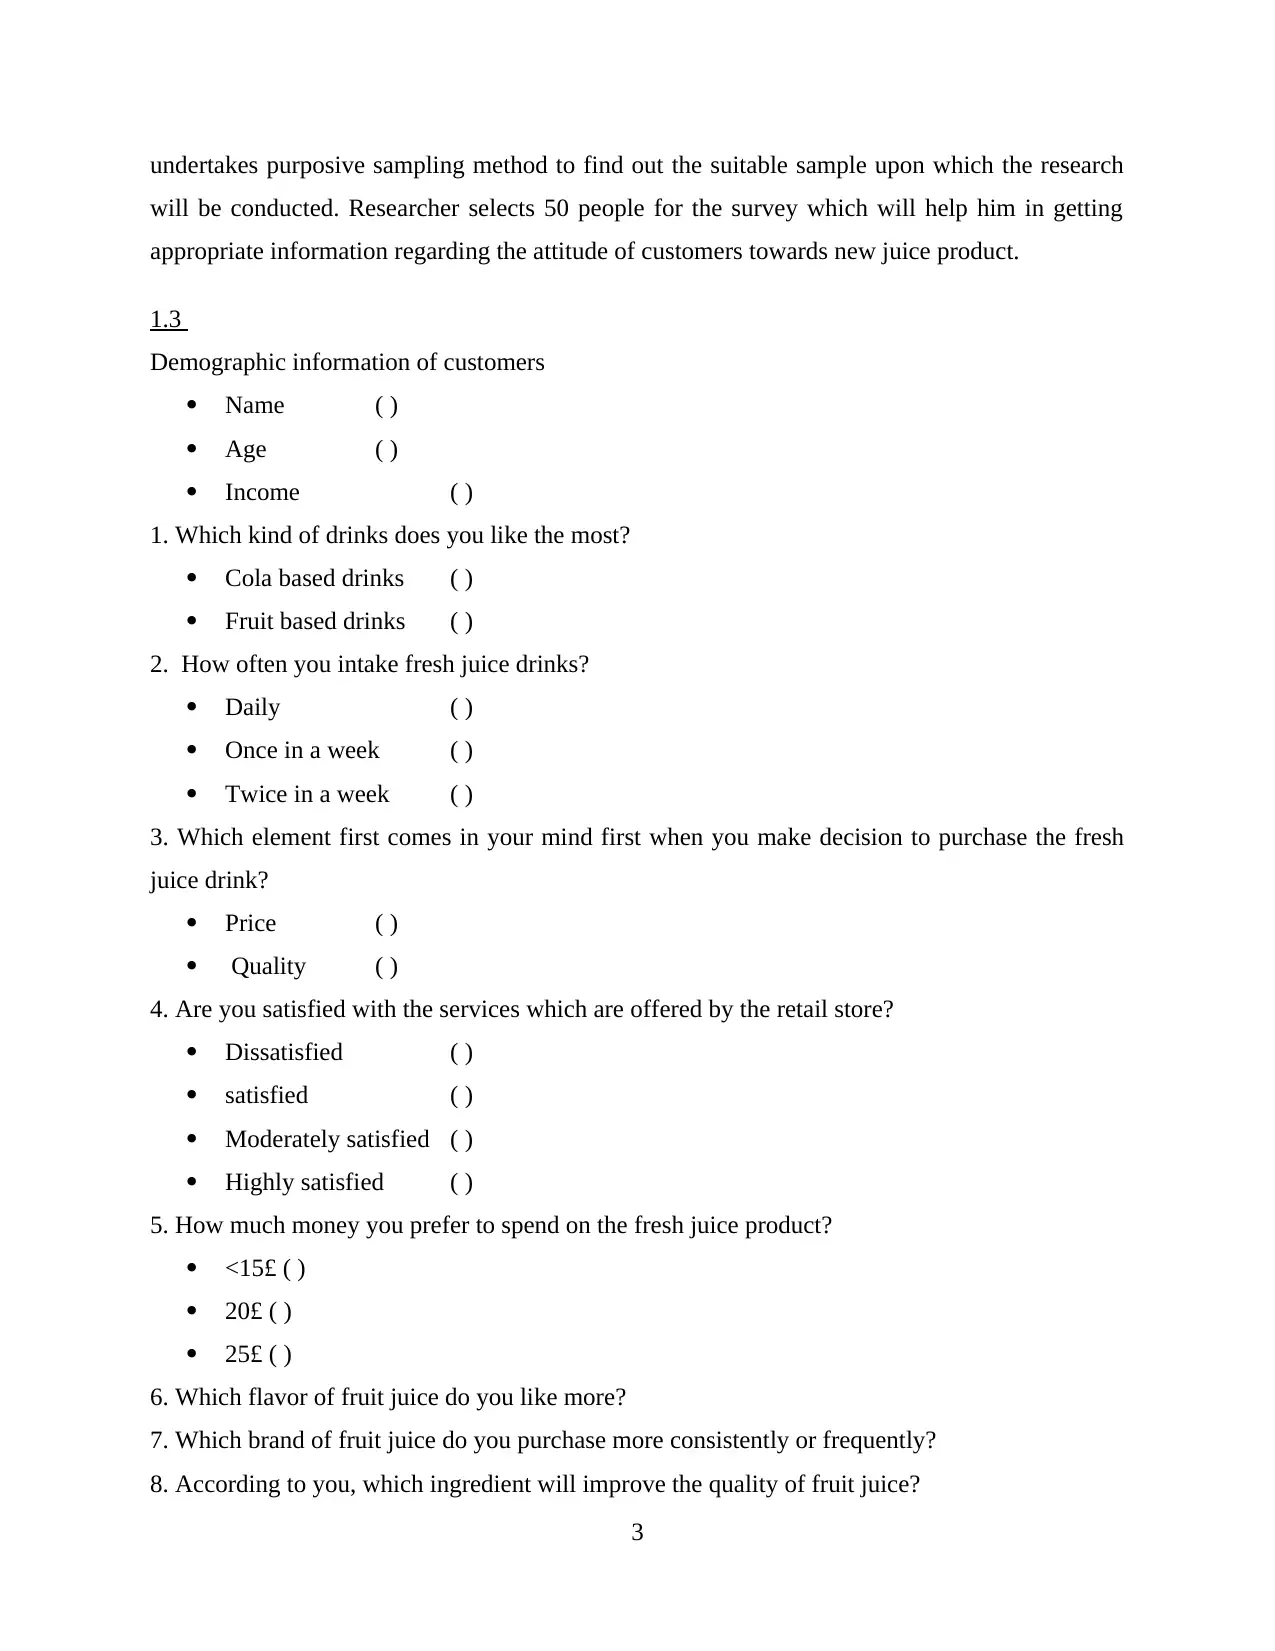
1.3
Demographic information of customers
Name ( )
Age ( )
Income ( )
1. Which kind of drinks does you like the most?
Cola based drinks ( )
Fruit based drinks ( )
2. How often you intake fresh juice drinks?
Daily ( )
Once in a week ( )
Twice in a week ( )
3. Which element first comes in your mind first when you make decision to purchase the fresh
juice drink?
Price ( )
Quality ( )
4. Are you satisfied with the services which are offered by the retail store?
Dissatisfied ( )
satisfied ( )
Moderately satisfied ( )
Highly satisfied ( )
5. How much money you prefer to spend on the fresh juice product?
<15£ ( )
20£ ( )
25£ ( )
6. Which flavor of fruit juice do you like more?
7. Which brand of fruit juice do you purchase more consistently or frequently?
8. According to you, which ingredient will improve the quality of fruit juice?
3
will be conducted. Researcher selects 50 people for the survey which will help him in getting
appropriate information regarding the attitude of customers towards new juice product.
1.3
Demographic information of customers
Name ( )
Age ( )
Income ( )
1. Which kind of drinks does you like the most?
Cola based drinks ( )
Fruit based drinks ( )
2. How often you intake fresh juice drinks?
Daily ( )
Once in a week ( )
Twice in a week ( )
3. Which element first comes in your mind first when you make decision to purchase the fresh
juice drink?
Price ( )
Quality ( )
4. Are you satisfied with the services which are offered by the retail store?
Dissatisfied ( )
satisfied ( )
Moderately satisfied ( )
Highly satisfied ( )
5. How much money you prefer to spend on the fresh juice product?
<15£ ( )
20£ ( )
25£ ( )
6. Which flavor of fruit juice do you like more?
7. Which brand of fruit juice do you purchase more consistently or frequently?
8. According to you, which ingredient will improve the quality of fruit juice?
3
TASK 2
2.1
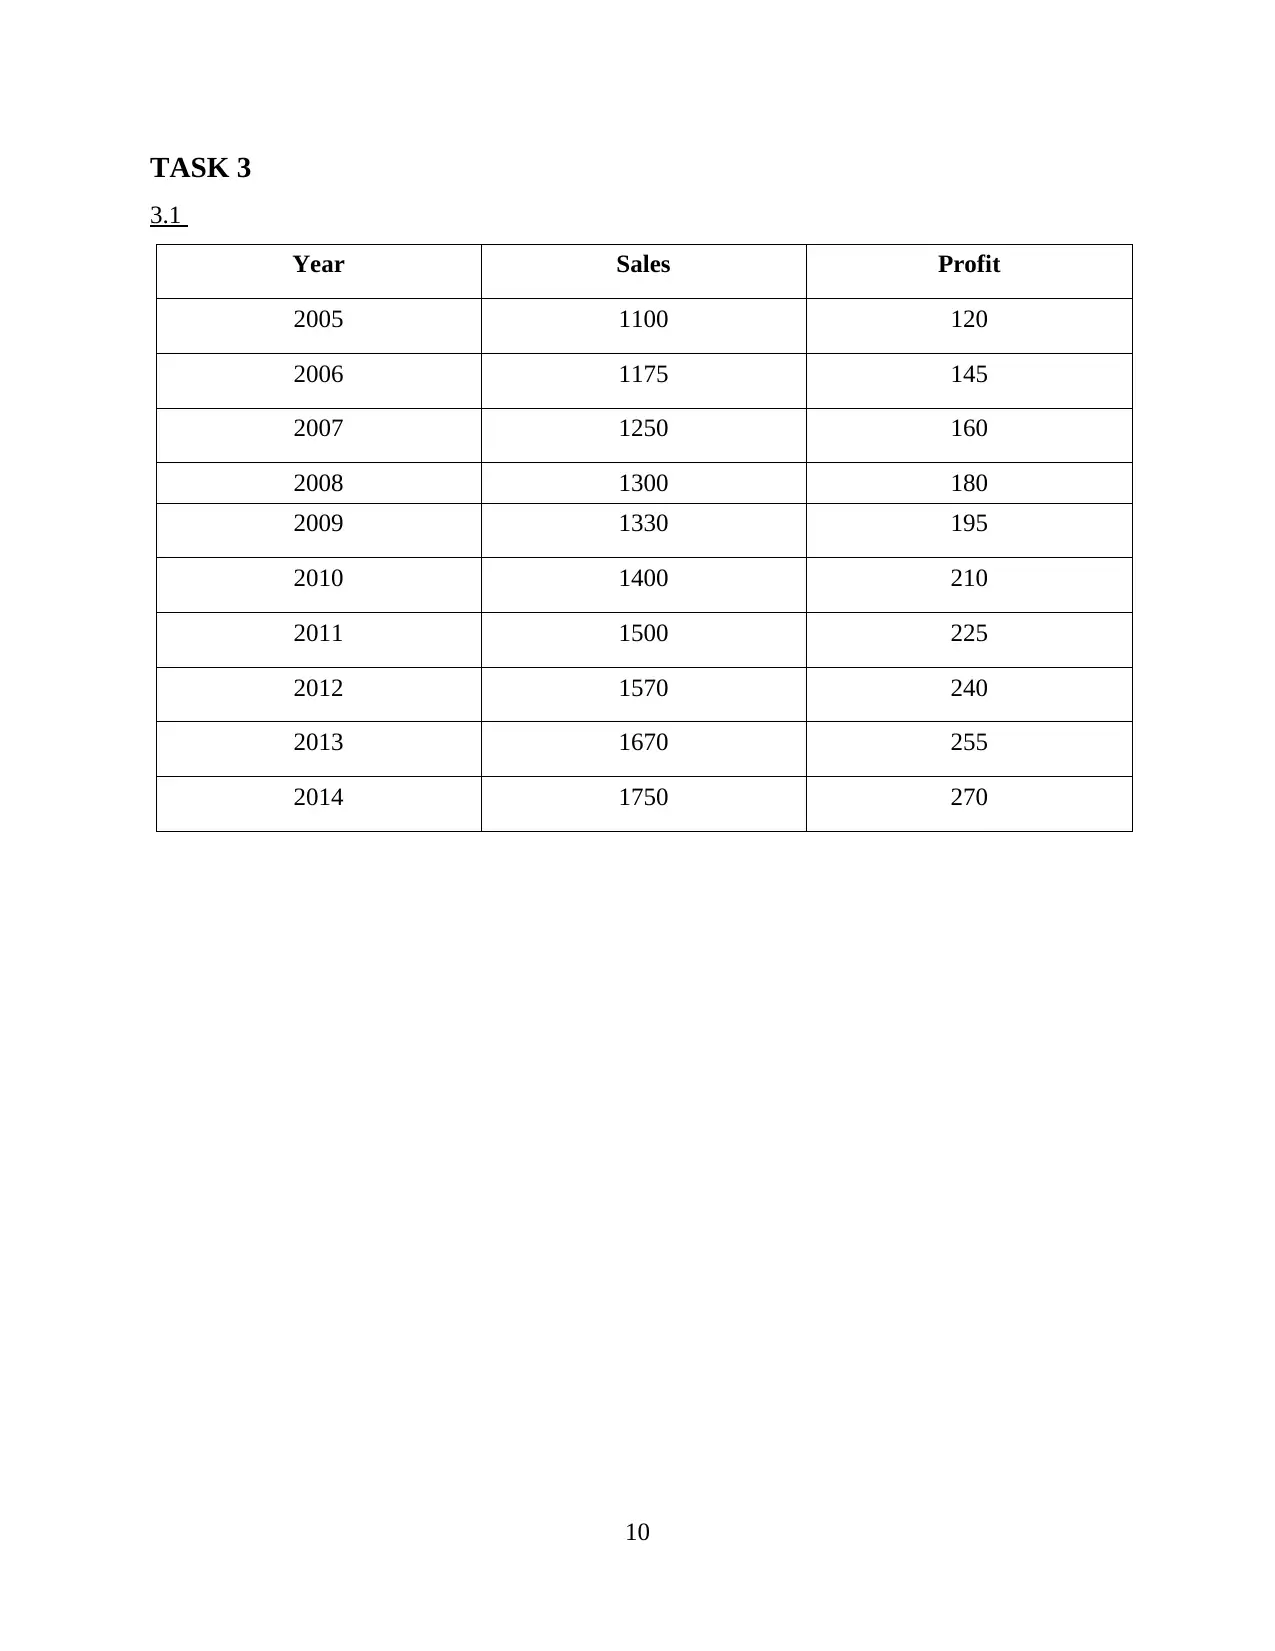
Summarization of the profit and sales data of ABC are as follows:
Year Sales Profit
2005 1100 120
2006 1175 145
2007 1250 160
2008 1300 180
2009 1330 195
2010 1400 210
2011 1500 225
2012 1570 240
2013 1670 255
2014 1750 270
Descriptive analysis of sales:
Sales
Mean 1404.5
Standard error 66.67
Median 1365
Researcher makes use of descriptive statistics to analyze the secondary data which aid in
the decision making aspect of an organization. Above mentioned table shows that average or
mean sales of ABC are 1404.5. In contrary to this, sales of ABC which they generated in the
middle of the ten years are 1365. On the basis of this aspect, it has been assessed that there is the
difference between the average and middle sales of an organization. Thus, ABC needs to frame
competent strategies and policies to maximize their sales and profit.
Descriptive analysis of profit:
4
2.1
Summarization of the profit and sales data of ABC are as follows:
Year Sales Profit
2005 1100 120
2006 1175 145
2007 1250 160
2008 1300 180
2009 1330 195
2010 1400 210
2011 1500 225
2012 1570 240
2013 1670 255
2014 1750 270
Descriptive analysis of sales:
Sales
Mean 1404.5
Standard error 66.67
Median 1365
Researcher makes use of descriptive statistics to analyze the secondary data which aid in
the decision making aspect of an organization. Above mentioned table shows that average or
mean sales of ABC are 1404.5. In contrary to this, sales of ABC which they generated in the
middle of the ten years are 1365. On the basis of this aspect, it has been assessed that there is the
difference between the average and middle sales of an organization. Thus, ABC needs to frame
competent strategies and policies to maximize their sales and profit.
Descriptive analysis of profit:
4
⊘ This is a preview!⊘
Do you want full access?
Subscribe today to unlock all pages.
Trusted by 1+ million students worldwide
Profit
Mean 200
Standard error 15.53
Median 202.5
Descriptive analysis of profit represents that average profit which organization have
earned during the ten years are 200. On other hand; revenue which ABC have generated in the
middle of the ten years is 202.5. Average and median profit of ABC is very close which
represents that company have adopted the similar strategies and policies in every year.
2.2
Analysis of the results of the primary data is as follows:
Which kind of drink does you like most?
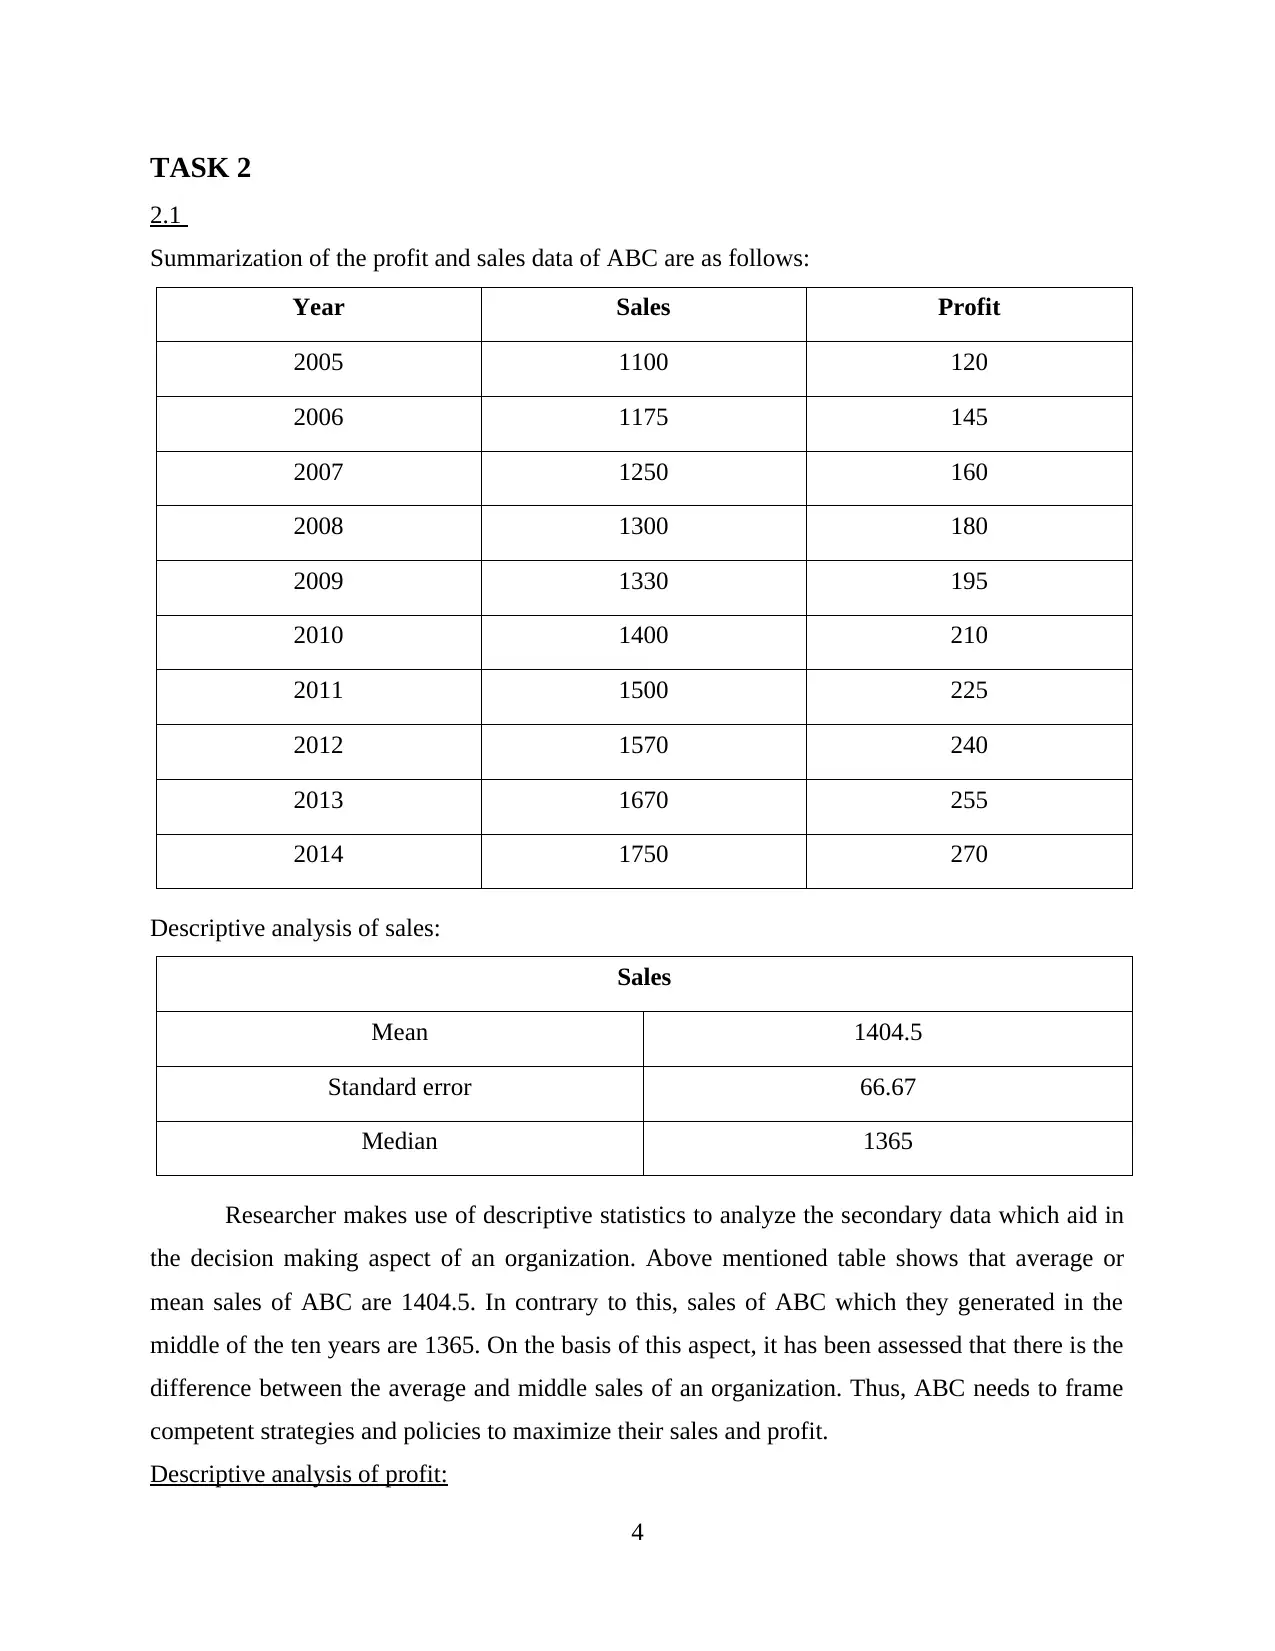
Responses No. of respondents % of respondents
Cola based drinks 20 40
Fruit based drinks 30 60
Total 50 100
On the basis of the above mentioned figures it has been stated that 60% customers prefers
fruit drinks where as 40% prefers cola based drinks. Thus, market for the fruit based drinks
entails opportunity in front of ABC to increase their productivity and profitability aspects.
5
Mean 200
Standard error 15.53
Median 202.5
Descriptive analysis of profit represents that average profit which organization have
earned during the ten years are 200. On other hand; revenue which ABC have generated in the
middle of the ten years is 202.5. Average and median profit of ABC is very close which
represents that company have adopted the similar strategies and policies in every year.
2.2
Analysis of the results of the primary data is as follows:
Which kind of drink does you like most?
Responses No. of respondents % of respondents
Cola based drinks 20 40
Fruit based drinks 30 60
Total 50 100
On the basis of the above mentioned figures it has been stated that 60% customers prefers
fruit drinks where as 40% prefers cola based drinks. Thus, market for the fruit based drinks
entails opportunity in front of ABC to increase their productivity and profitability aspects.
5
Paraphrase This Document
Need a fresh take? Get an instant paraphrase of this document with our AI Paraphraser
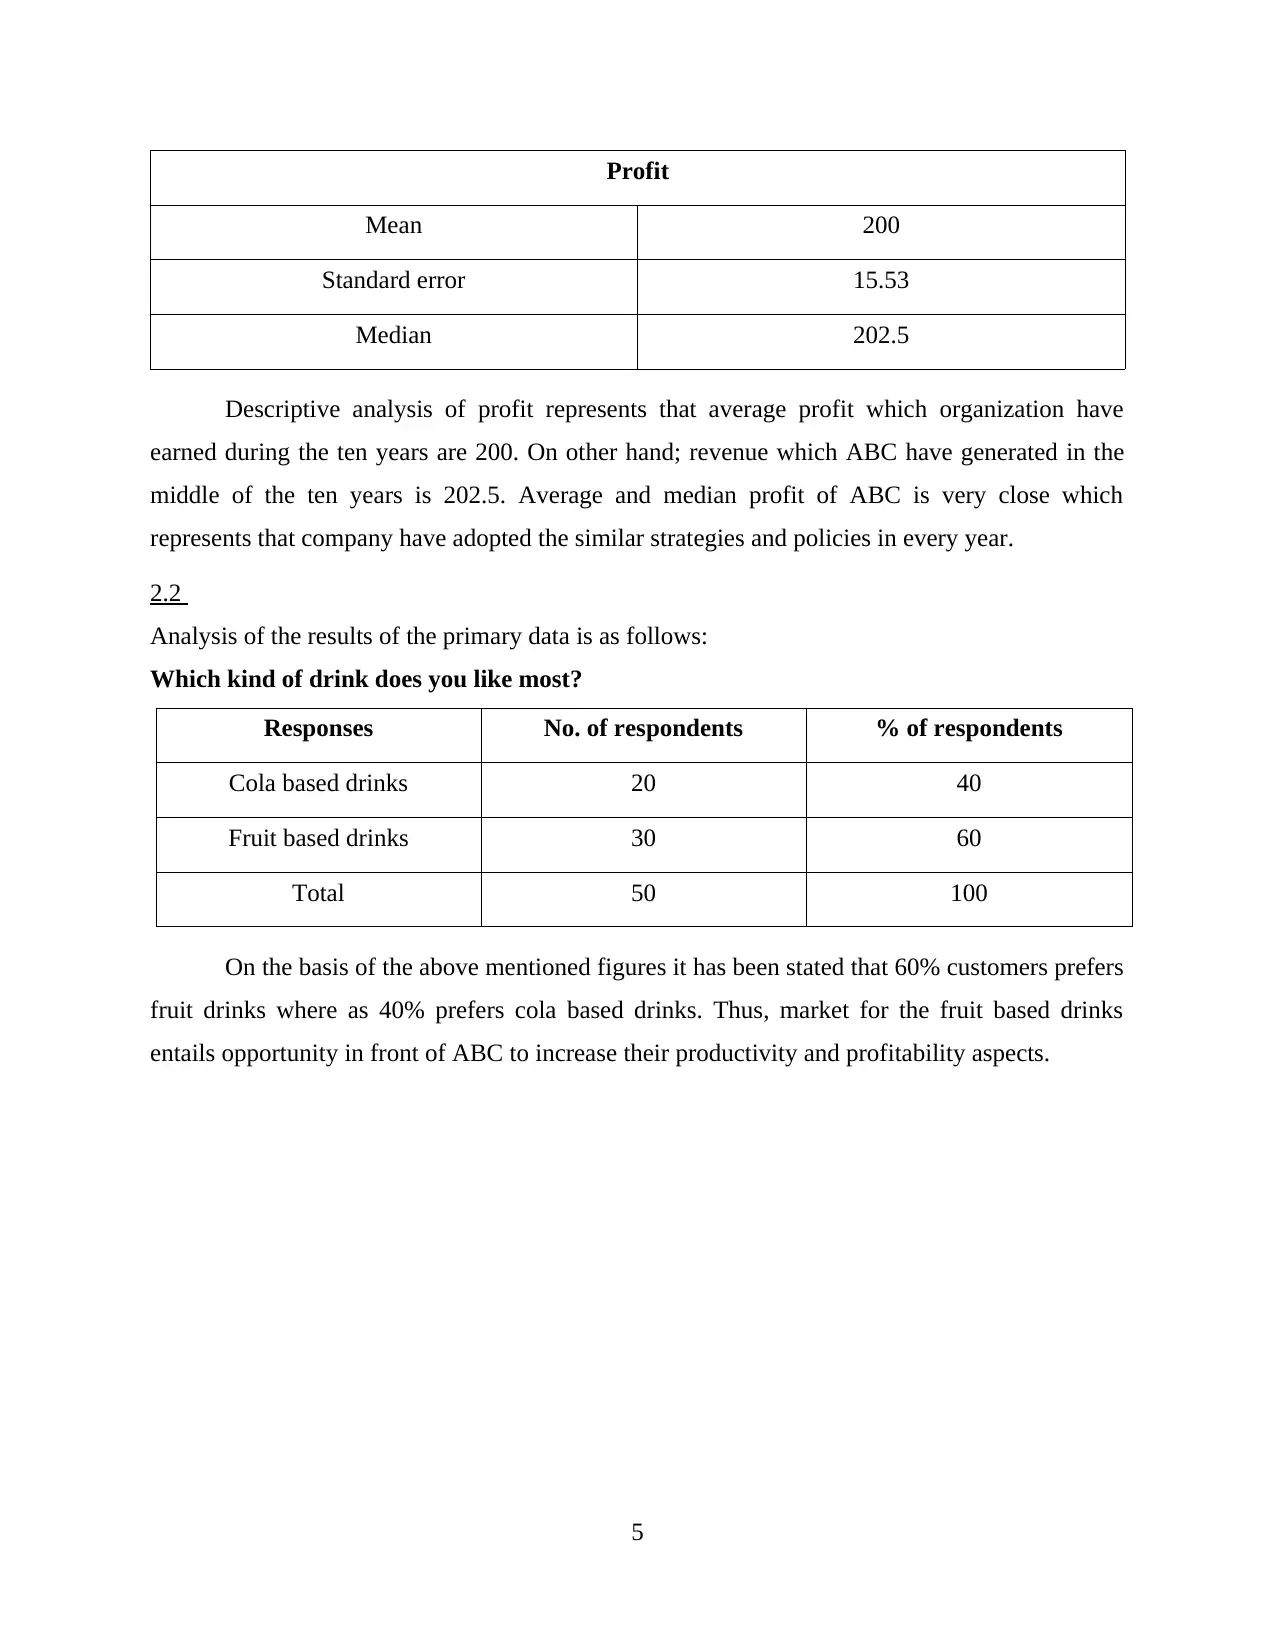
Which element attracts come in your mind first when you purchase the fresh juice drink?
Responses No. of respondents % of respondents
Price 15 30
Quality 35 70
Total 50 100
As per the above table it has been assessed that 70% people gives more priority to the
quality feature of the juice product as compared to the prices charged for them. In contrary to
6
Cola based drinks Fruit based drinks Total
0
20
40
60
80
100
120
% of respondents
Price Quality Total
0
20
40
60
80
100
120
% of respondents
this, rest 30% people places more emphasis upon the price while making decision regarding the
purchasing of product.
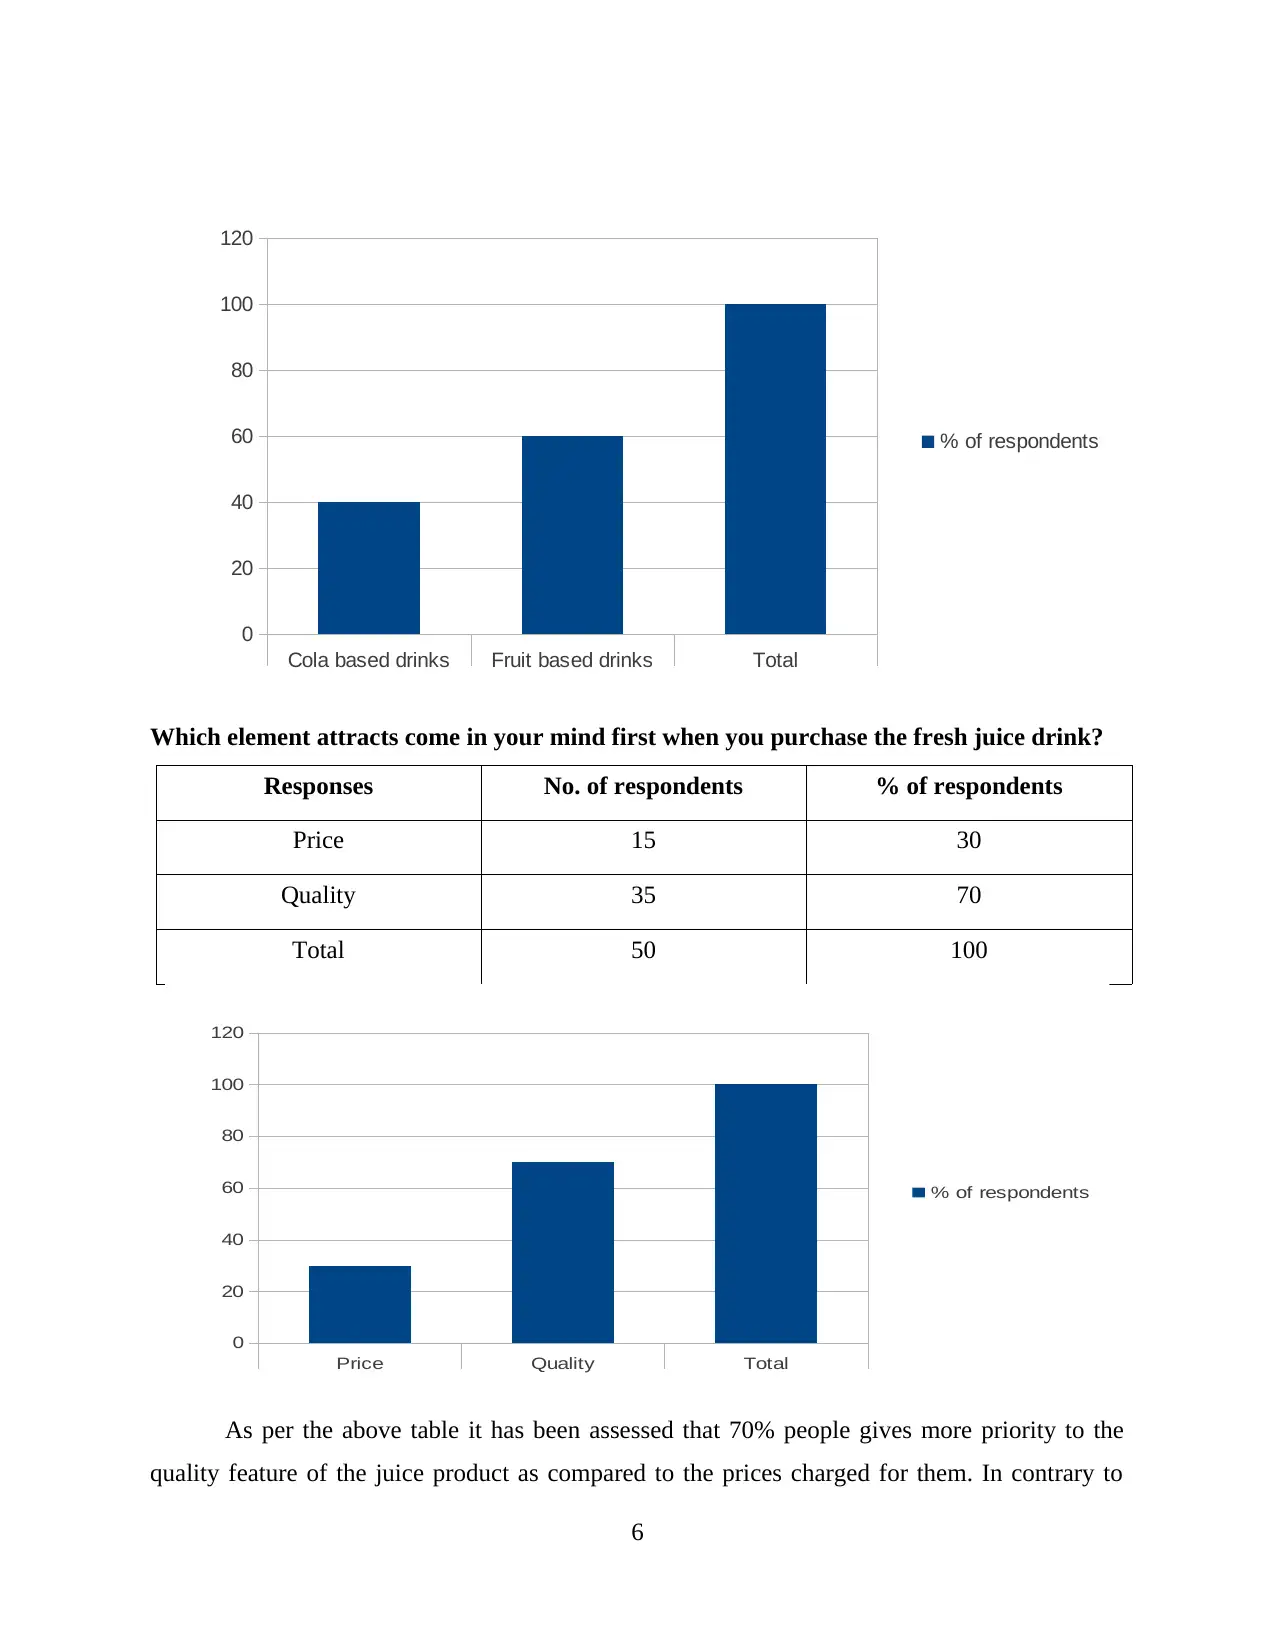
Do you satisfied with the services of the retail store?
Responses No. of respondents % of respondents
Dissatisfied 4 8
Satisfied 8 16
Moderately satisfied 13 26
Highly satisfied 25 50
Total 50 100
Above mentioned table clearly states that 50% people are highly satisfied with the
services of ABC. It represents the loyalty of the customers towards the products and services
offered by an organization. Only 8% people are dissatisfied with the services of ABC. On other
hand, 26% people are moderately satisfied with the services delivered by an organization. On the
basis of this aspect, satisfaction level of the customer is high which proves to be more fruitful for
an organization (Serreze and Stroeve, 2015).
2.3
Measure of dispersion is a statistical tool which helps ABC in assessing the extent to
which sales and profit is squeezed. It enables organization to make effective decisions and
policies which assist it in reducing the various occurs in the performance (Götze, Northcott and
7
Dissatisfied SatisfiedModerately satisfiedHighly satisfied Total
0
20
40
60
80
100
120
% of respondents
purchasing of product.
Do you satisfied with the services of the retail store?
Responses No. of respondents % of respondents
Dissatisfied 4 8
Satisfied 8 16
Moderately satisfied 13 26
Highly satisfied 25 50
Total 50 100
Above mentioned table clearly states that 50% people are highly satisfied with the
services of ABC. It represents the loyalty of the customers towards the products and services
offered by an organization. Only 8% people are dissatisfied with the services of ABC. On other
hand, 26% people are moderately satisfied with the services delivered by an organization. On the
basis of this aspect, satisfaction level of the customer is high which proves to be more fruitful for
an organization (Serreze and Stroeve, 2015).
2.3
Measure of dispersion is a statistical tool which helps ABC in assessing the extent to
which sales and profit is squeezed. It enables organization to make effective decisions and
policies which assist it in reducing the various occurs in the performance (Götze, Northcott and
7
Dissatisfied SatisfiedModerately satisfiedHighly satisfied Total
0
20
40
60
80
100
120
% of respondents
⊘ This is a preview!⊘
Do you want full access?
Subscribe today to unlock all pages.
Trusted by 1+ million students worldwide
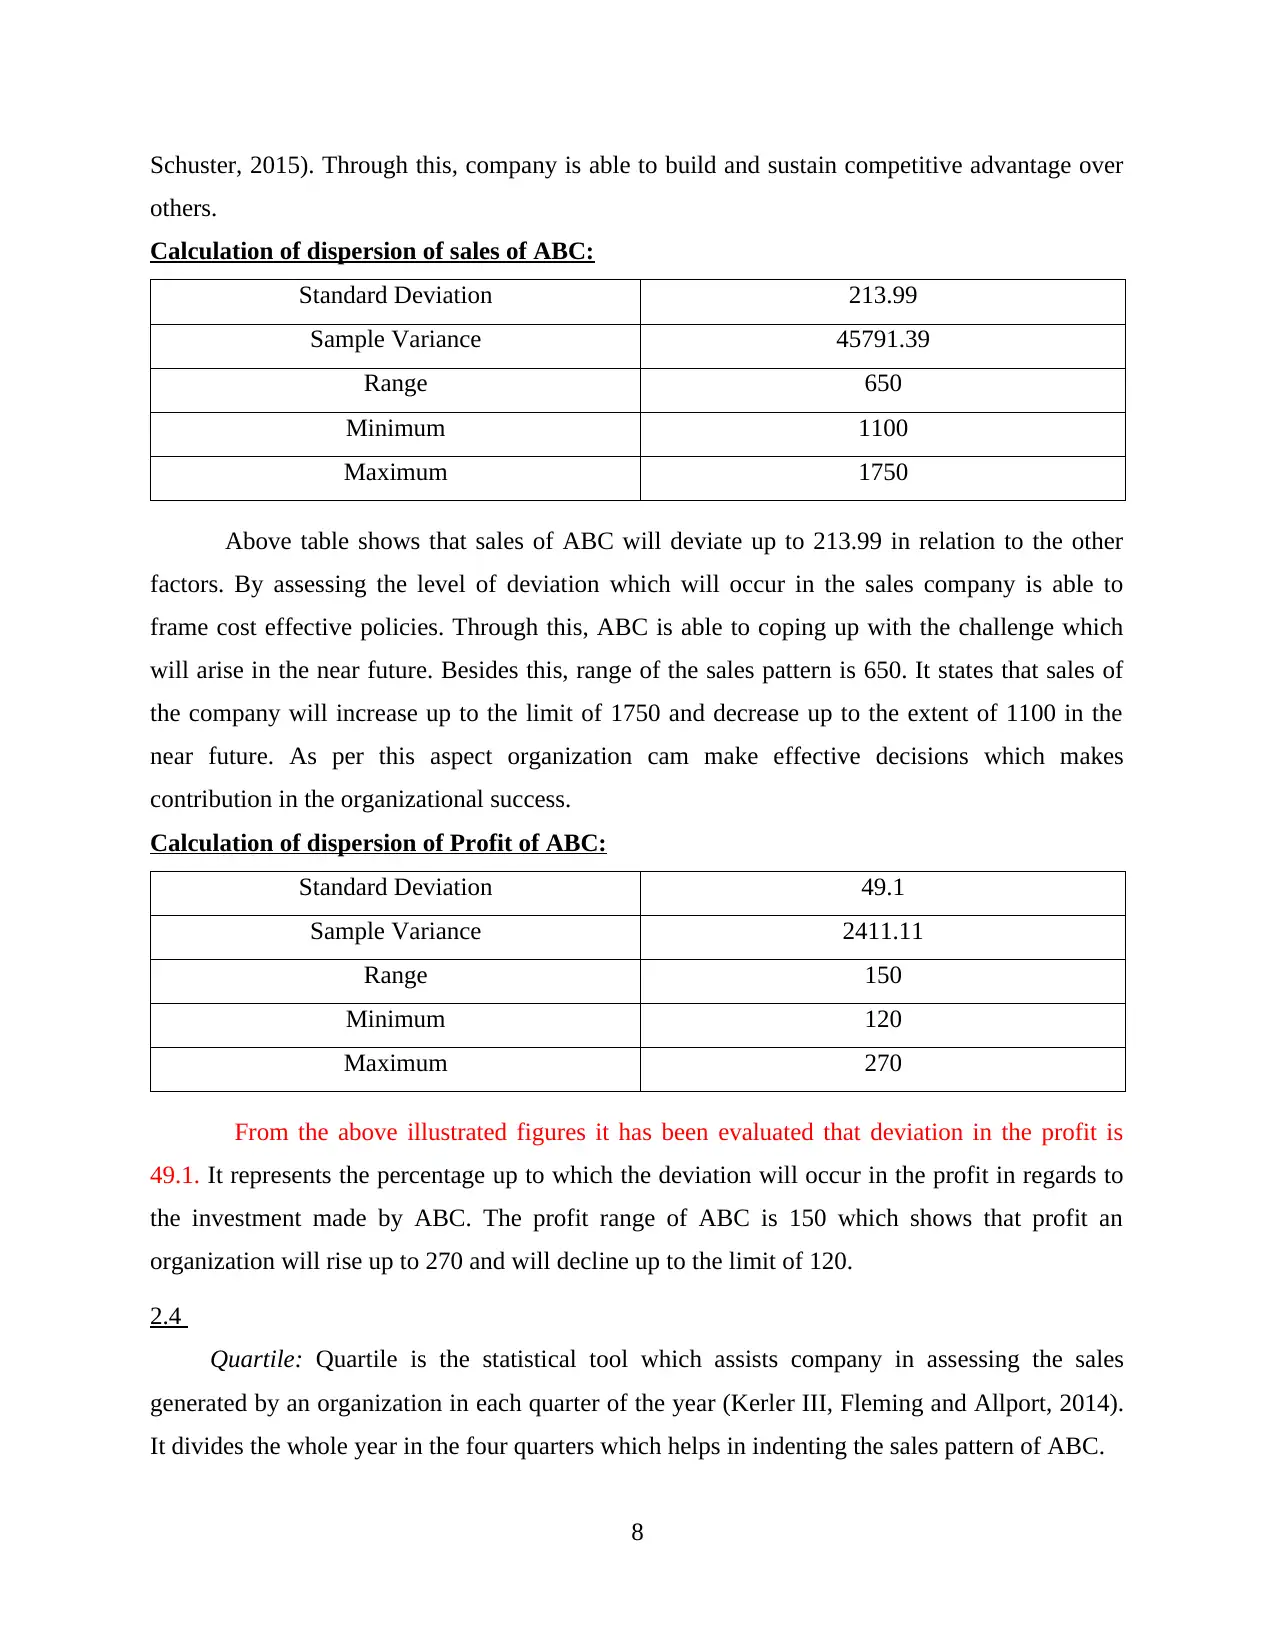
Schuster, 2015). Through this, company is able to build and sustain competitive advantage over
others.
Calculation of dispersion of sales of ABC:
Standard Deviation 213.99
Sample Variance 45791.39
Range 650
Minimum 1100
Maximum 1750
Above table shows that sales of ABC will deviate up to 213.99 in relation to the other
factors. By assessing the level of deviation which will occur in the sales company is able to
frame cost effective policies. Through this, ABC is able to coping up with the challenge which
will arise in the near future. Besides this, range of the sales pattern is 650. It states that sales of
the company will increase up to the limit of 1750 and decrease up to the extent of 1100 in the
near future. As per this aspect organization cam make effective decisions which makes
contribution in the organizational success.
Calculation of dispersion of Profit of ABC:
Standard Deviation 49.1
Sample Variance 2411.11
Range 150
Minimum 120
Maximum 270
From the above illustrated figures it has been evaluated that deviation in the profit is
49.1. It represents the percentage up to which the deviation will occur in the profit in regards to
the investment made by ABC. The profit range of ABC is 150 which shows that profit an
organization will rise up to 270 and will decline up to the limit of 120.
2.4
Quartile: Quartile is the statistical tool which assists company in assessing the sales
generated by an organization in each quarter of the year (Kerler III, Fleming and Allport, 2014).
It divides the whole year in the four quarters which helps in indenting the sales pattern of ABC.
8
Paraphrase This Document
Need a fresh take? Get an instant paraphrase of this document with our AI Paraphraser
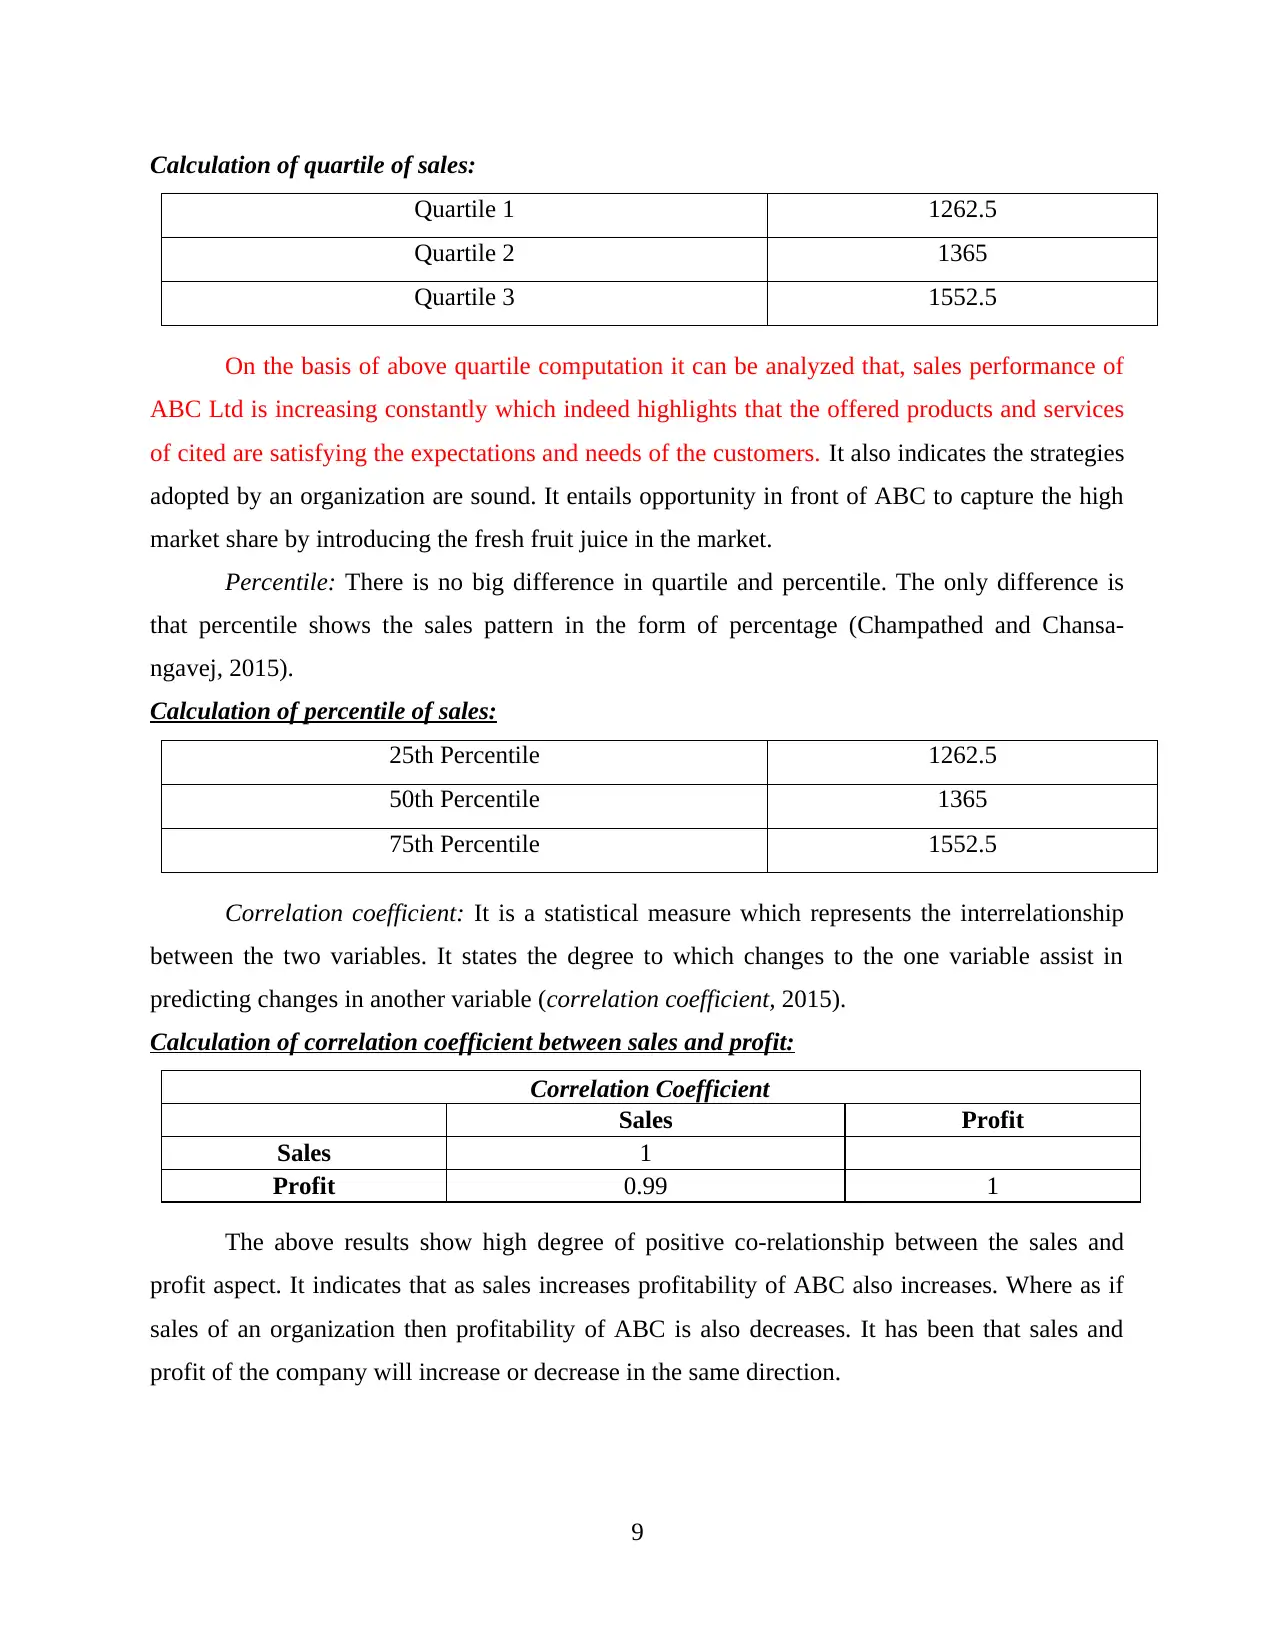
Calculation of quartile of sales:
Quartile 1 1262.5
Quartile 2 1365
Quartile 3 1552.5
On the basis of above quartile computation it can be analyzed that, sales performance of
ABC Ltd is increasing constantly which indeed highlights that the offered products and services
of cited are satisfying the expectations and needs of the customers. It also indicates the strategies
adopted by an organization are sound. It entails opportunity in front of ABC to capture the high
market share by introducing the fresh fruit juice in the market.
Percentile: There is no big difference in quartile and percentile. The only difference is
that percentile shows the sales pattern in the form of percentage (Champathed and Chansa-
ngavej, 2015).
Calculation of percentile of sales:
25th Percentile 1262.5
50th Percentile 1365
75th Percentile 1552.5
Correlation coefficient: It is a statistical measure which represents the interrelationship
between the two variables. It states the degree to which changes to the one variable assist in
predicting changes in another variable (correlation coefficient, 2015).
Calculation of correlation coefficient between sales and profit:
Correlation Coefficient
Sales Profit
Sales 1
Profit 0.99 1
The above results show high degree of positive co-relationship between the sales and
profit aspect. It indicates that as sales increases profitability of ABC also increases. Where as if
sales of an organization then profitability of ABC is also decreases. It has been that sales and
profit of the company will increase or decrease in the same direction.
9
TASK 3
3.1
Year Sales Profit
2005 1100 120
2006 1175 145
2007 1250 160
2008 1300 180
2009 1330 195
2010 1400 210
2011 1500 225
2012 1570 240
2013 1670 255
2014 1750 270
10
3.1
Year Sales Profit
2005 1100 120
2006 1175 145
2007 1250 160
2008 1300 180
2009 1330 195
2010 1400 210
2011 1500 225
2012 1570 240
2013 1670 255
2014 1750 270
10
⊘ This is a preview!⊘
Do you want full access?
Subscribe today to unlock all pages.
Trusted by 1+ million students worldwide
1 out of 22
Related Documents


Your All-in-One AI-Powered Toolkit for Academic Success.
+13062052269
info@desklib.com
Available 24*7 on WhatsApp / Email
![[object Object]](/_next/static/media/star-bottom.7253800d.svg)
Unlock your academic potential
Copyright © 2020–2026 A2Z Services. All Rights Reserved. Developed and managed by ZUCOL.