Pearson BTEC HND Business Decision Making Report: Tour Product Launch
VerifiedAdded on 2020/01/28
|22
|4296
|82
Report
AI Summary
This report focuses on business decision-making, particularly in the context of launching a new tour product by ABC Limited. It begins with an introduction to the importance of effective business decisions and then outlines the data collection process, including primary and secondary data sources like questionnaires and annual reports. The report delves into survey methodology, sampling methods, and questionnaire design. It then presents data analysis, including measures of central tendency, dispersion, quartiles, percentiles, and correlation coefficients. The analysis extends to graphical representations, trend lines, and financial tools like NPV and IRR, along with project management techniques. The report culminates in a conclusion summarizing the key findings and recommendations, supported by comprehensive references and an index of tables and illustrations.

BUSINESS DECISION
MAKING
MAKING
Paraphrase This Document
Need a fresh take? Get an instant paraphrase of this document with our AI Paraphraser
TABLE OF CONTENTS
INTRODUCTION...........................................................................................................................2
TASK 1............................................................................................................................................2
1.1 Plan in order to collect data for research..........................................................................2
1.2 Survey methodology and sampling method.....................................................................2
1.3 Design a questionnaire for research.................................................................................3
TASK 2............................................................................................................................................5
2.1 & 2.2 Data for research and its analysis in order to develop a tour product....................5
2.3 Analysis of measure of dispersion....................................................................................6
2.4 Quartiles, percentiles and correlation coefficient.............................................................7
TASK 3............................................................................................................................................9
3.1 Producing graphs and charts and its interpretation...........................................................9
3.2 Trend line in order to predict future events....................................................................12
3.3 Business presentation.....................................................................................................13
3.4 Formal business report...................................................................................................13
TASK 4..........................................................................................................................................13
4.1 Appropriate information processing tools......................................................................13
4.2 Project plan and determination of critical path for launching a new tour product.........14
4.3 Financial tools in order to assess viability of investment or project..............................16
CONCLUSION..............................................................................................................................18
REFERENCES..............................................................................................................................19
INDEX OF TABLES
Table 1: Raw data for research analysis..........................................................................................5
Table 2: Calculation of mean, median and mode............................................................................5
Table 3: Calculation of standard deviation......................................................................................6
Table 4: Calculation of quartile.......................................................................................................7
Table 5: Calculation of percentile....................................................................................................7
Table 6: Calculation of correlation..................................................................................................8
Table 7: Calculation of NPV..........................................................................................................16
Table 8: Calculation of IRR...........................................................................................................17
ILLUSTRATION INDEX
Illustration 1: Pie chart on sales.....................................................................................................10
Illustration 2: Pie chart on profit....................................................................................................10
Illustration 3: Bar chart..................................................................................................................11
Illustration 4: Line chart.................................................................................................................11
Illustration 5: Trend line................................................................................................................12
Illustration 6: Network diagram.....................................................................................................15
Illustration 7: Gantt chart...............................................................................................................15
1
⊘ This is a preview!⊘
Do you want full access?
Subscribe today to unlock all pages.
Trusted by 1+ million students worldwide
INTRODUCTION
In the business world, it is important to make effective and beneficial business decisions
in order to maximise the profits. In this context, there are different types of tools and techniques
used by researcher which are shown in the present report. In the current case, there is a tour
operator i.e. ABC Limited which is going to launch a new tour product at the national as well as
international level. For conduct the present research and analysis, both primary and secondary
data are collected and analysed for launching the product. Further, report emphasises on various
kinds of measures of central tendency and dispersion which help the scholar in doing effective
research and get reliable data. Apart from this, it shows financial data with the help of graphical
representation. Besides this, present research describes about the financial tools as well as project
management techniques such as network diagram.
TASK 1
1.1 Plan in order to collect data for research
To conduct a research, raw data is essential for the investigator which is collected from
different sources. Data is gathered with the help of primary as well as secondary sources in
which various kinds of parameters are available which help to derive better and reliable
information (Wyse, 2012). With the new product, travellers or visitors will be able to visit
various national and international destinations in an easy way. Data which is collected for the
first time by scholar is known as primary information while, data which is already gathered and
published by other investigators is known as secondary.
Furthermore, for gathering primary data, there are numerous sources available for raw
data collection like survey, interview, questionnaire, etc. On the other side, in secondary data, it
considers various sources such as publication, articles, newspapers, journals and annual report of
the firm (Mackey and Gass, 2015). In the present case, questionnaire is to be designed and
distributed among 40 people between local community of London in order to know their
preferences, attitude, behaviour of buying, etc. Further, annual report of ABC Limited is to be
used for collecting secondary data.
1.2 Survey methodology and sampling method
Survey methodology shows the tools and techniques that are used for research on a
particular topic. Here, to analyse the market in order to launch a new tour product, questionnaire
2
Paraphrase This Document
Need a fresh take? Get an instant paraphrase of this document with our AI Paraphraser
is to be framed and distributed with the help of internet and online tools such as social media.
The respective methodology provides reliable facts and figures without consuming extra time
(Neuman and Robson, 2012). Further, to derive prices of tour packages and revenue as well as
profit, annual report of ABC Limited is to be used.
Moreover, for the purpose of data analysis, sample data is required for distributing
questionnaire among people. There are different kinds of sampling methods available such as
cluster, stratified, simple random as well as convenience. In the present case, for collecting
sample data of 40 people between local communities of London, simple random sampling
method is used. According to the respective technique, the scholar derive sample data on the
basis of randomly without using any parameter.. It is a widely used method and easy for the
investigator as well.
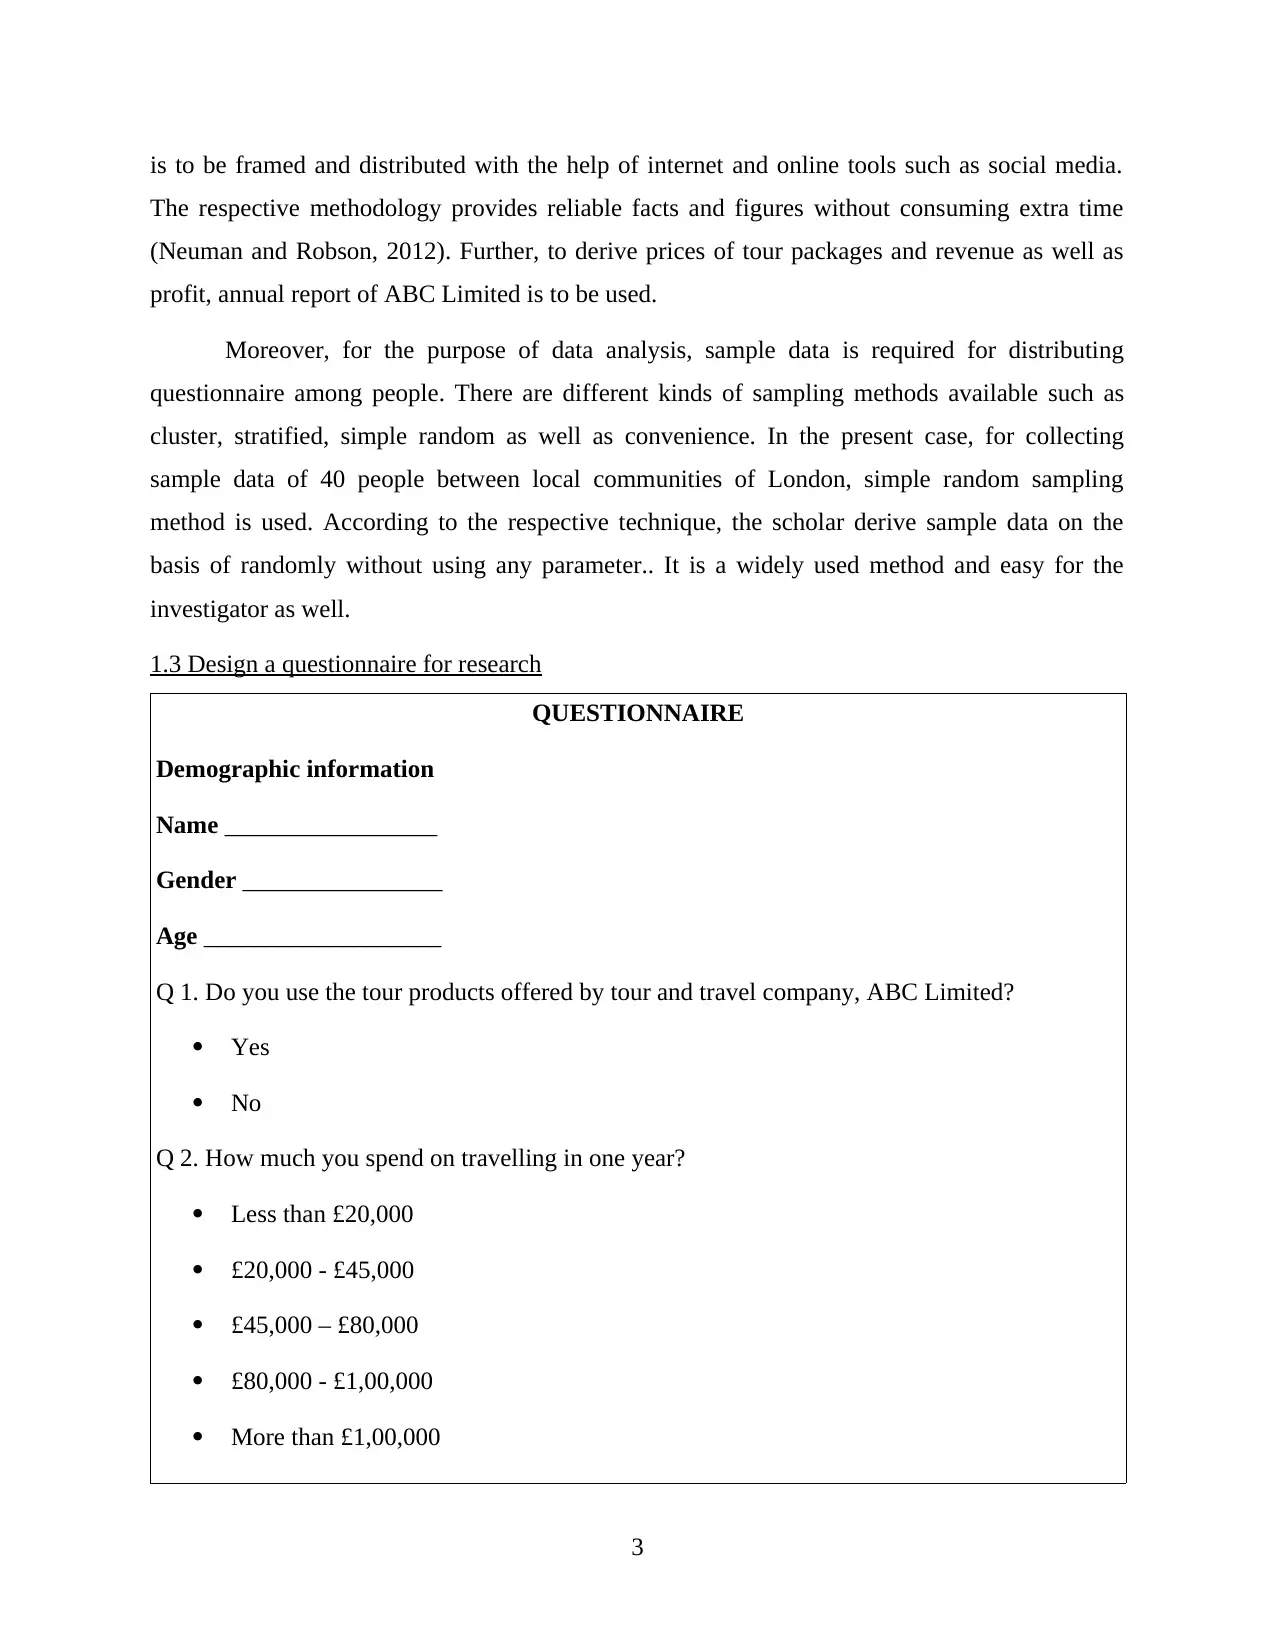
1.3 Design a questionnaire for research
QUESTIONNAIRE
Demographic information
Name _________________
Gender ________________
Age ___________________
Q 1. Do you use the tour products offered by tour and travel company, ABC Limited?
Yes
No
Q 2. How much you spend on travelling in one year?
Less than £20,000
£20,000 - £45,000
£45,000 – £80,000
£80,000 - £1,00,000
More than £1,00,000
3
The respective methodology provides reliable facts and figures without consuming extra time
(Neuman and Robson, 2012). Further, to derive prices of tour packages and revenue as well as
profit, annual report of ABC Limited is to be used.
Moreover, for the purpose of data analysis, sample data is required for distributing
questionnaire among people. There are different kinds of sampling methods available such as
cluster, stratified, simple random as well as convenience. In the present case, for collecting
sample data of 40 people between local communities of London, simple random sampling
method is used. According to the respective technique, the scholar derive sample data on the
basis of randomly without using any parameter.. It is a widely used method and easy for the
investigator as well.
1.3 Design a questionnaire for research
QUESTIONNAIRE
Demographic information
Name _________________
Gender ________________
Age ___________________
Q 1. Do you use the tour products offered by tour and travel company, ABC Limited?
Yes
No
Q 2. How much you spend on travelling in one year?
Less than £20,000
£20,000 - £45,000
£45,000 – £80,000
£80,000 - £1,00,000
More than £1,00,000
3
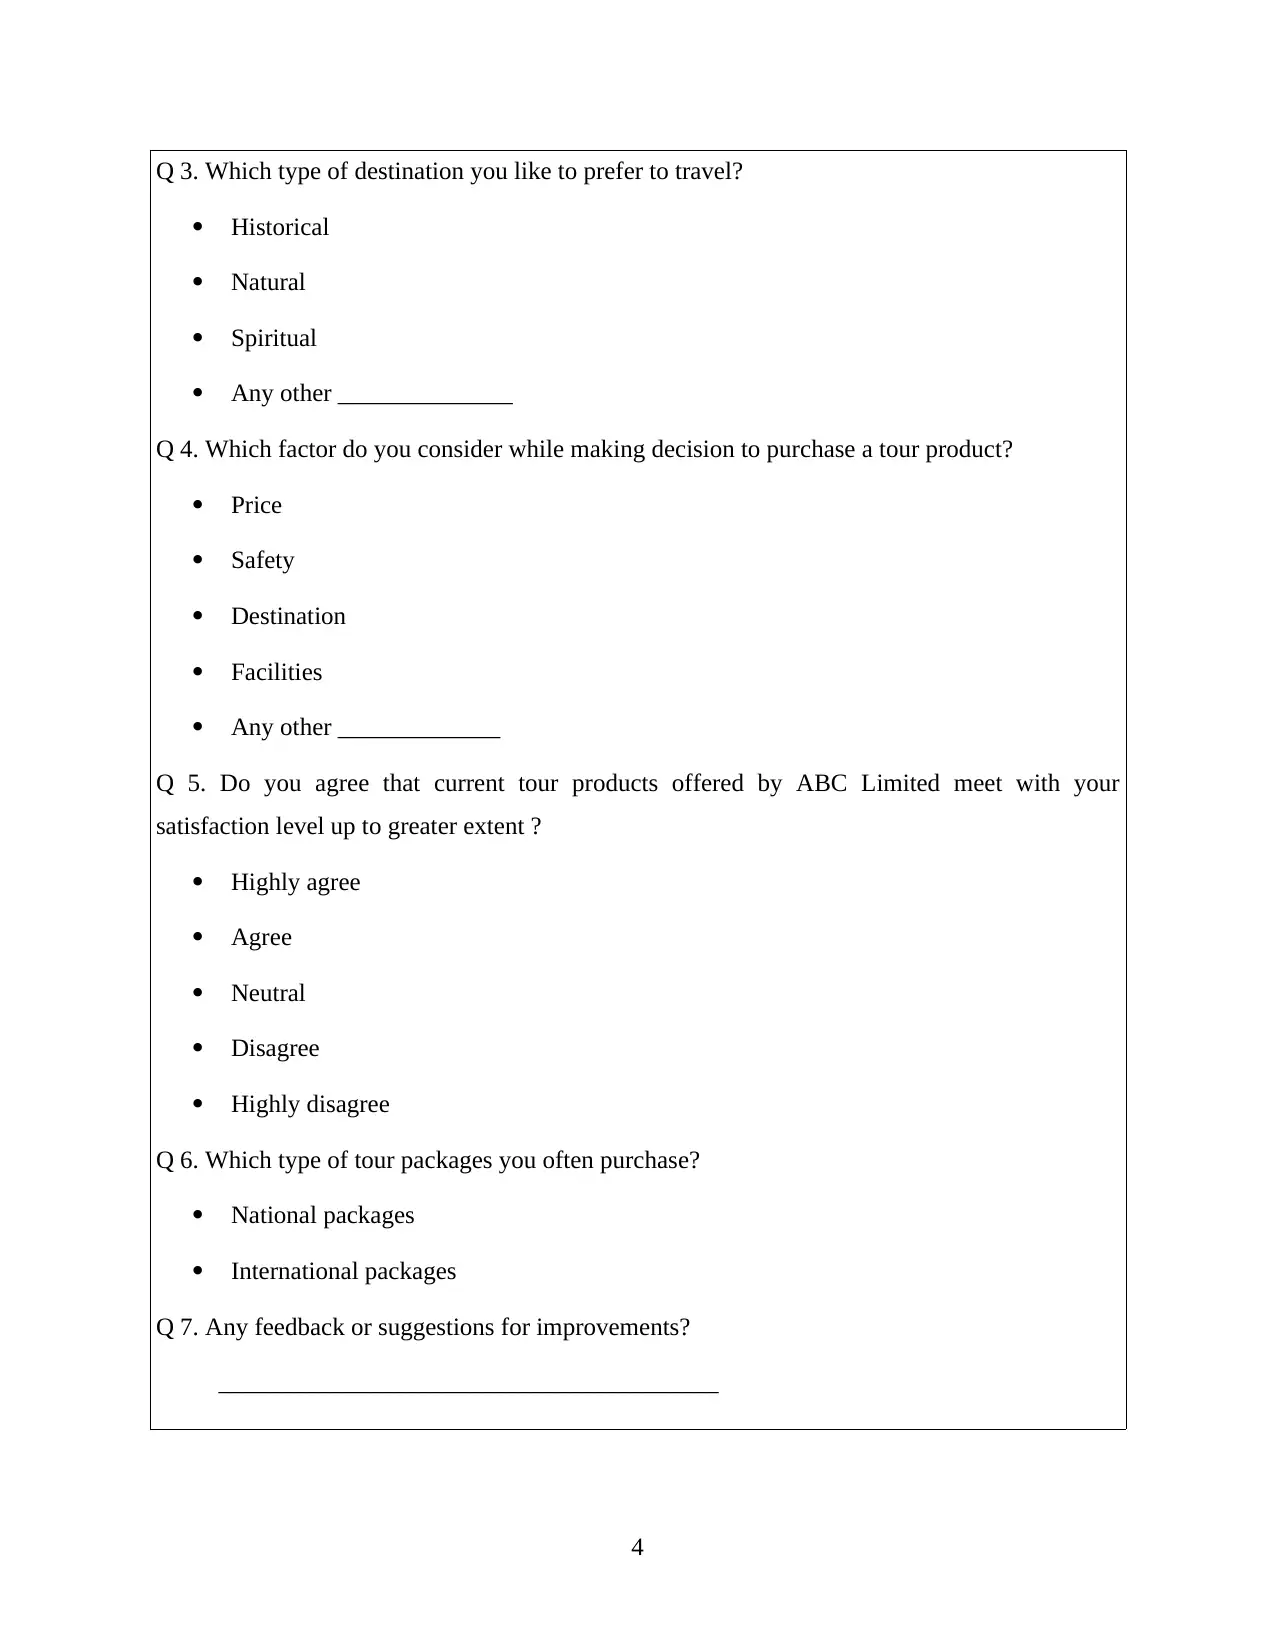
Q 3. Which type of destination you like to prefer to travel?
Historical
Natural
Spiritual
Any other ______________
Q 4. Which factor do you consider while making decision to purchase a tour product?
Price
Safety
Destination
Facilities
Any other _____________
Q 5. Do you agree that current tour products offered by ABC Limited meet with your
satisfaction level up to greater extent ?
Highly agree
Agree
Neutral
Disagree
Highly disagree
Q 6. Which type of tour packages you often purchase?
National packages
International packages
Q 7. Any feedback or suggestions for improvements?
________________________________________
4
⊘ This is a preview!⊘
Do you want full access?
Subscribe today to unlock all pages.
Trusted by 1+ million students worldwide
TASK 2
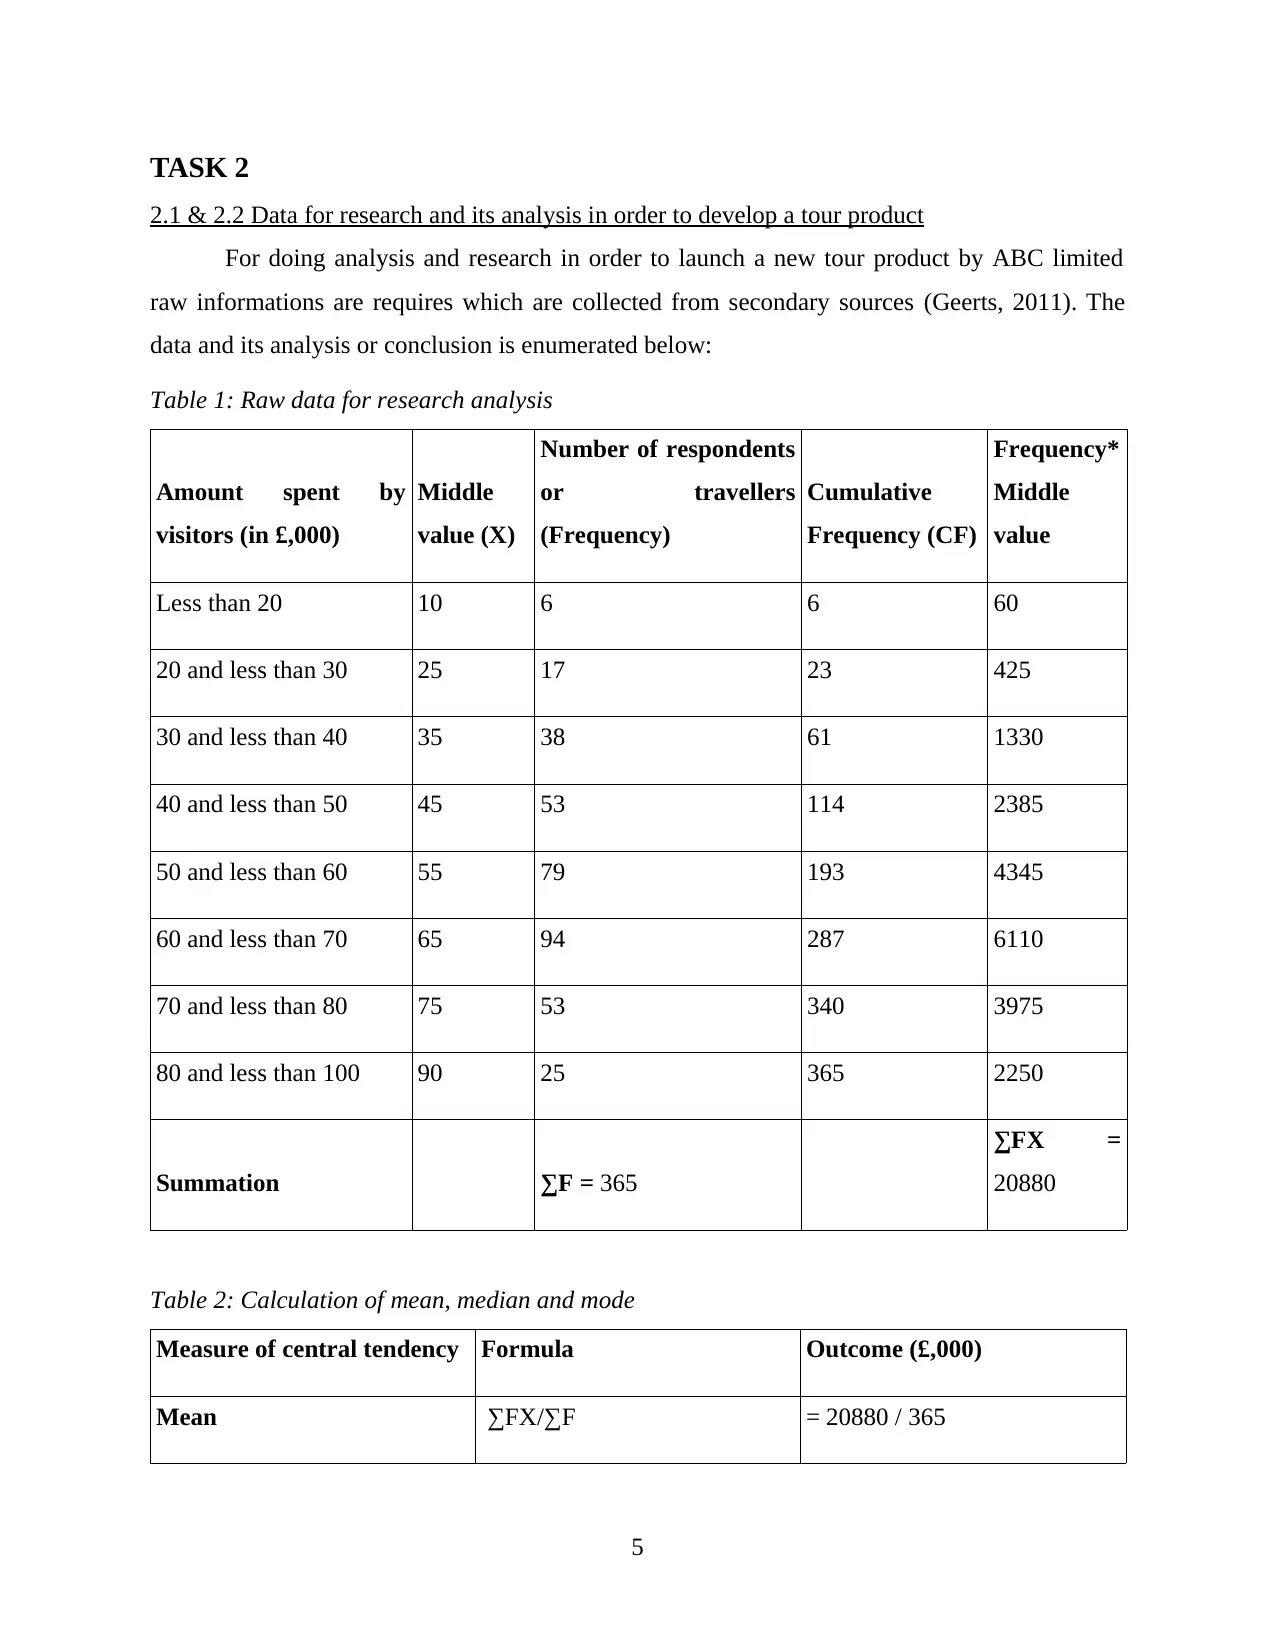
2.1 & 2.2 Data for research and its analysis in order to develop a tour product
For doing analysis and research in order to launch a new tour product by ABC limited
raw informations are requires which are collected from secondary sources (Geerts, 2011). The
data and its analysis or conclusion is enumerated below:
Table 1: Raw data for research analysis
Amount spent by
visitors (in £,000)
Middle
value (X)
Number of respondents
or travellers
(Frequency)
Cumulative
Frequency (CF)
Frequency*
Middle
value
Less than 20 10 6 6 60
20 and less than 30 25 17 23 425
30 and less than 40 35 38 61 1330
40 and less than 50 45 53 114 2385
50 and less than 60 55 79 193 4345
60 and less than 70 65 94 287 6110
70 and less than 80 75 53 340 3975
80 and less than 100 90 25 365 2250
Summation ∑F = 365
∑FX =
20880
Table 2: Calculation of mean, median and mode
Measure of central tendency Formula Outcome (£,000)
Mean ∑FX/∑F = 20880 / 365
5
Paraphrase This Document
Need a fresh take? Get an instant paraphrase of this document with our AI Paraphraser
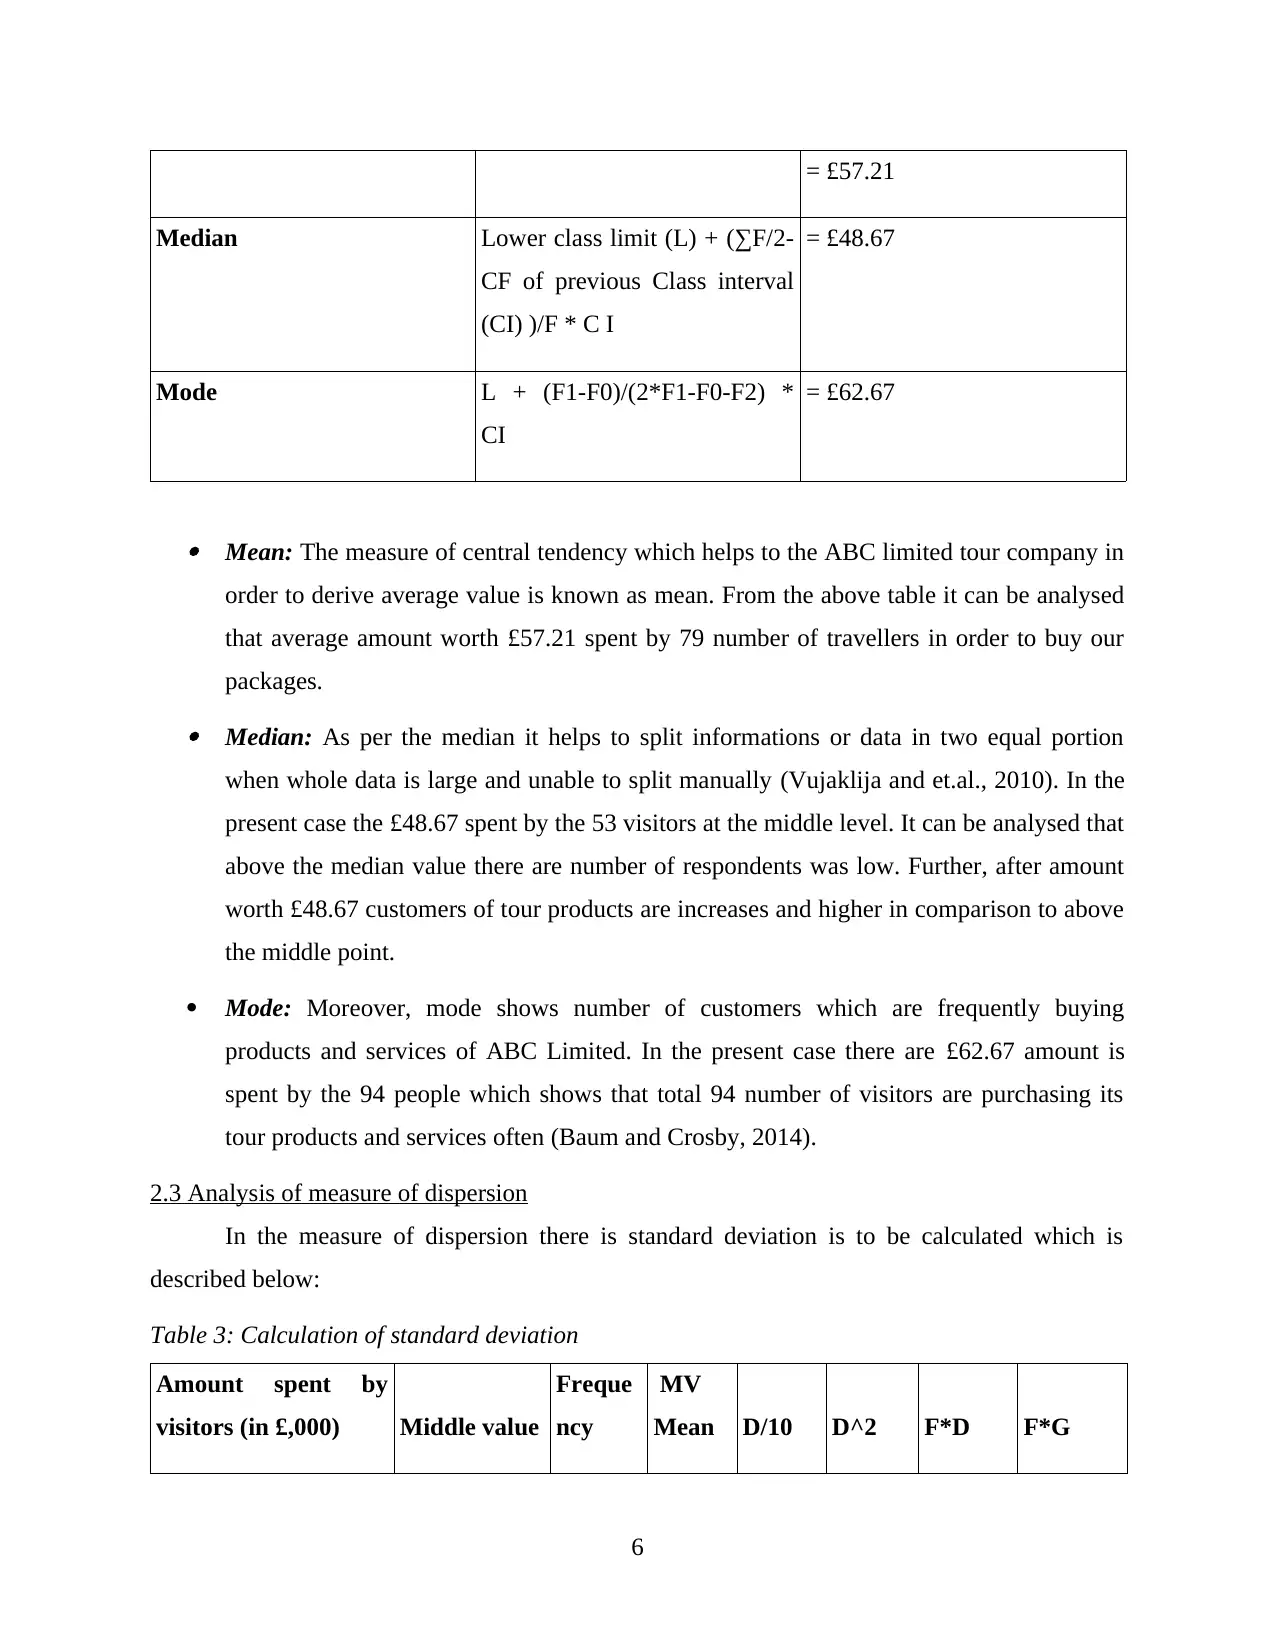
= £57.21
Median Lower class limit (L) + (∑F/2-
CF of previous Class interval
(CI) )/F * C I
= £48.67
Mode L + (F1-F0)/(2*F1-F0-F2) *
CI
= £62.67
Mean: The measure of central tendency which helps to the ABC limited tour company in
order to derive average value is known as mean. From the above table it can be analysed
that average amount worth £57.21 spent by 79 number of travellers in order to buy our
packages. Median: As per the median it helps to split informations or data in two equal portion
when whole data is large and unable to split manually (Vujaklija and et.al., 2010). In the
present case the £48.67 spent by the 53 visitors at the middle level. It can be analysed that
above the median value there are number of respondents was low. Further, after amount
worth £48.67 customers of tour products are increases and higher in comparison to above
the middle point.
Mode: Moreover, mode shows number of customers which are frequently buying
products and services of ABC Limited. In the present case there are £62.67 amount is
spent by the 94 people which shows that total 94 number of visitors are purchasing its
tour products and services often (Baum and Crosby, 2014).
2.3 Analysis of measure of dispersion
In the measure of dispersion there is standard deviation is to be calculated which is
described below:
Table 3: Calculation of standard deviation
Amount spent by
visitors (in £,000) Middle value
Freque
ncy
MV
Mean D/10 D^2 F*D F*G
6
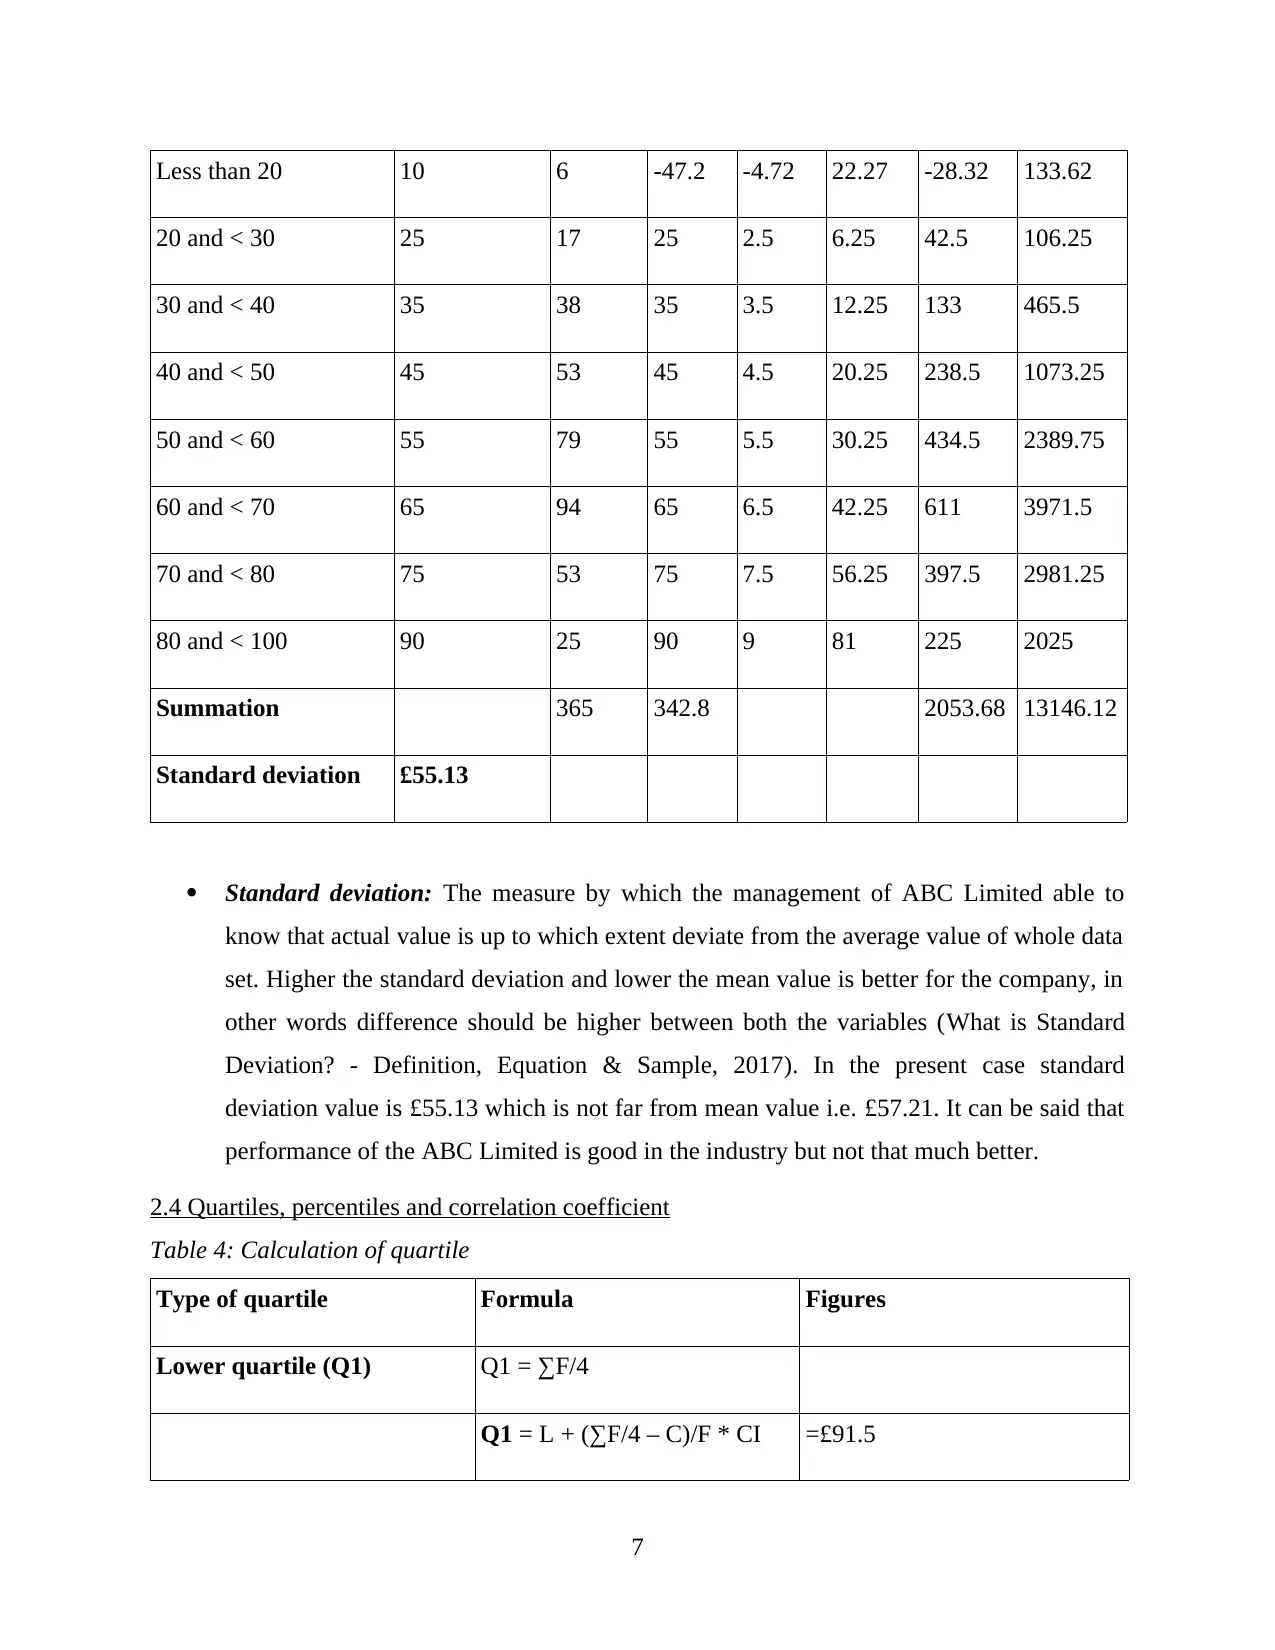
Less than 20 10 6 -47.2 -4.72 22.27 -28.32 133.62
20 and < 30 25 17 25 2.5 6.25 42.5 106.25
30 and < 40 35 38 35 3.5 12.25 133 465.5
40 and < 50 45 53 45 4.5 20.25 238.5 1073.25
50 and < 60 55 79 55 5.5 30.25 434.5 2389.75
60 and < 70 65 94 65 6.5 42.25 611 3971.5
70 and < 80 75 53 75 7.5 56.25 397.5 2981.25
80 and < 100 90 25 90 9 81 225 2025
Summation 365 342.8 2053.68 13146.12
Standard deviation £55.13
Standard deviation: The measure by which the management of ABC Limited able to
know that actual value is up to which extent deviate from the average value of whole data
set. Higher the standard deviation and lower the mean value is better for the company, in
other words difference should be higher between both the variables (What is Standard
Deviation? - Definition, Equation & Sample, 2017). In the present case standard
deviation value is £55.13 which is not far from mean value i.e. £57.21. It can be said that
performance of the ABC Limited is good in the industry but not that much better.
2.4 Quartiles, percentiles and correlation coefficient
Table 4: Calculation of quartile
Type of quartile Formula Figures
Lower quartile (Q1) Q1 = ∑F/4
Q1 = L + (∑F/4 – C)/F * CI =£91.5
7
⊘ This is a preview!⊘
Do you want full access?
Subscribe today to unlock all pages.
Trusted by 1+ million students worldwide
Upper quartile (Q3) Q3 = 3(∑F/4)
Q3 = L + [3(∑F/4)-C/F]* CI =£274.5
Inter-quartile range (Q2) (Q3 - Q1) =£183
Table 5: Calculation of percentile
Type of quartile Value
25.00% £91.5
50.00% £183
75.00% £274.5
Table 6: Calculation of correlation
Particulars Sales (in £,000) Profit (in £,000)
Sales (in £,000) 1 0.98
Profit (in £,000) 0.98 1
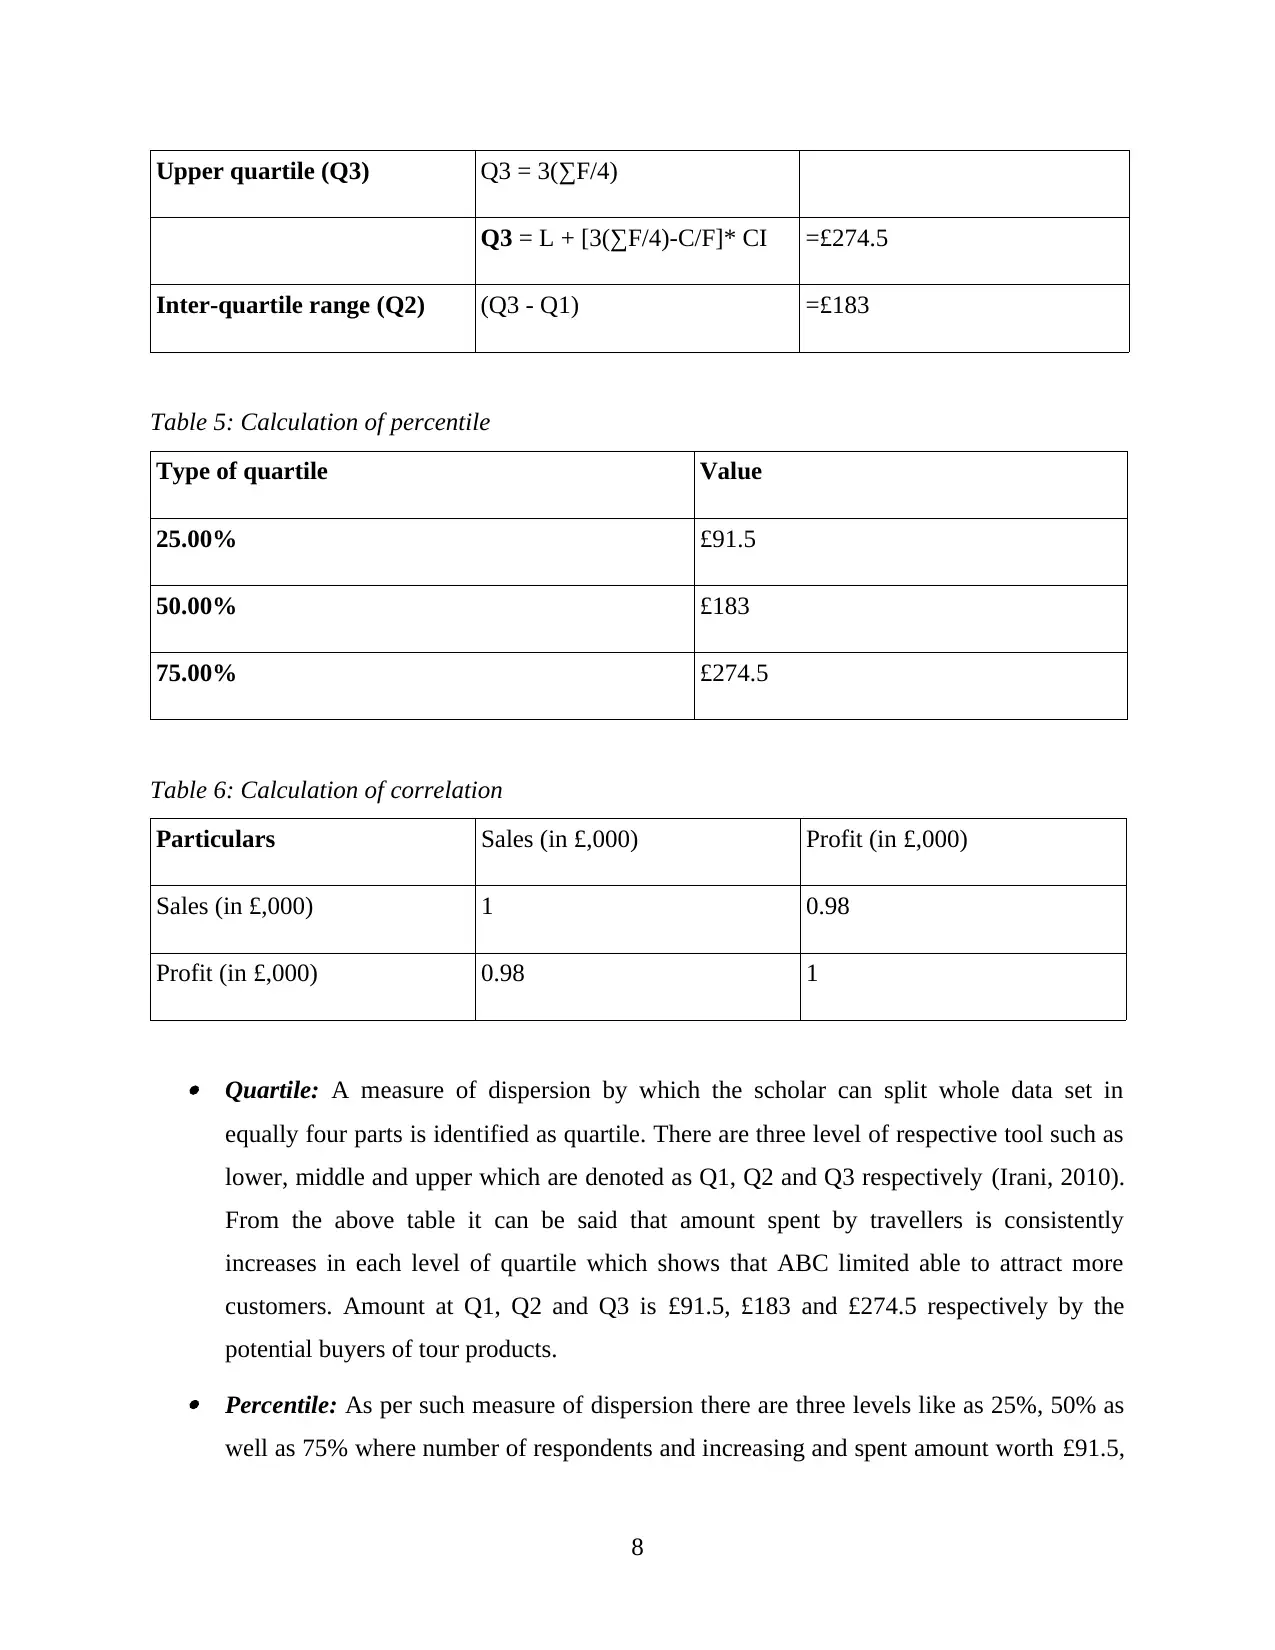
Quartile: A measure of dispersion by which the scholar can split whole data set in
equally four parts is identified as quartile. There are three level of respective tool such as
lower, middle and upper which are denoted as Q1, Q2 and Q3 respectively (Irani, 2010).
From the above table it can be said that amount spent by travellers is consistently
increases in each level of quartile which shows that ABC limited able to attract more
customers. Amount at Q1, Q2 and Q3 is £91.5, £183 and £274.5 respectively by the
potential buyers of tour products. Percentile: As per such measure of dispersion there are three levels like as 25%, 50% as
well as 75% where number of respondents and increasing and spent amount worth £91.5,
8
Q3 = L + [3(∑F/4)-C/F]* CI =£274.5
Inter-quartile range (Q2) (Q3 - Q1) =£183
Table 5: Calculation of percentile
Type of quartile Value
25.00% £91.5
50.00% £183
75.00% £274.5
Table 6: Calculation of correlation
Particulars Sales (in £,000) Profit (in £,000)
Sales (in £,000) 1 0.98
Profit (in £,000) 0.98 1
Quartile: A measure of dispersion by which the scholar can split whole data set in
equally four parts is identified as quartile. There are three level of respective tool such as
lower, middle and upper which are denoted as Q1, Q2 and Q3 respectively (Irani, 2010).
From the above table it can be said that amount spent by travellers is consistently
increases in each level of quartile which shows that ABC limited able to attract more
customers. Amount at Q1, Q2 and Q3 is £91.5, £183 and £274.5 respectively by the
potential buyers of tour products. Percentile: As per such measure of dispersion there are three levels like as 25%, 50% as
well as 75% where number of respondents and increasing and spent amount worth £91.5,
8
Paraphrase This Document
Need a fresh take? Get an instant paraphrase of this document with our AI Paraphraser
£183 and £274.5 respectively. By this it can be analysed that the company is performing
well.
Correlation: The tool is used by scholar for understand relationship among two variables
which are interrelated. Standard value of the correlation of coefficient is always lies
between -1 to +1 (Bennouna, Meredith and Marchant, 2010). In the present case relation
among sales and profit of ABC limited is strong and highly effective. Here correlation is
0.98 which indicates that both the variables impact on each other directly that means if
sales reduces then profit as well and vice-versa.
TASK 3
3.1 Producing graphs and charts and its interpretation
Graphical representation is a tool by which analyst and scholar both can easily interpret
the data which are available and calculated. In the present research report there is sales or
revenue and profit or margin data are shown from the accounting period 2011 to 2016 of ABC
Limited. There are different kinds of graphs and charts which can be conducted for proper and
effective analysis (Carr, Kolehmainen and Mitchell, 2010). Among them here pie chart, bar
graph, line chart and histogram are drawn which are given as below with interpretation:
Year
Sales (in
£,000)
Profit (in
£,000)
2011 250 90
2012 310 110
2013 265 95
2014 325 125
2015 390 150
2016 430 190
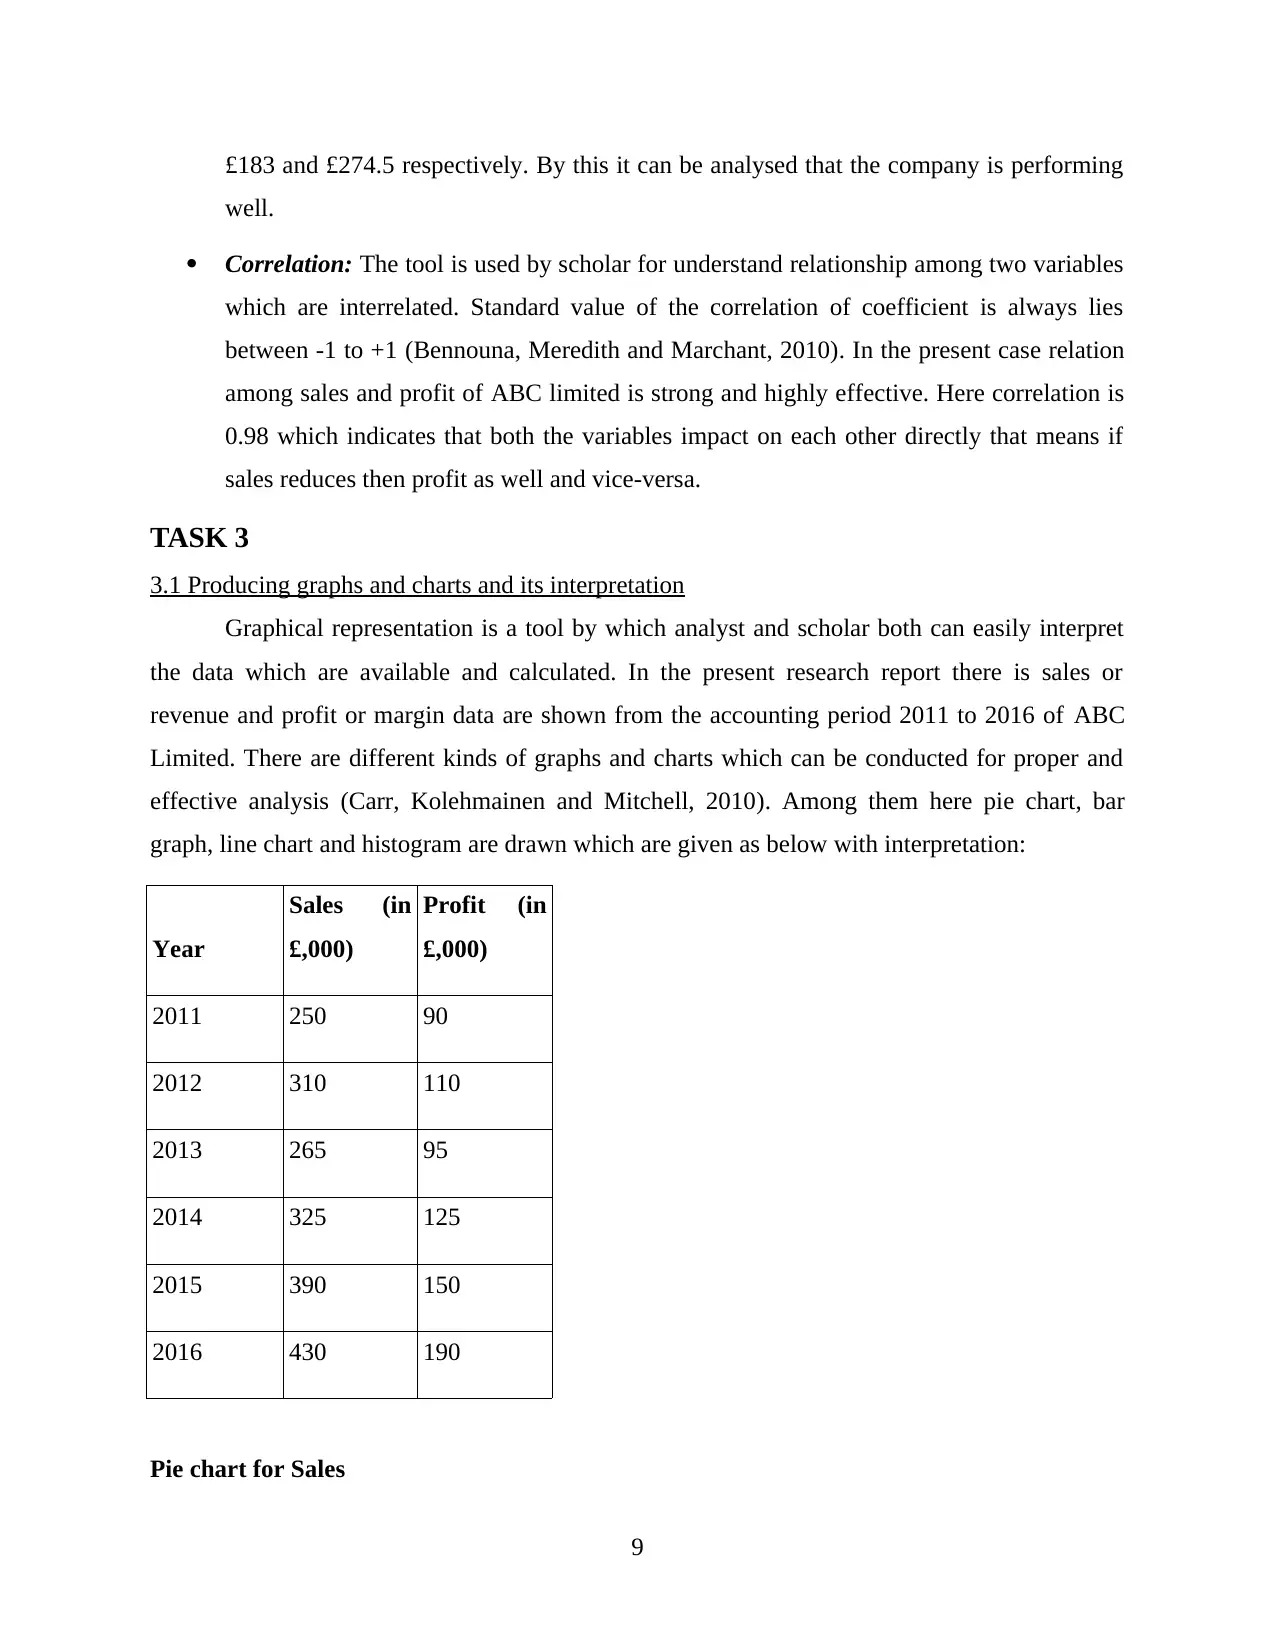
Pie chart for Sales
9
well.
Correlation: The tool is used by scholar for understand relationship among two variables
which are interrelated. Standard value of the correlation of coefficient is always lies
between -1 to +1 (Bennouna, Meredith and Marchant, 2010). In the present case relation
among sales and profit of ABC limited is strong and highly effective. Here correlation is
0.98 which indicates that both the variables impact on each other directly that means if
sales reduces then profit as well and vice-versa.
TASK 3
3.1 Producing graphs and charts and its interpretation
Graphical representation is a tool by which analyst and scholar both can easily interpret
the data which are available and calculated. In the present research report there is sales or
revenue and profit or margin data are shown from the accounting period 2011 to 2016 of ABC
Limited. There are different kinds of graphs and charts which can be conducted for proper and
effective analysis (Carr, Kolehmainen and Mitchell, 2010). Among them here pie chart, bar
graph, line chart and histogram are drawn which are given as below with interpretation:
Year
Sales (in
£,000)
Profit (in
£,000)
2011 250 90
2012 310 110
2013 265 95
2014 325 125
2015 390 150
2016 430 190
Pie chart for Sales
9
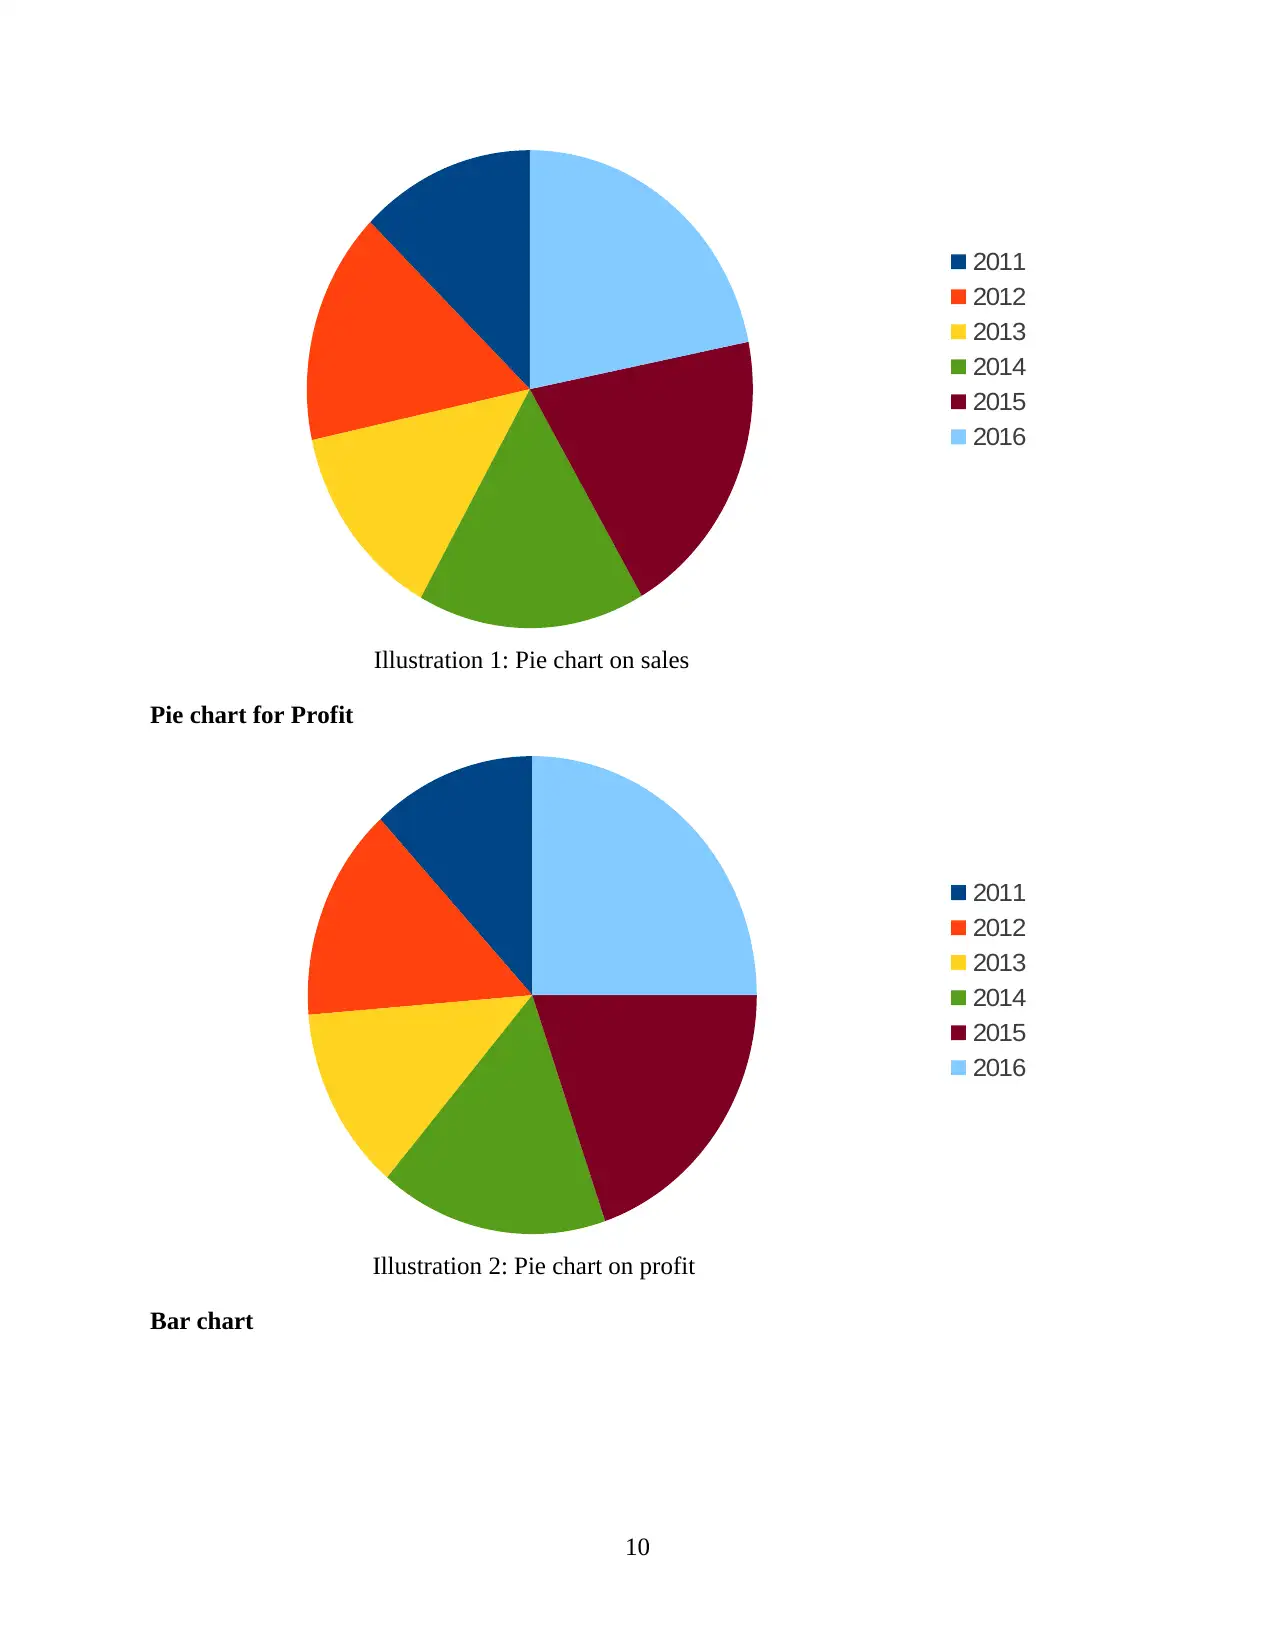
Illustration 1: Pie chart on sales
Pie chart for Profit
Illustration 2: Pie chart on profit
Bar chart
10
2011
2012
2013
2014
2015
2016
2011
2012
2013
2014
2015
2016
Pie chart for Profit
Illustration 2: Pie chart on profit
Bar chart
10
2011
2012
2013
2014
2015
2016
2011
2012
2013
2014
2015
2016
⊘ This is a preview!⊘
Do you want full access?
Subscribe today to unlock all pages.
Trusted by 1+ million students worldwide
1 out of 22
Related Documents


Your All-in-One AI-Powered Toolkit for Academic Success.
+13062052269
info@desklib.com
Available 24*7 on WhatsApp / Email
![[object Object]](/_next/static/media/star-bottom.7253800d.svg)
Unlock your academic potential
Copyright © 2020–2026 A2Z Services. All Rights Reserved. Developed and managed by ZUCOL.