Business Decision Making Report: Data Analysis and Forecasting, London
VerifiedAdded on 2020/07/22
|18
|4378
|128
Report
AI Summary
This report focuses on business decision-making for Food For Friends, aiming to open a new outlet in London. It involves a survey using primary and secondary data, followed by data interpretation and analysis using statistical approaches, measures of central tendency, dispersion, and correlation. The report includes questionnaire design, data creation, and the formulation of graphs and charts for trend line forecasting. Further, it discusses the application of decision support systems, Gantt charts, network diagrams, IRR, and NPV in the decision-making process. The report culminates in a formal business report for senior management, providing recommendations based on the analyzed data and software-generated insights. The report also explores the methodologies for data collection, including primary data through questionnaires and secondary data from existing sources. Various sampling methods are also discussed, and the questionnaire used to gather data is presented with the analysis of the data collected.
Business decision making
Paraphrase This Document
Need a fresh take? Get an instant paraphrase of this document with our AI Paraphraser
Table of Contents
INTRODUCTION...........................................................................................................................1
TASK 1............................................................................................................................................1
1.1 Plan for collecting primary and secondary data....................................................................1
1.2 Survey methodology and sampling frame used in this project.............................................2
1.3 Designing of questionnaire...................................................................................................3
2.1 Information creation on the basis of questionnaire...............................................................4
2.2 Analysis of data with measure of central tendency...............................................................5
2.3 Interpretation of data with measure of dispersion.................................................................6
2.4 Formulation of data with correlation coefficient..................................................................7
TASK 2............................................................................................................................................8
3.1 Creation of graphs and charts................................................................................................8
3.2 Formulation of trend line for future forecasting...................................................................8
3.3 Presentation of graphs and charts..........................................................................................8
3.4 Formal business report for management...............................................................................8
TASK 3............................................................................................................................................9
4.1 Use of support system in order to take beneficial decision...................................................9
4.2 Use of Gantt chart and network diagram in order to determine time....................................9
4.3 Use of IRR and NPV in decision making process..............................................................10
CONCLUSION..............................................................................................................................12
REFERENCES..............................................................................................................................13

⊘ This is a preview!⊘
Do you want full access?
Subscribe today to unlock all pages.
Trusted by 1+ million students worldwide
INTRODUCTION
Business is not based on single activity and it required appropriate consideration and
judgement to deal with diverse range of situation. Business decision making requires more
suitable and effective evaluation of things so that better elements could be acquire. This project
is based on business decision making for Food For Friends whom want to open another outlet in
London, UK. For this aspect, they will going to organise a survey through primary and secondary
source of information. On the basis of acquire data, they will going to interpret and analyse it
with statistical approach and graphs/ charts. This will enable them to determine every aspect in
crucial and critical frame. Such things will lead to underpin with a formal business report to
senior management of a company. Thus, the final and suitable consideration will going to bring
out with software generated data.
TASK 1
1.1 Plan for collecting primary and secondary data
In an investigation, there is a need to utilize fitting and reasonable apparatus and system
to comprehend different number of certainties. In this manner, it is a noteworthy thing to use
fitting and advantageous way to deal with examine information appropriately so compelling
increase could be advanced. The below disseminate information evaluate the best approach for
Food For friends for taking appropriate judgement:
Primary data: Every undertaking need crude material to comprehend different certainties
and things in an appropriate way. Essential information is useful to comprehend the
suitable actualities and things by social occasion new data so better working and basic
leadership complete. This could be perform through poll, live studies by means of online
networking and so forth.
Secondary data: Another strategy for information accumulation is optional wellspring of
data in which as of now existed data get use to comprehend different fitting and
reasonable statistical data points. This complete based on different books, diaries, articles
and so on.
For this undertaking, essential information process get use which additionally aid better
comprehension of different respondents conclusion keeping in mind the end goal to oversee and
1
Paraphrase This Document
Need a fresh take? Get an instant paraphrase of this document with our AI Paraphraser
keep up adequacy and proficiency (Beach and Lipshitz, 2017). The arrangement for gathering
essential information means as take after:
Need to survey the adaptability of data and information accumulation process
Decide and select the fitting example estimate on which examination going to happen
which is 80 respondent
Distinguish the best approach or strategy for information gathering which is random
sampling frame with application of questionnaire.
Select best way to deal with break down the result
1.2 Survey methodology and sampling frame used in this project
Review characterize as a procedure through which information get gathered on any
characterize and concern issue or an issue (Blondel and Müller-Rommel, 2016). It is imperative
to arrange proper and reasonable study for any characterize issue with the goal that better and
suitable result could be pick up.
Questionnaire: It is one of a proper method to sort out a review with the goal that sincere
belief of every last individual could be pick up (Drucker, 2017). It empower in better and
powerful judgement with the goal that useful translation complete.
Personal Interview: Another device for study is close to home meeting which help in
giving more qualified perspective with a specific end goal to improve and advance viability.
Social media: According to the present time, web-based social networking portrays as a
rising wellspring of study. It will aid better and reasonable pick up with the goal that proficiency
and viability could be amplify and additionally youth feeling could determine.
There are various kinds of sampling frame get evaluated out of which best one required
to get selected so that effective and efficient survey lead to take place. This will assist them in
bring out positive response so that beneficial gain could become possible. Below are the several
kinds of sampling which need to understand by the Food For Friends for organise their study in
an appropriate and suitable manner:
Random Sampling
Cluster sampling
Strata sampling
2
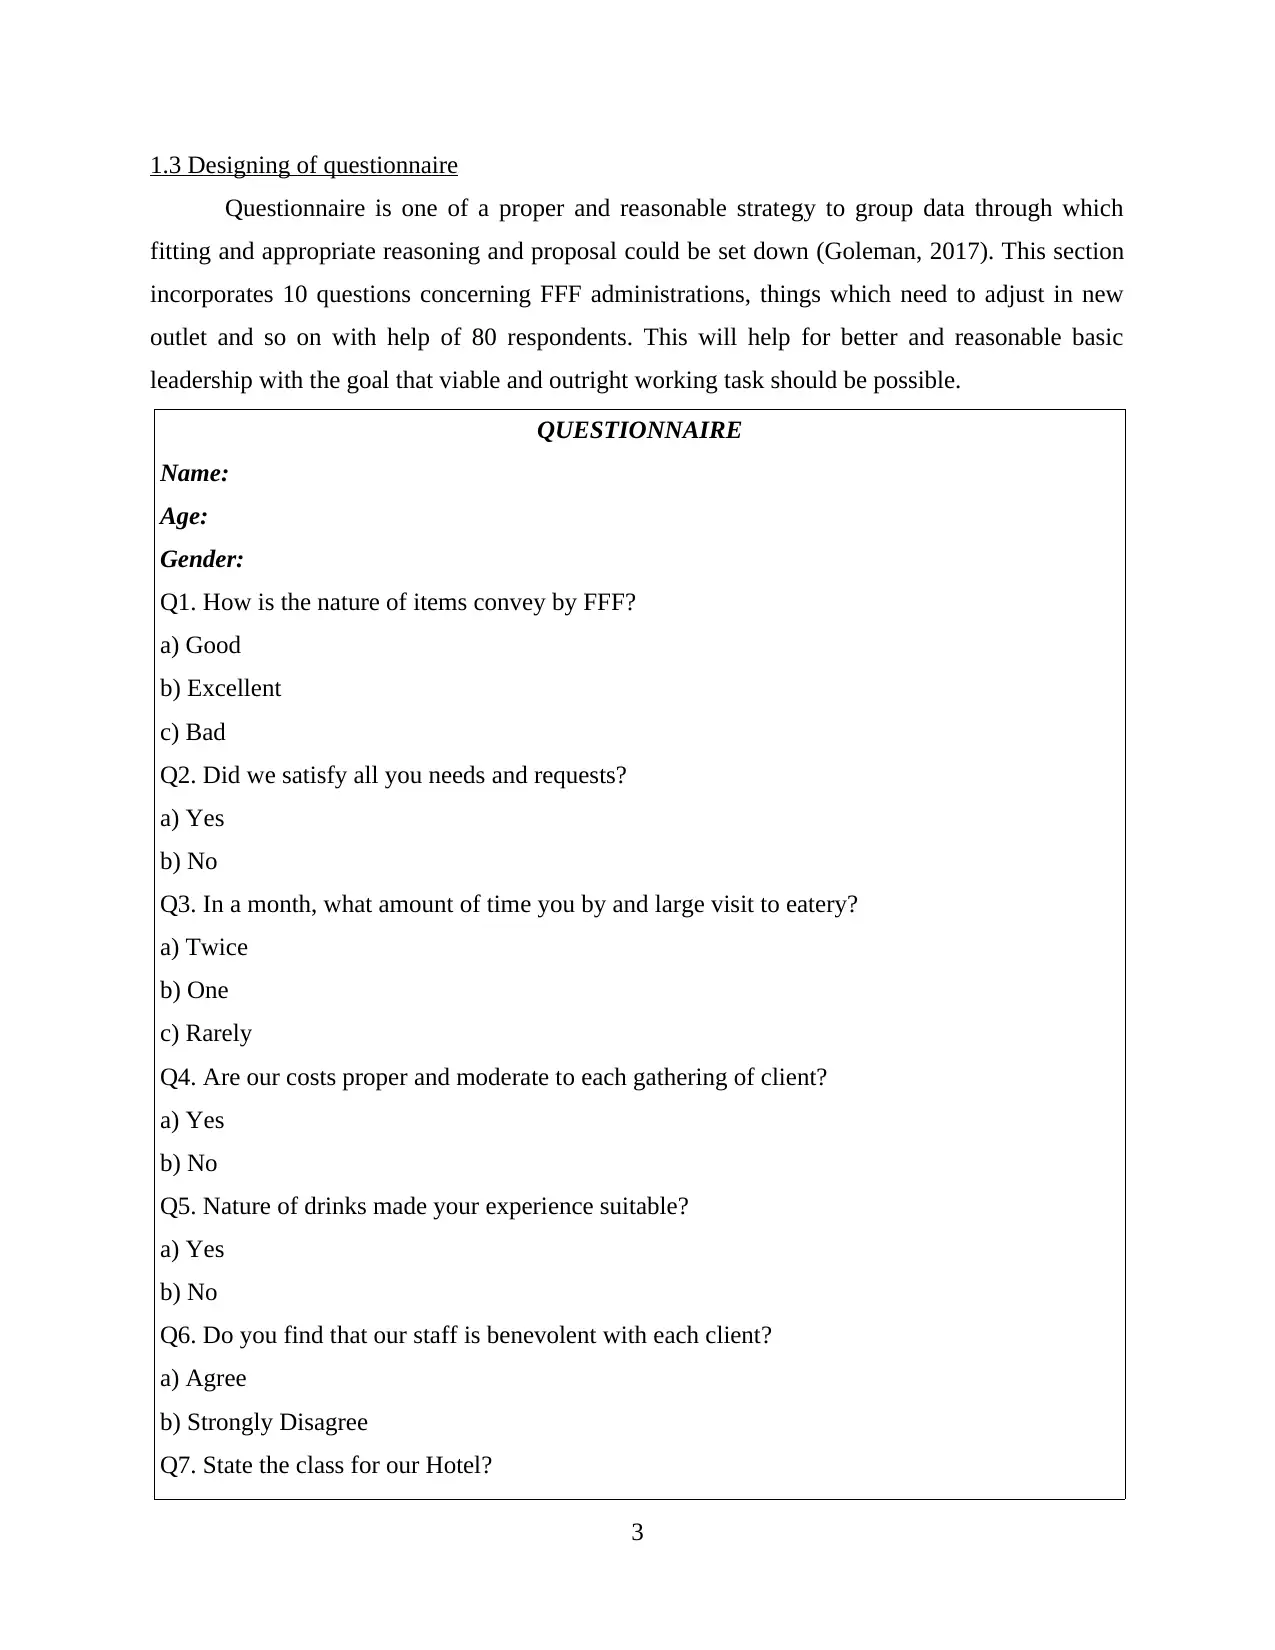
1.3 Designing of questionnaire
Questionnaire is one of a proper and reasonable strategy to group data through which
fitting and appropriate reasoning and proposal could be set down (Goleman, 2017). This section
incorporates 10 questions concerning FFF administrations, things which need to adjust in new
outlet and so on with help of 80 respondents. This will help for better and reasonable basic
leadership with the goal that viable and outright working task should be possible.
QUESTIONNAIRE
Name:
Age:
Gender:
Q1. How is the nature of items convey by FFF?
a) Good
b) Excellent
c) Bad
Q2. Did we satisfy all you needs and requests?
a) Yes
b) No
Q3. In a month, what amount of time you by and large visit to eatery?
a) Twice
b) One
c) Rarely
Q4. Are our costs proper and moderate to each gathering of client?
a) Yes
b) No
Q5. Nature of drinks made your experience suitable?
a) Yes
b) No
Q6. Do you find that our staff is benevolent with each client?
a) Agree
b) Strongly Disagree
Q7. State the class for our Hotel?
3
⊘ This is a preview!⊘
Do you want full access?
Subscribe today to unlock all pages.
Trusted by 1+ million students worldwide
a) Five star
b) Three star
c) Average
Q8. Does you ever allude FFF to others?
a) Yes
b) No
Q9. Which area is helpful for FFF new chain?
a) Near to ocean side
b) Rooftop
Q10. Any further and appropriate suggestion...
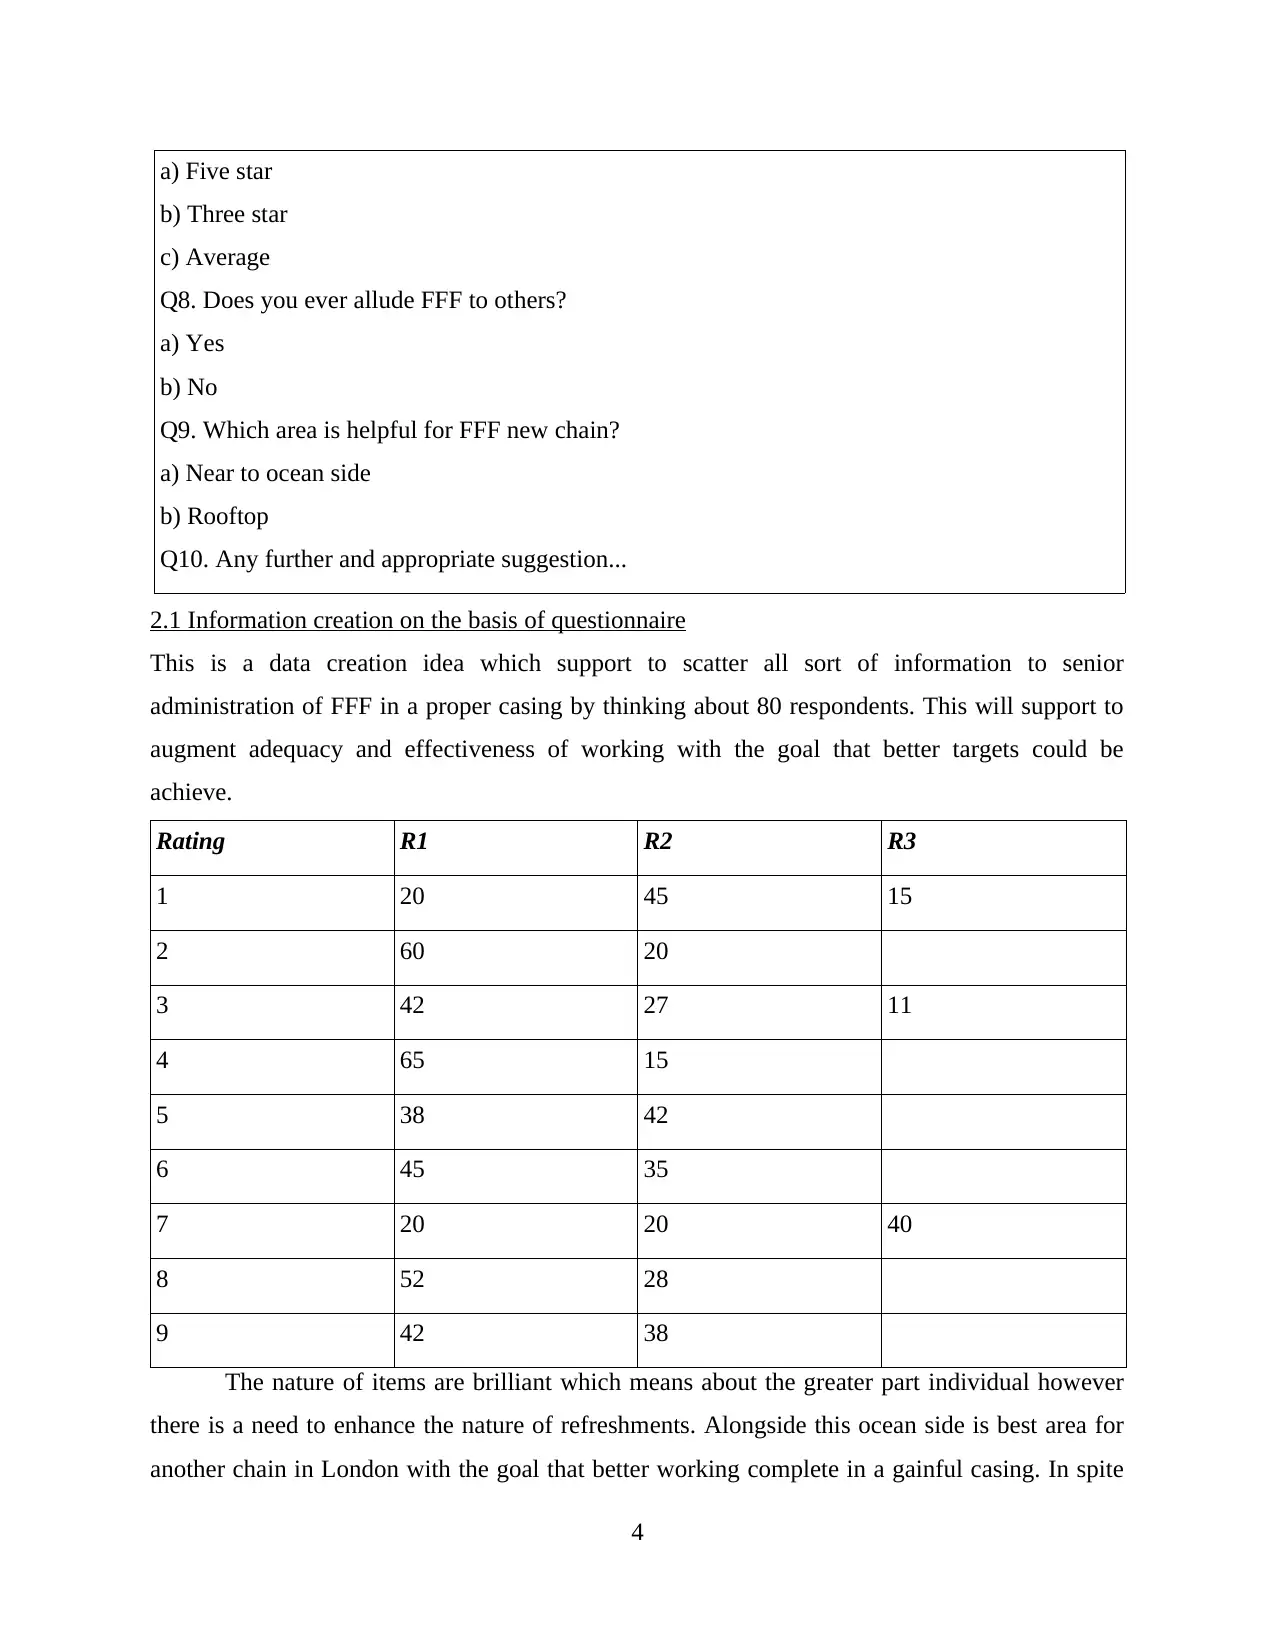
2.1 Information creation on the basis of questionnaire
This is a data creation idea which support to scatter all sort of information to senior
administration of FFF in a proper casing by thinking about 80 respondents. This will support to
augment adequacy and effectiveness of working with the goal that better targets could be
achieve.
Rating R1 R2 R3
1 20 45 15
2 60 20
3 42 27 11
4 65 15
5 38 42
6 45 35
7 20 20 40
8 52 28
9 42 38
The nature of items are brilliant which means about the greater part individual however
there is a need to enhance the nature of refreshments. Alongside this ocean side is best area for
another chain in London with the goal that better working complete in a gainful casing. In spite
4
b) Three star
c) Average
Q8. Does you ever allude FFF to others?
a) Yes
b) No
Q9. Which area is helpful for FFF new chain?
a) Near to ocean side
b) Rooftop
Q10. Any further and appropriate suggestion...
2.1 Information creation on the basis of questionnaire
This is a data creation idea which support to scatter all sort of information to senior
administration of FFF in a proper casing by thinking about 80 respondents. This will support to
augment adequacy and effectiveness of working with the goal that better targets could be
achieve.
Rating R1 R2 R3
1 20 45 15
2 60 20
3 42 27 11
4 65 15
5 38 42
6 45 35
7 20 20 40
8 52 28
9 42 38
The nature of items are brilliant which means about the greater part individual however
there is a need to enhance the nature of refreshments. Alongside this ocean side is best area for
another chain in London with the goal that better working complete in a gainful casing. In spite
4
Paraphrase This Document
Need a fresh take? Get an instant paraphrase of this document with our AI Paraphraser
of the fact that, there are a few number of contemplations get explained which need to ad lib in
characterize outline with the goal that better and fitting outcomes could be drawn.
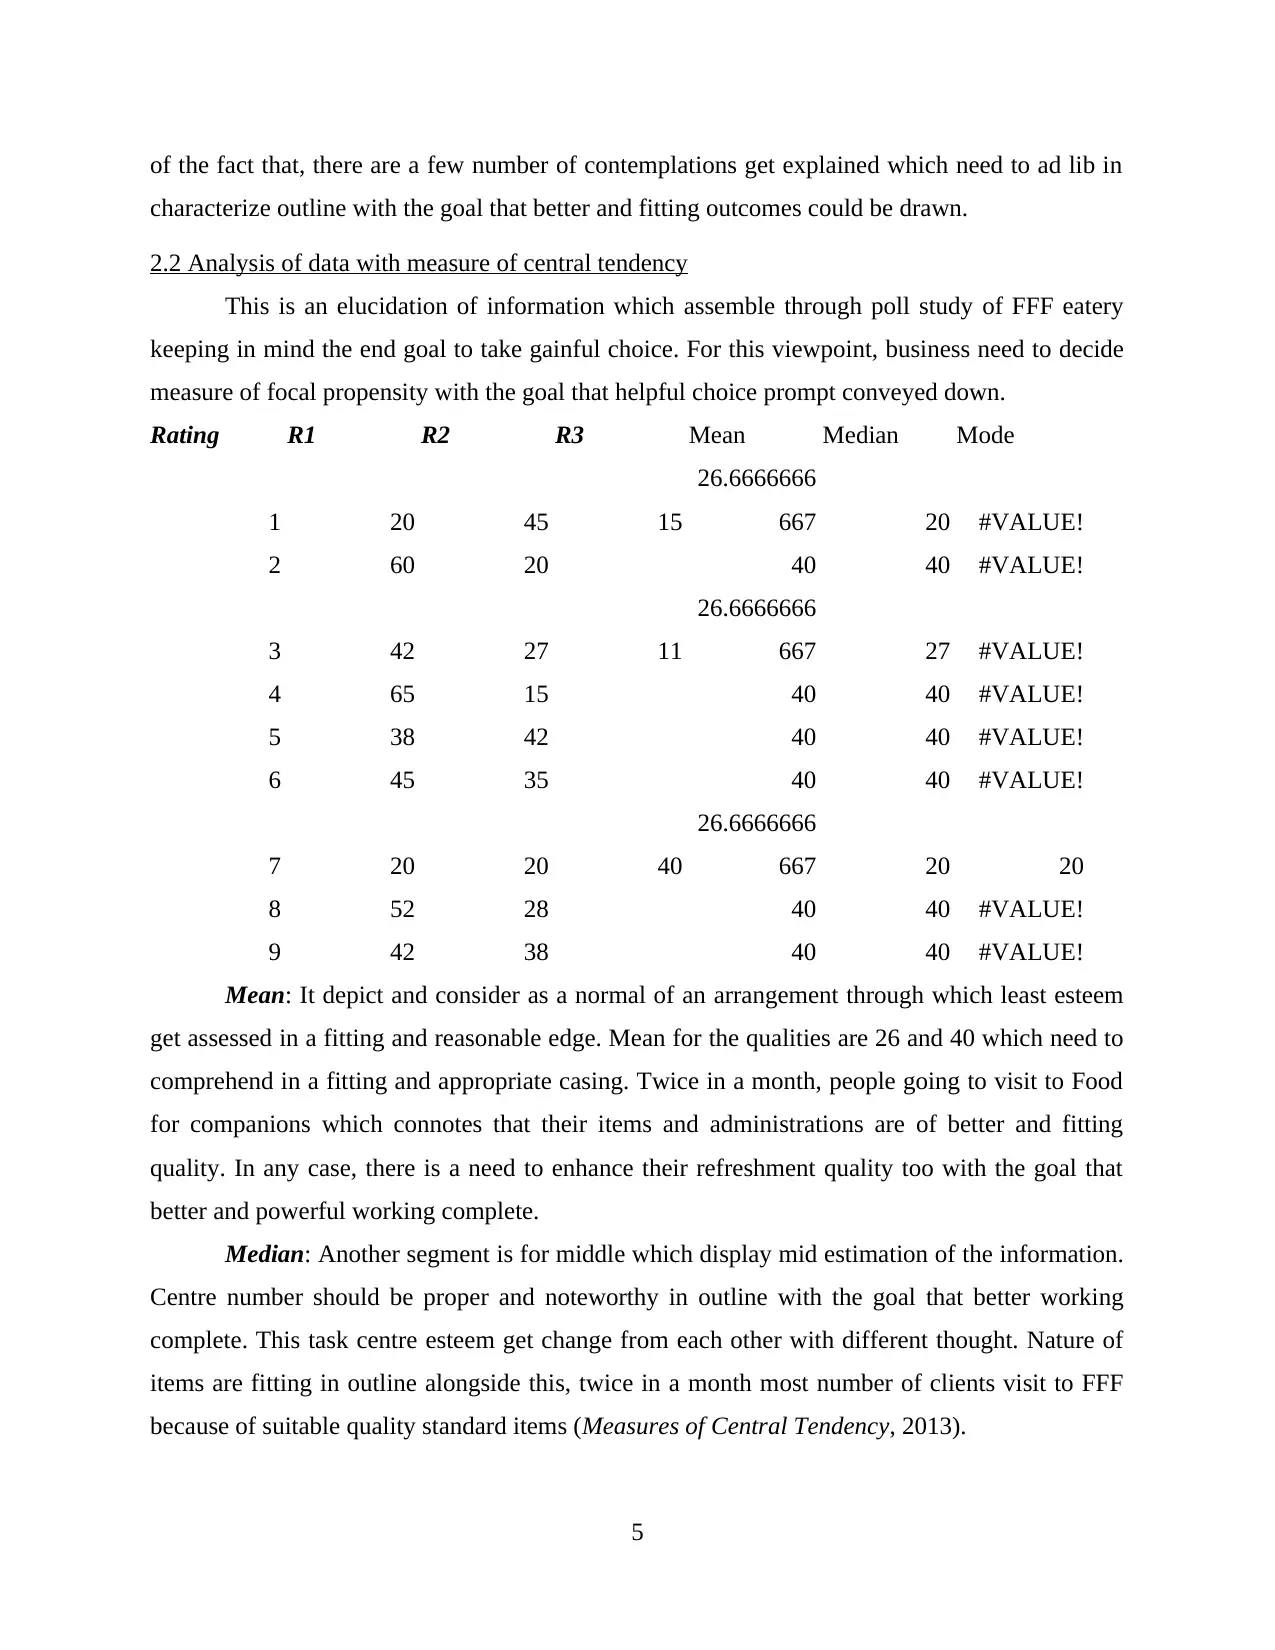
2.2 Analysis of data with measure of central tendency
This is an elucidation of information which assemble through poll study of FFF eatery
keeping in mind the end goal to take gainful choice. For this viewpoint, business need to decide
measure of focal propensity with the goal that helpful choice prompt conveyed down.
Rating R1 R2 R3 Mean Median Mode
1 20 45 15
26.6666666
667 20 #VALUE!
2 60 20 40 40 #VALUE!
3 42 27 11
26.6666666
667 27 #VALUE!
4 65 15 40 40 #VALUE!
5 38 42 40 40 #VALUE!
6 45 35 40 40 #VALUE!
7 20 20 40
26.6666666
667 20 20
8 52 28 40 40 #VALUE!
9 42 38 40 40 #VALUE!
Mean: It depict and consider as a normal of an arrangement through which least esteem
get assessed in a fitting and reasonable edge. Mean for the qualities are 26 and 40 which need to
comprehend in a fitting and appropriate casing. Twice in a month, people going to visit to Food
for companions which connotes that their items and administrations are of better and fitting
quality. In any case, there is a need to enhance their refreshment quality too with the goal that
better and powerful working complete.
Median: Another segment is for middle which display mid estimation of the information.
Centre number should be proper and noteworthy in outline with the goal that better working
complete. This task centre esteem get change from each other with different thought. Nature of
items are fitting in outline alongside this, twice in a month most number of clients visit to FFF
because of suitable quality standard items (Measures of Central Tendency, 2013).
5
characterize outline with the goal that better and fitting outcomes could be drawn.
2.2 Analysis of data with measure of central tendency
This is an elucidation of information which assemble through poll study of FFF eatery
keeping in mind the end goal to take gainful choice. For this viewpoint, business need to decide
measure of focal propensity with the goal that helpful choice prompt conveyed down.
Rating R1 R2 R3 Mean Median Mode
1 20 45 15
26.6666666
667 20 #VALUE!
2 60 20 40 40 #VALUE!
3 42 27 11
26.6666666
667 27 #VALUE!
4 65 15 40 40 #VALUE!
5 38 42 40 40 #VALUE!
6 45 35 40 40 #VALUE!
7 20 20 40
26.6666666
667 20 20
8 52 28 40 40 #VALUE!
9 42 38 40 40 #VALUE!
Mean: It depict and consider as a normal of an arrangement through which least esteem
get assessed in a fitting and reasonable edge. Mean for the qualities are 26 and 40 which need to
comprehend in a fitting and appropriate casing. Twice in a month, people going to visit to Food
for companions which connotes that their items and administrations are of better and fitting
quality. In any case, there is a need to enhance their refreshment quality too with the goal that
better and powerful working complete.
Median: Another segment is for middle which display mid estimation of the information.
Centre number should be proper and noteworthy in outline with the goal that better working
complete. This task centre esteem get change from each other with different thought. Nature of
items are fitting in outline alongside this, twice in a month most number of clients visit to FFF
because of suitable quality standard items (Measures of Central Tendency, 2013).
5
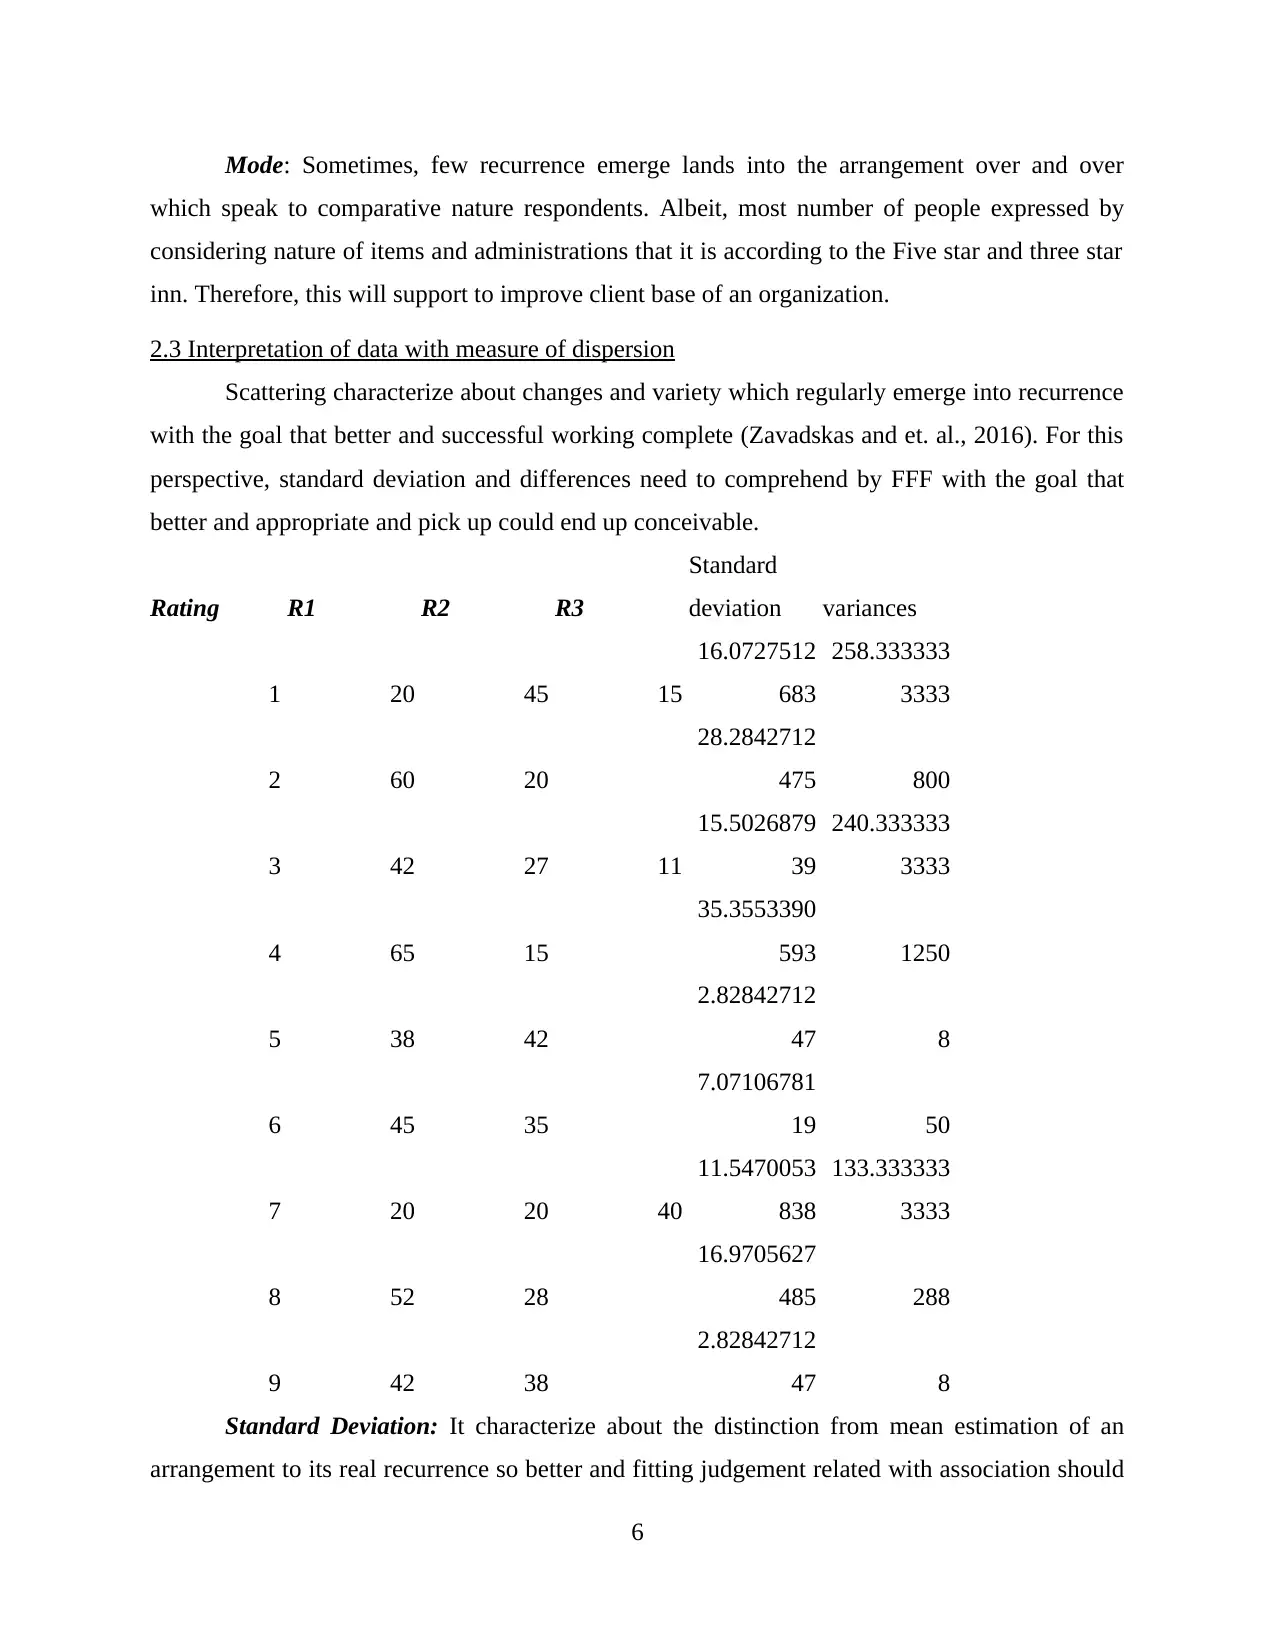
Mode: Sometimes, few recurrence emerge lands into the arrangement over and over
which speak to comparative nature respondents. Albeit, most number of people expressed by
considering nature of items and administrations that it is according to the Five star and three star
inn. Therefore, this will support to improve client base of an organization.
2.3 Interpretation of data with measure of dispersion
Scattering characterize about changes and variety which regularly emerge into recurrence
with the goal that better and successful working complete (Zavadskas and et. al., 2016). For this
perspective, standard deviation and differences need to comprehend by FFF with the goal that
better and appropriate and pick up could end up conceivable.
Rating R1 R2 R3
Standard
deviation variances
1 20 45 15
16.0727512
683
258.333333
3333
2 60 20
28.2842712
475 800
3 42 27 11
15.5026879
39
240.333333
3333
4 65 15
35.3553390
593 1250
5 38 42
2.82842712
47 8
6 45 35
7.07106781
19 50
7 20 20 40
11.5470053
838
133.333333
3333
8 52 28
16.9705627
485 288
9 42 38
2.82842712
47 8
Standard Deviation: It characterize about the distinction from mean estimation of an
arrangement to its real recurrence so better and fitting judgement related with association should
6
⊘ This is a preview!⊘
Do you want full access?
Subscribe today to unlock all pages.
Trusted by 1+ million students worldwide
be possible (Zeng, Chen and Li, 2016). Deviation empower in decide the contrasts between
different esteems like some person of Food For Friends like item and administrations whether
some not. In this perspective, costs expressed that reasonable to each gathering of client yet for
the most part administration need to made their emphasis on staff conduct which require fitting
and appropriate preparing and advancement occasion with the goal that valuable pick up could
be assessed.
Variances: Variations emerge in each arrangement or recurrence circulation table which
need to support by administration legitimately with the goal that better and suitable thought
should be possible. Most number of individual allude Food For Friends to their companions and
relatives which bolster in make things right and reasonable in nature with the goal that better and
proficient increases wind up conceivable.
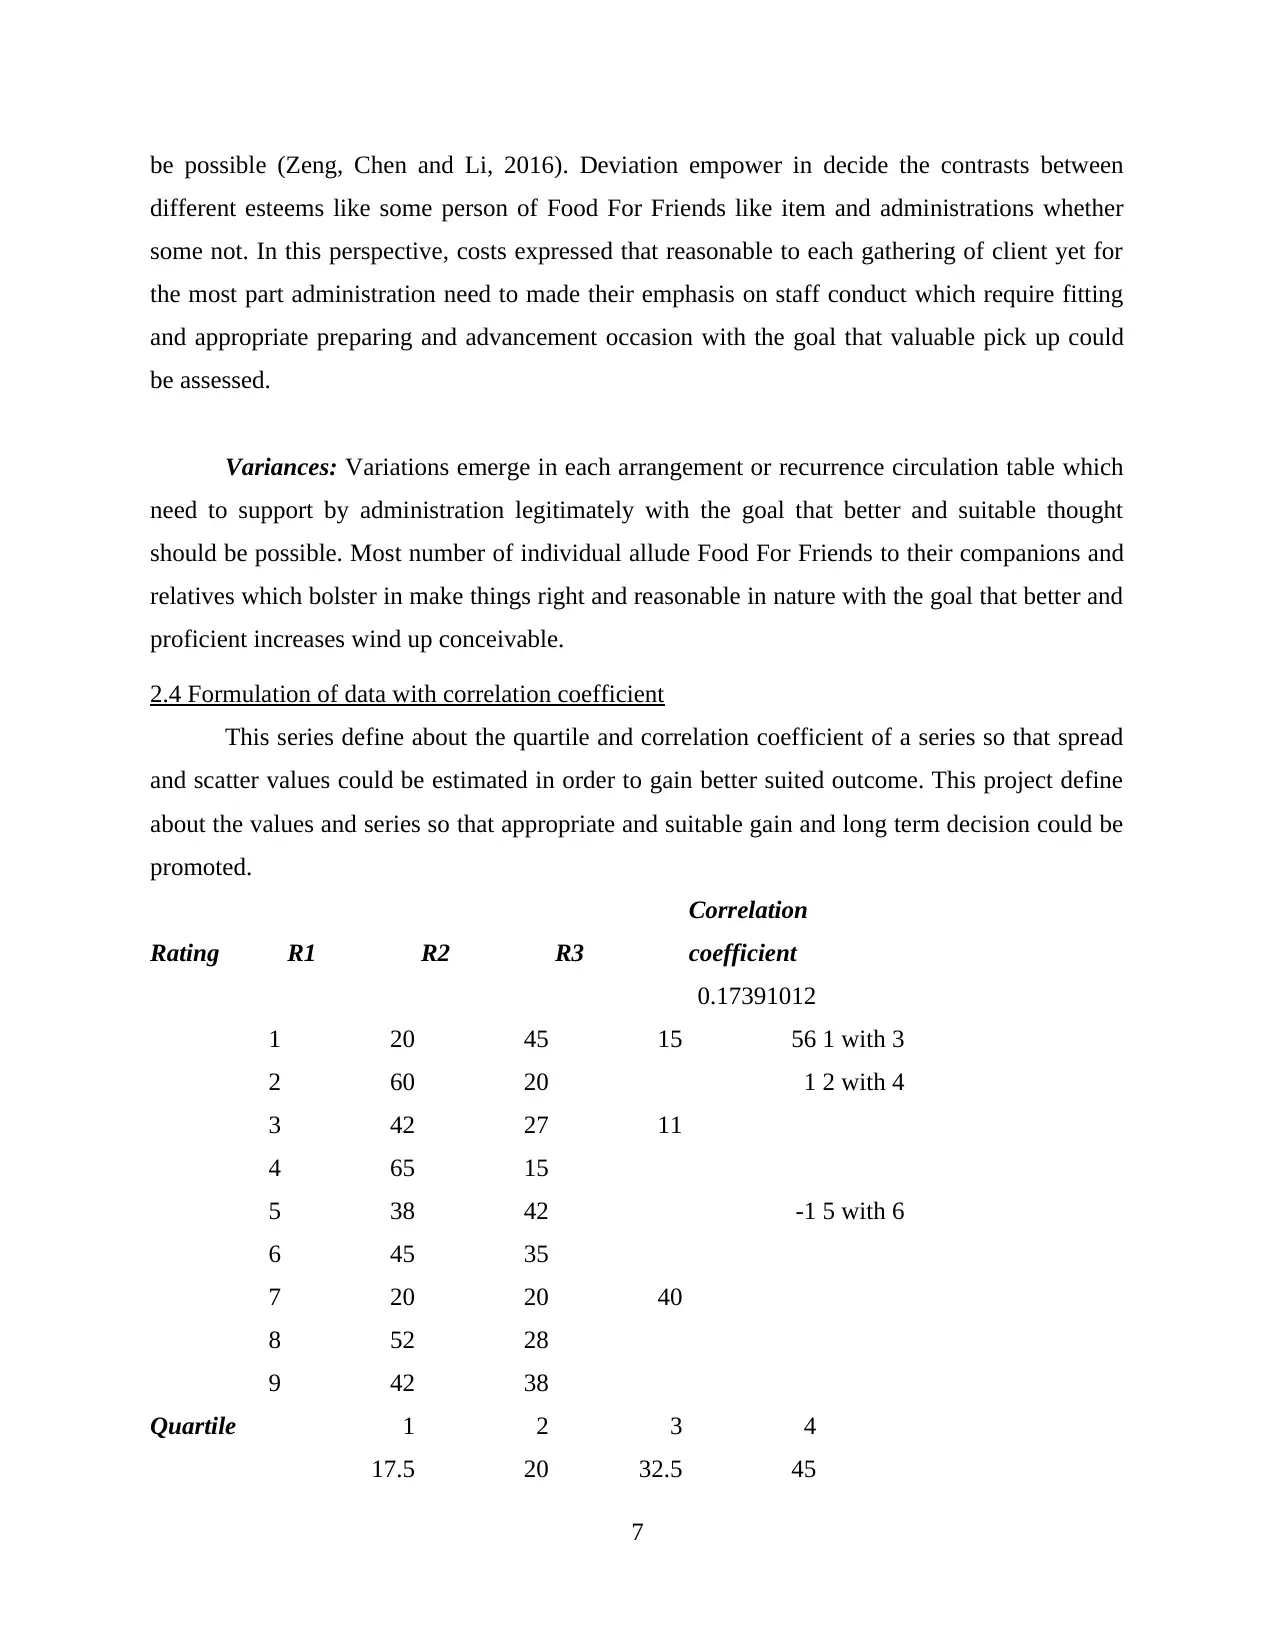
2.4 Formulation of data with correlation coefficient
This series define about the quartile and correlation coefficient of a series so that spread
and scatter values could be estimated in order to gain better suited outcome. This project define
about the values and series so that appropriate and suitable gain and long term decision could be
promoted.
Rating R1 R2 R3
Correlation
coefficient
1 20 45 15
0.17391012
56 1 with 3
2 60 20 1 2 with 4
3 42 27 11
4 65 15
5 38 42 -1 5 with 6
6 45 35
7 20 20 40
8 52 28
9 42 38
Quartile 1 2 3 4
17.5 20 32.5 45
7
different esteems like some person of Food For Friends like item and administrations whether
some not. In this perspective, costs expressed that reasonable to each gathering of client yet for
the most part administration need to made their emphasis on staff conduct which require fitting
and appropriate preparing and advancement occasion with the goal that valuable pick up could
be assessed.
Variances: Variations emerge in each arrangement or recurrence circulation table which
need to support by administration legitimately with the goal that better and suitable thought
should be possible. Most number of individual allude Food For Friends to their companions and
relatives which bolster in make things right and reasonable in nature with the goal that better and
proficient increases wind up conceivable.
2.4 Formulation of data with correlation coefficient
This series define about the quartile and correlation coefficient of a series so that spread
and scatter values could be estimated in order to gain better suited outcome. This project define
about the values and series so that appropriate and suitable gain and long term decision could be
promoted.
Rating R1 R2 R3
Correlation
coefficient
1 20 45 15
0.17391012
56 1 with 3
2 60 20 1 2 with 4
3 42 27 11
4 65 15
5 38 42 -1 5 with 6
6 45 35
7 20 20 40
8 52 28
9 42 38
Quartile 1 2 3 4
17.5 20 32.5 45
7
Paraphrase This Document
Need a fresh take? Get an instant paraphrase of this document with our AI Paraphraser
30 40 50 60
19 27 34.5 42
27.5 40 52.5 65
39 40 41 42
37.5 40 42.5 45
20 20 30 40
34 40 46 52
39 40 41 42
Correlation coefficient: A noteworthy thing which need to do with the investigation is to
decide the connection between tow or more factor so better concerning choice or judgement
prompt conveyed down keeping in mind the end goal to improve and amplify suitability.
Connection amongst quality and visit expressed that FFF convey fantastic quality items whose
reflection get support in number of visit by their clients. Consequently, twice in a month on a
normal individual visit to eatery with their family or dear ones.
Quartile: A quartile isolate different area into some quantifiable perspectives through
which better and proper basic leadership complete. The four noteworthy quadrant partition every
single area appropriately like littlest to most elevated, centre one gap two segment and so on.
Henceforth, business need to alter their working at some degree to get a tag of Five star inn and
in addition need to convey legitimate preparing with the goal that better proficiency could be
oversee and keep up.
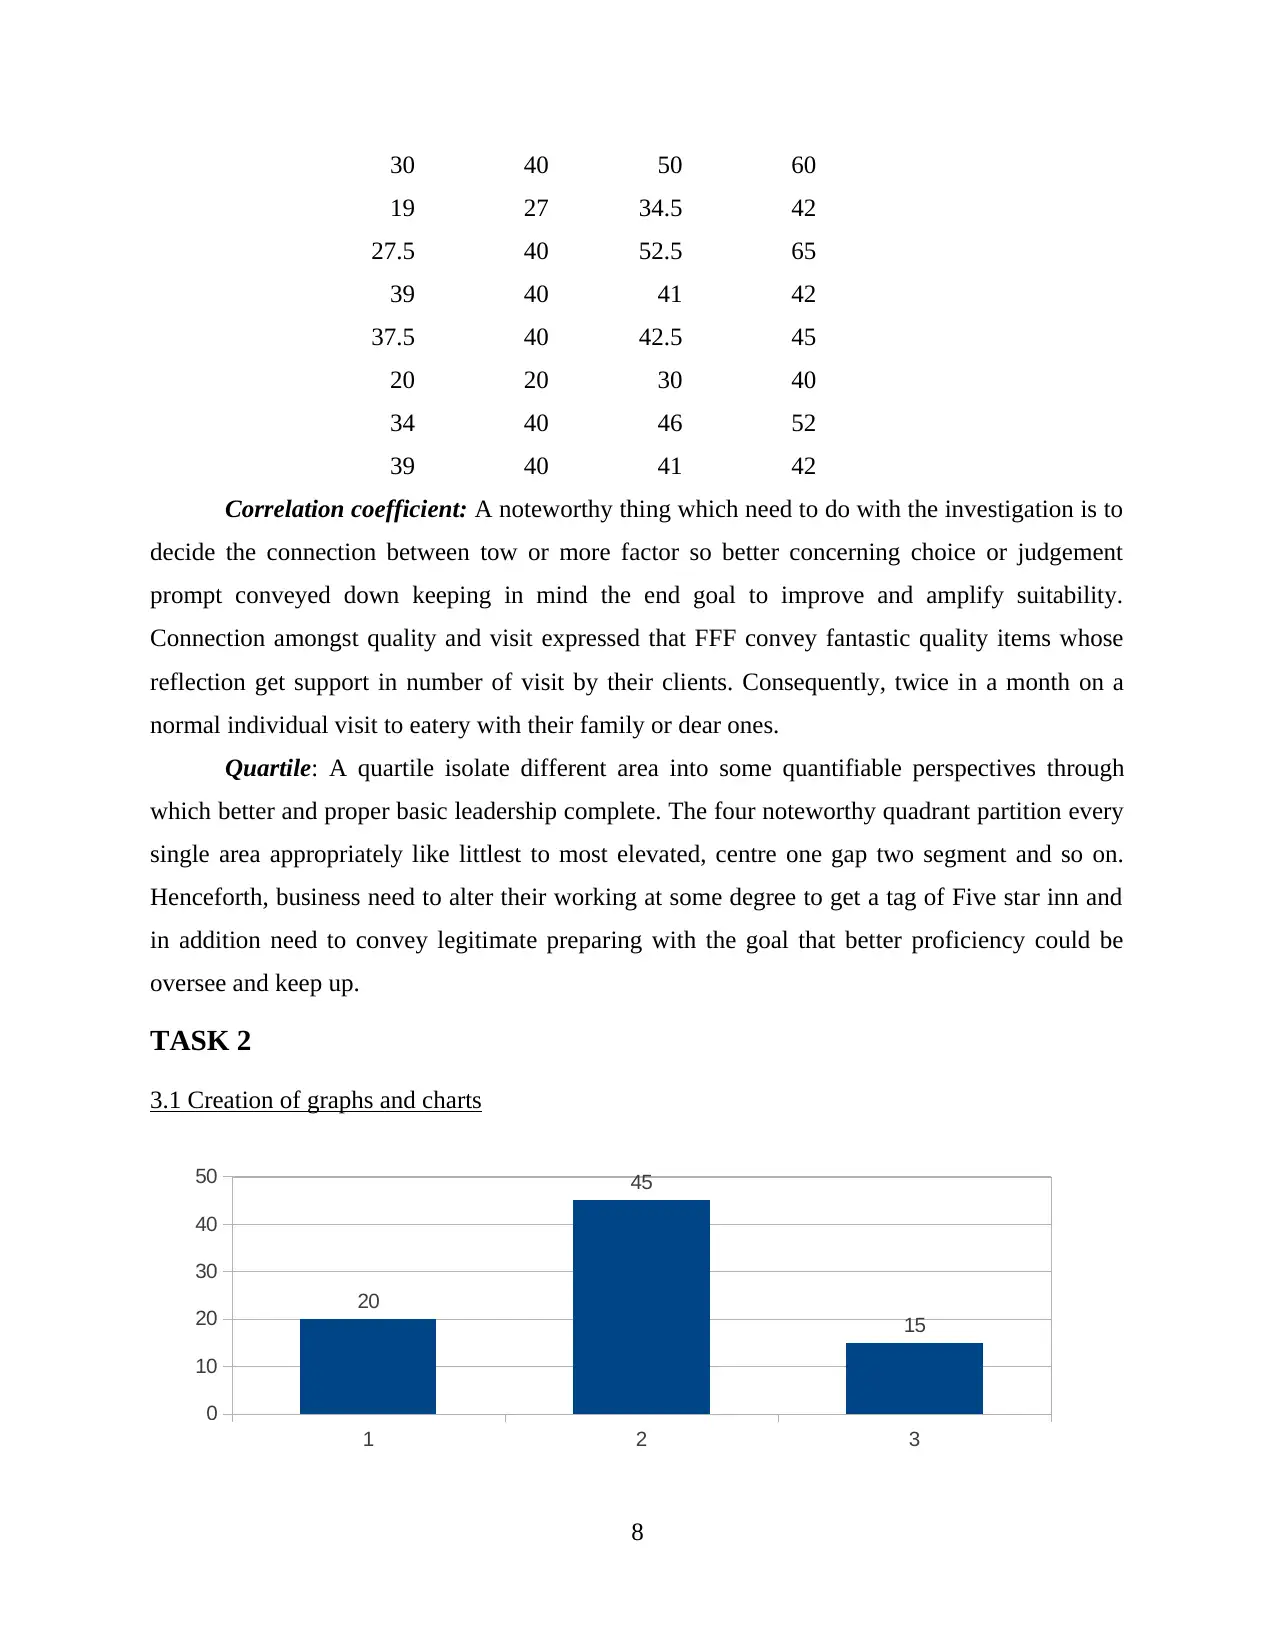
TASK 2
3.1 Creation of graphs and charts
1 2 3
0
10
20
30
40
50
20
45
15
8
19 27 34.5 42
27.5 40 52.5 65
39 40 41 42
37.5 40 42.5 45
20 20 30 40
34 40 46 52
39 40 41 42
Correlation coefficient: A noteworthy thing which need to do with the investigation is to
decide the connection between tow or more factor so better concerning choice or judgement
prompt conveyed down keeping in mind the end goal to improve and amplify suitability.
Connection amongst quality and visit expressed that FFF convey fantastic quality items whose
reflection get support in number of visit by their clients. Consequently, twice in a month on a
normal individual visit to eatery with their family or dear ones.
Quartile: A quartile isolate different area into some quantifiable perspectives through
which better and proper basic leadership complete. The four noteworthy quadrant partition every
single area appropriately like littlest to most elevated, centre one gap two segment and so on.
Henceforth, business need to alter their working at some degree to get a tag of Five star inn and
in addition need to convey legitimate preparing with the goal that better proficiency could be
oversee and keep up.
TASK 2
3.1 Creation of graphs and charts
1 2 3
0
10
20
30
40
50
20
45
15
8
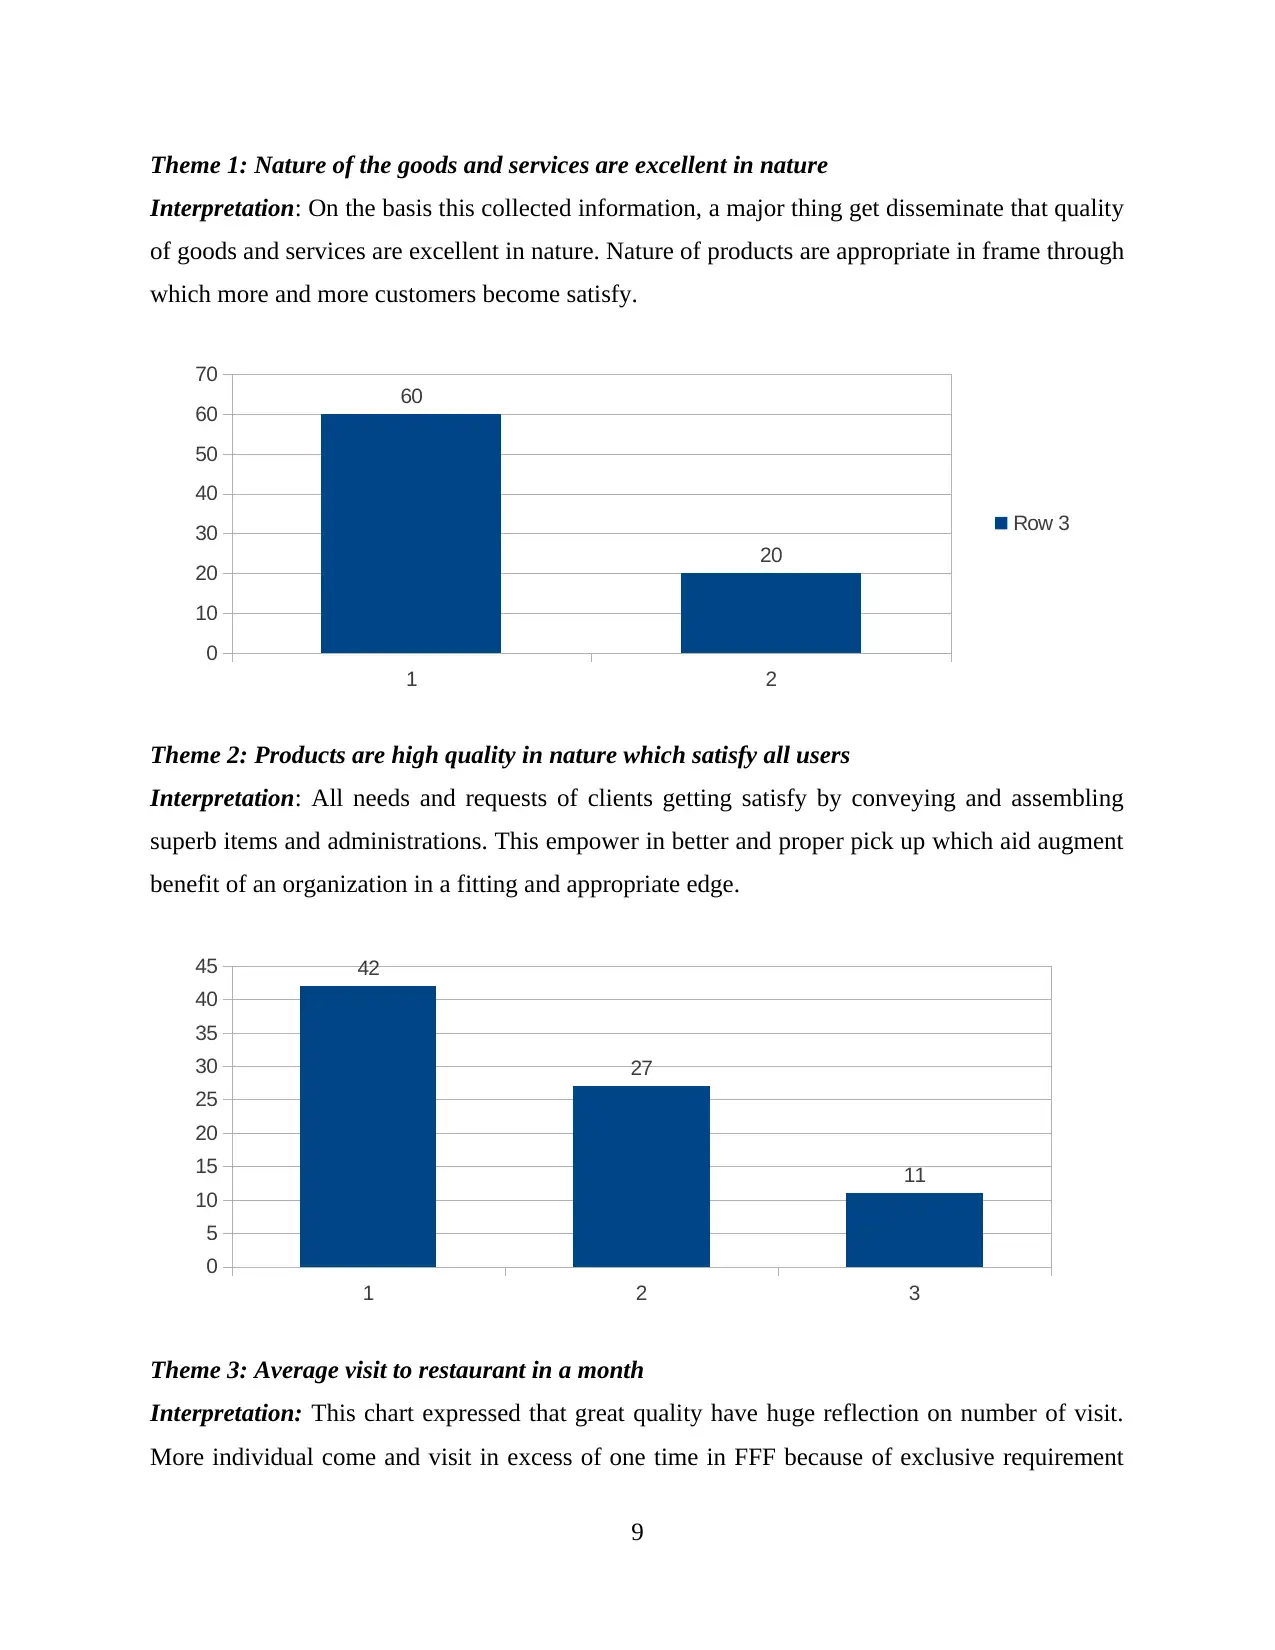
Theme 1: Nature of the goods and services are excellent in nature
Interpretation: On the basis this collected information, a major thing get disseminate that quality
of goods and services are excellent in nature. Nature of products are appropriate in frame through
which more and more customers become satisfy.
1 2
0
10
20
30
40
50
60
70
60
20
Row 3
Theme 2: Products are high quality in nature which satisfy all users
Interpretation: All needs and requests of clients getting satisfy by conveying and assembling
superb items and administrations. This empower in better and proper pick up which aid augment
benefit of an organization in a fitting and appropriate edge.
1 2 3
0
5
10
15
20
25
30
35
40
45 42
27
11
Theme 3: Average visit to restaurant in a month
Interpretation: This chart expressed that great quality have huge reflection on number of visit.
More individual come and visit in excess of one time in FFF because of exclusive requirement
9
⊘ This is a preview!⊘
Do you want full access?
Subscribe today to unlock all pages.
Trusted by 1+ million students worldwide
1 out of 18
Related Documents


Your All-in-One AI-Powered Toolkit for Academic Success.
+13062052269
info@desklib.com
Available 24*7 on WhatsApp / Email
![[object Object]](/_next/static/media/star-bottom.7253800d.svg)
Unlock your academic potential
Copyright © 2020–2026 A2Z Services. All Rights Reserved. Developed and managed by ZUCOL.