Business Decision Making: Data Analysis for Restaurant Chain Decisions
VerifiedAdded on 2019/12/03
|23
|4195
|348
Report
AI Summary
This report delves into the intricacies of business decision-making, focusing on data collection, analysis, and presentation. It begins by outlining plans for gathering both primary and secondary data, including survey methodologies and questionnaire design. The report then explores various data analysis techniques, such as descriptive statistics, measures of dispersion, and correlation coefficients, to draw valid conclusions. Furthermore, it examines the creation of information in appropriate formats, including graphs, trend lines, and business presentations, along with the use of software-generated information and financial tools for decision-making within a restaurant chain. The analysis includes financial data, statistical measures, and graphical representations to evaluate the performance of different dish types, ultimately aiding in strategic decisions about future business directions.
Business decision
making
1
making
1
Paraphrase This Document
Need a fresh take? Get an instant paraphrase of this document with our AI Paraphraser
Table of Contents
Introduction .....................................................................................................................................5
LO 1 Use variety of sources for the collection of data, both primary and secondary.....................5
1.1Plan for collection of primary and secondary data ................................................................5
1.2 Survey methodology and sampling frame.............................................................................5
1.3 Design a questionnaire ..........................................................................................................6
LO 2 Range of techniques to analyze data effectively for business purposes ................................7
2.1 Create the information for decision making .........................................................................7
2.2 Analyze results to draw valid conclusions ............................................................................9
2.3 Analyze data using measures of dispersion .........................................................................9
2.4 Explain quartiles, percentiles and correlation coefficient ..................................................10
LO 3 Produce information in appropriate formats for decision making .......................................12
3.1 Graphs through spreadsheets ..............................................................................................12
3.2 Trend lines ..........................................................................................................................12
3.3 Business presentation ..........................................................................................................13
3.4 Formal business report ........................................................................................................13
LO 4 Use software generated information to make decision in the company ..............................14
4.1 Information processing tools ...............................................................................................14
4.2 Project Plan .........................................................................................................................15
4.3 Financial tools for decision making ....................................................................................17
Conclusion ....................................................................................................................................20
References .....................................................................................................................................21
2
List of tablesList of figuresIntroduction
Different types of decisions are made within business. The purpose of this research report
is to identify how decisions are processed within firms. It will help in evaluating the methods
which are used for processing the data. Further, it will present the information in appropriate
formats for decision making within business. The study will also show the use of different
financial tools in analyzing the financial information. At last, the report will end in reflecting the
use of software generated information in the organization.
LO 1 Use variety of sources for the collection of data, both primary and
secondary
1.1 Plan for collection of primary and secondary data
In order to open its second restaurant, restaurant chain is making plans related to primary and
secondary research. The research will be targeted on the potential customers. The plan is as
follows:
Primary research – It is new and unprocessed in nature as it is collected for the first time. It
requires filtering of information to make it usable for the research. For this study, primary data
will be gathered from customers of London by adopting survey technique. In that context, a
questionnaire will be frame. It will consist of open ended and close ended questions (Fowler
2009). The sample size for the participants is 50. Technique of random sampling will be applied
for selection of samples outside different restaurants in UK.
Secondary research – On getting used by someone, the primary data becomes secondary. It is a
data which is available from published and non-published sources. So data will be collected from
secondary sources like internet, books, journals etc (Groves and et.al., 2013). All the sources will
be valid and authentic.
1.2 Survey methodology and sampling frame
For the following research, survey methodology will be used under which data will be
collected through questionnaire technique. The technique is appropriate because it helps in
collecting large volume of data at a particular point of time (Jankowicz, 2005). Questionnaire is
designed with the purpose of identifying the taste and preference of the customers in London. In
this manner different kinds of expectations and improvements will be grabbed from the people so
3
⊘ This is a preview!⊘
Do you want full access?
Subscribe today to unlock all pages.
Trusted by 1+ million students worldwide
that services of the new chain can be designed accordingly (Andersen, Dysvik and Vaagaasar,
2009).
Sampling is related with selection of appropriate sample from which relevant information
for the study can be collected. It makes the data collection work easier and more flexible. For
this study, random sampling has been adopted in order to select the samples. These will be able
outside different restaurants in UK (Hacklin and Wallnöfer, 2012). In order to fulfill the research
aim and objectives, a sample size of 50 people has been kept and it is quite appropriate for the
research.
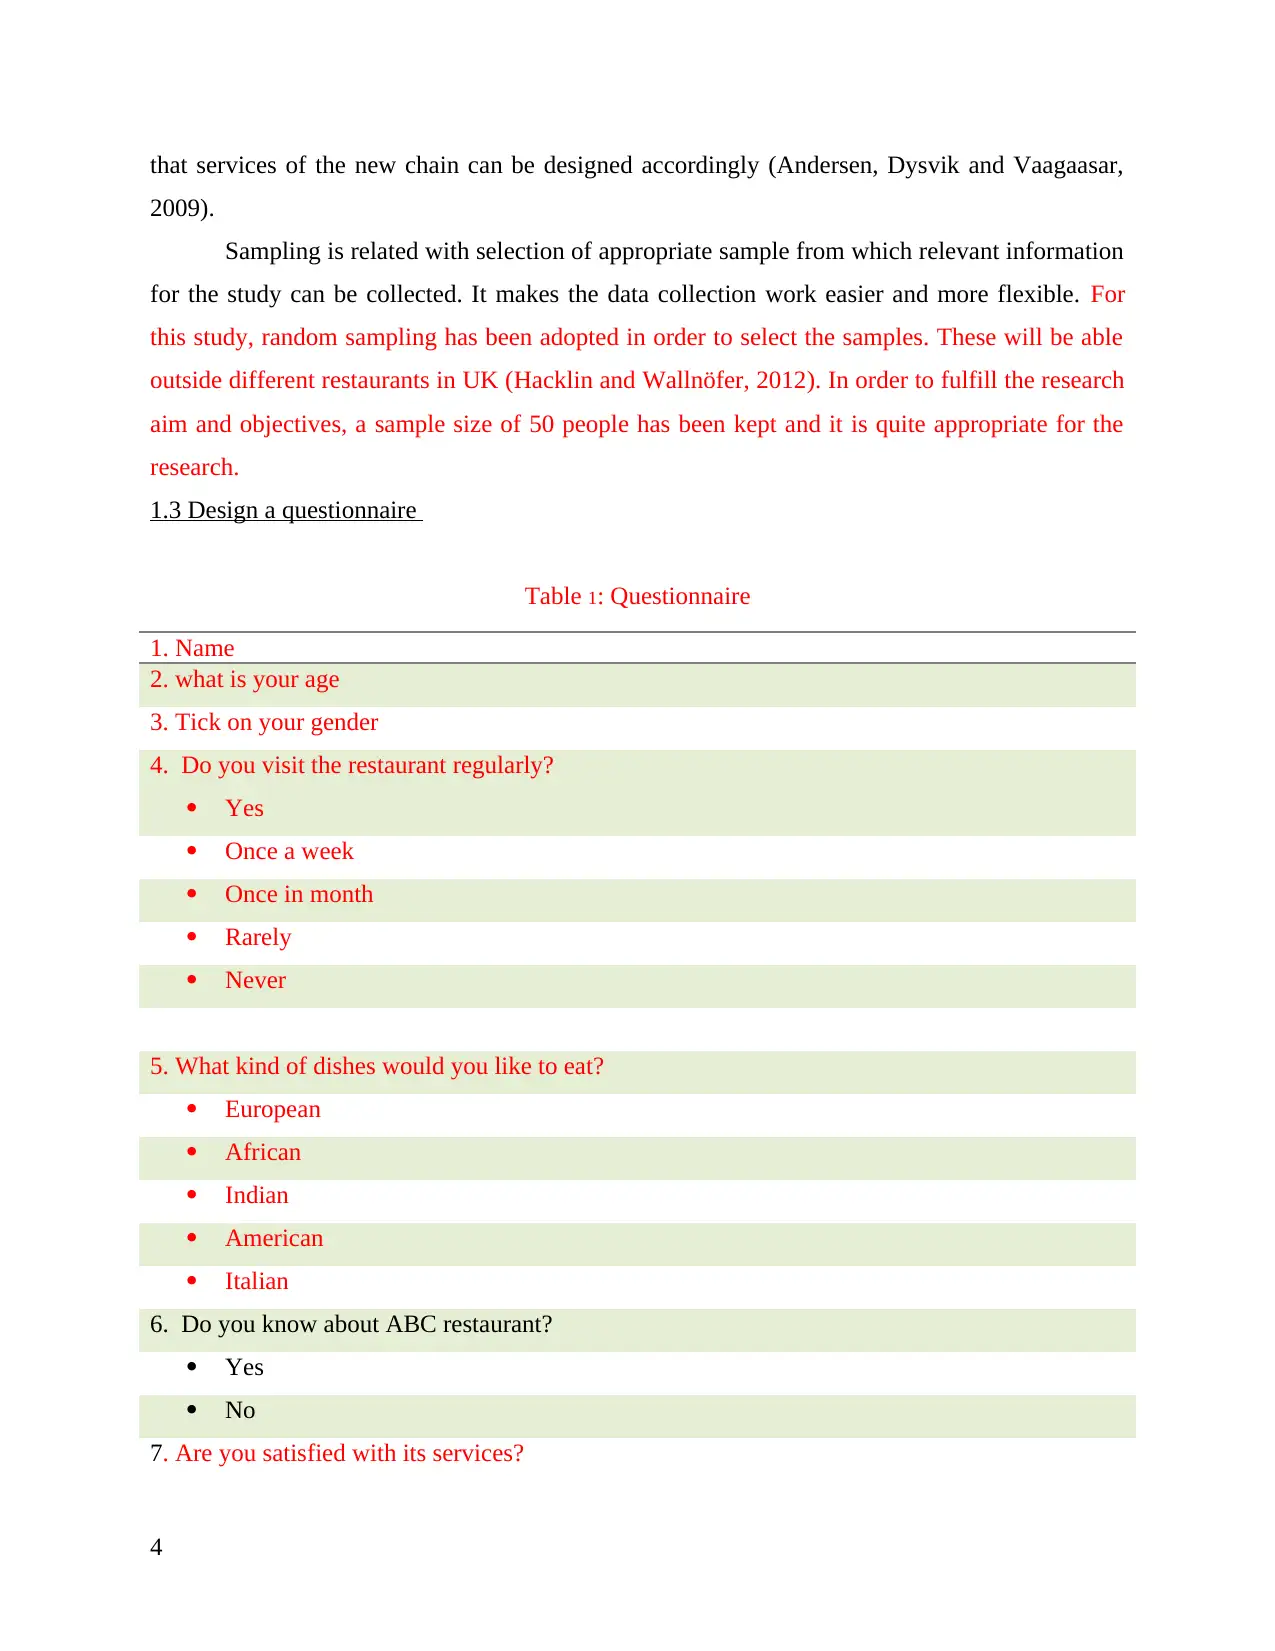
1.3 Design a questionnaire
Table 1: Questionnaire
1. Name
2. what is your age
3. Tick on your gender
4. Do you visit the restaurant regularly?
Yes
Once a week
Once in month
Rarely
Never
5. What kind of dishes would you like to eat?
European
African
Indian
American
Italian
6. Do you know about ABC restaurant?
Yes
No
7. Are you satisfied with its services?
4
2009).
Sampling is related with selection of appropriate sample from which relevant information
for the study can be collected. It makes the data collection work easier and more flexible. For
this study, random sampling has been adopted in order to select the samples. These will be able
outside different restaurants in UK (Hacklin and Wallnöfer, 2012). In order to fulfill the research
aim and objectives, a sample size of 50 people has been kept and it is quite appropriate for the
research.
1.3 Design a questionnaire
Table 1: Questionnaire
1. Name
2. what is your age
3. Tick on your gender
4. Do you visit the restaurant regularly?
Yes
Once a week
Once in month
Rarely
Never
5. What kind of dishes would you like to eat?
European
African
Indian
American
Italian
6. Do you know about ABC restaurant?
Yes
No
7. Are you satisfied with its services?
4
Paraphrase This Document
Need a fresh take? Get an instant paraphrase of this document with our AI Paraphraser
Yes
No
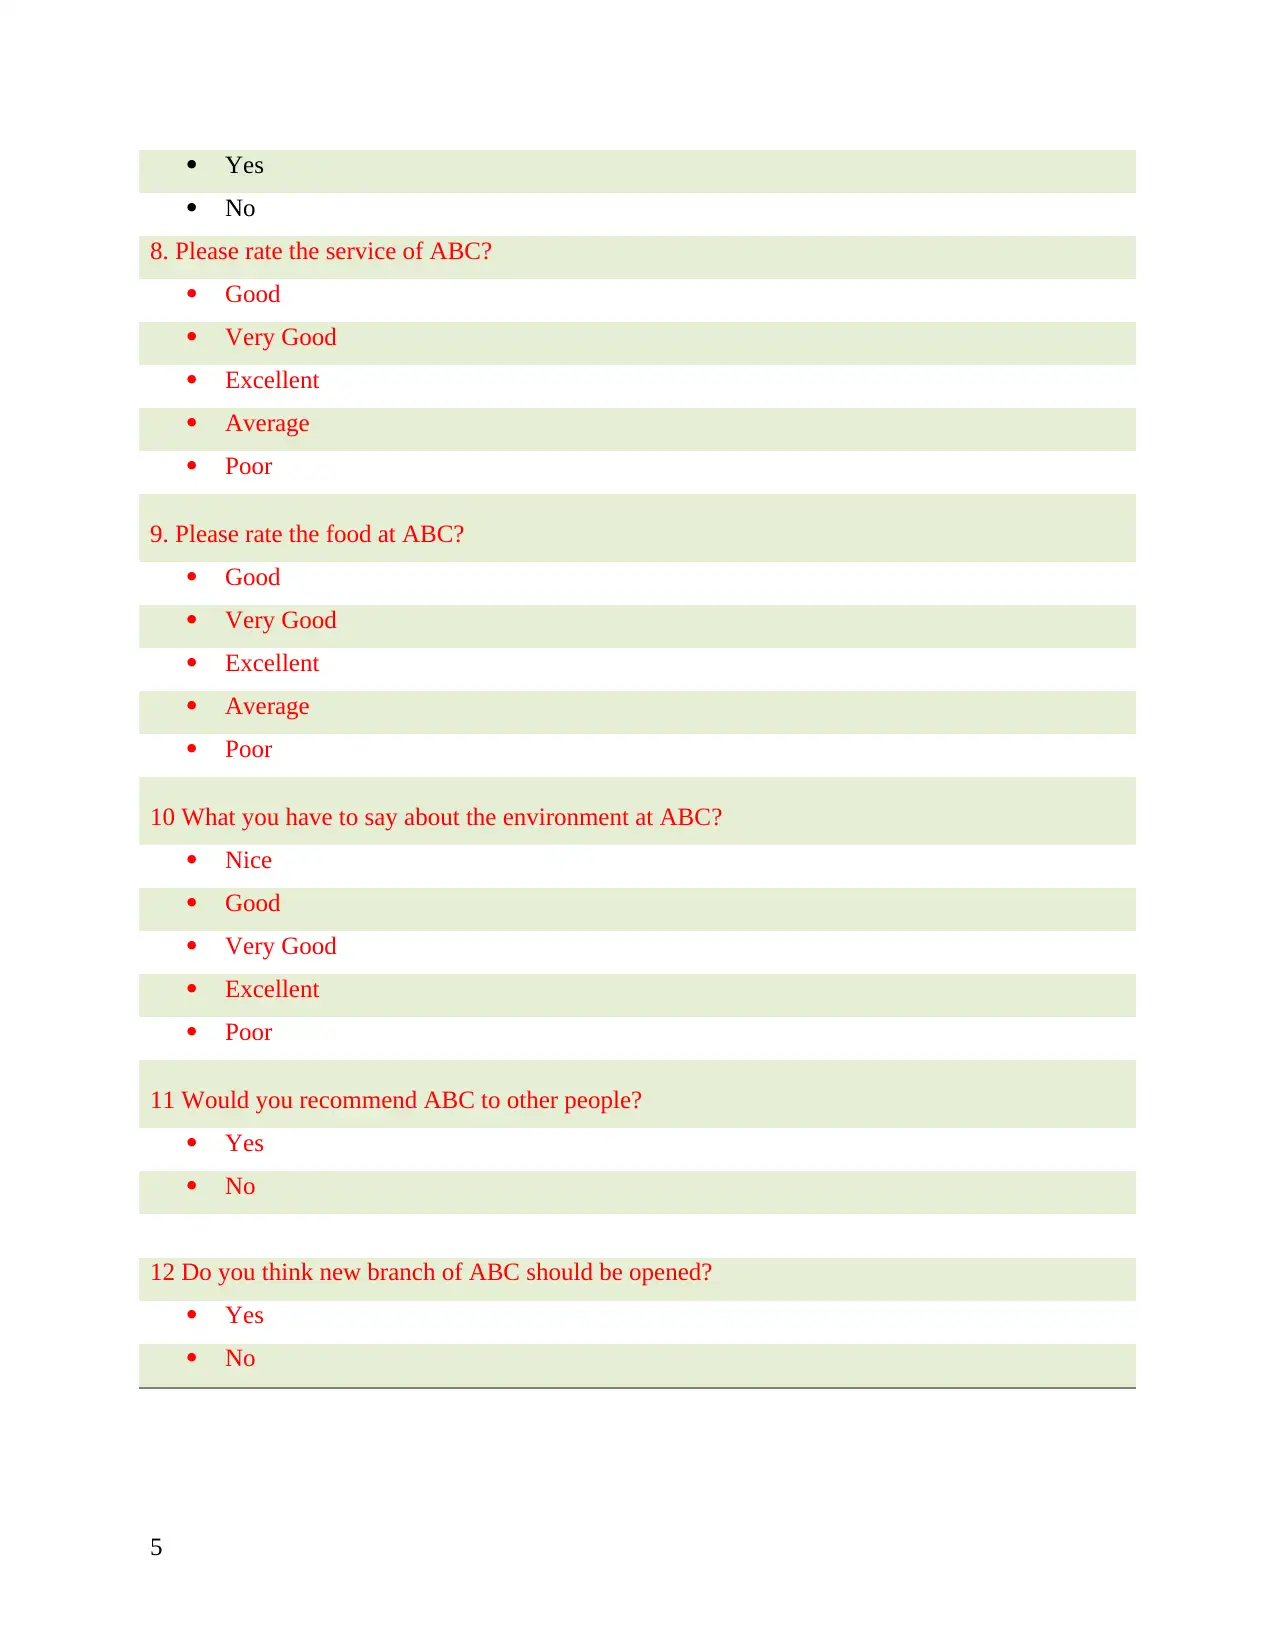
8. Please rate the service of ABC?
Good
Very Good
Excellent
Average
Poor
9. Please rate the food at ABC?
Good
Very Good
Excellent
Average
Poor
10 What you have to say about the environment at ABC?
Nice
Good
Very Good
Excellent
Poor
11 Would you recommend ABC to other people?
Yes
No
12 Do you think new branch of ABC should be opened?
Yes
No
5
No
8. Please rate the service of ABC?
Good
Very Good
Excellent
Average
Poor
9. Please rate the food at ABC?
Good
Very Good
Excellent
Average
Poor
10 What you have to say about the environment at ABC?
Nice
Good
Very Good
Excellent
Poor
11 Would you recommend ABC to other people?
Yes
No
12 Do you think new branch of ABC should be opened?
Yes
No
5
LO 2 Range of techniques to analyze data effectively for business purposes
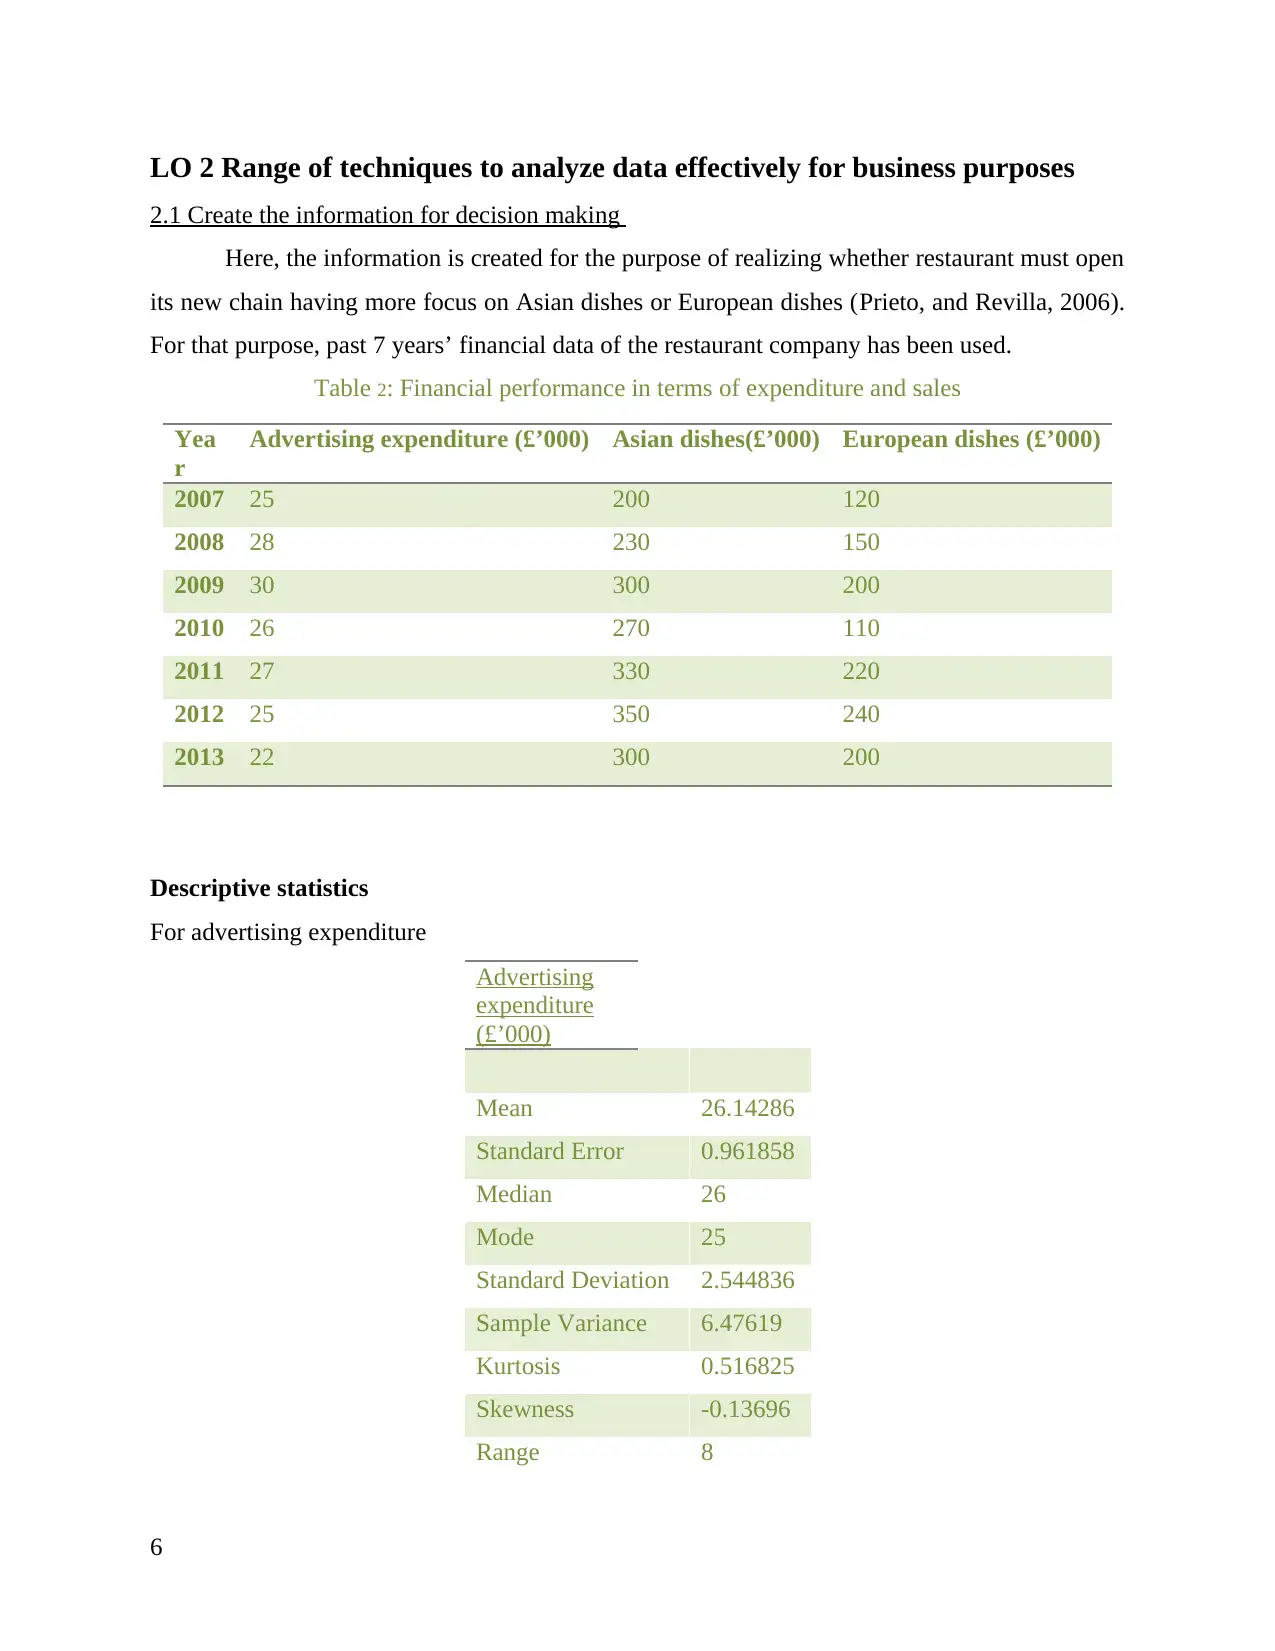
2.1 Create the information for decision making
Here, the information is created for the purpose of realizing whether restaurant must open
its new chain having more focus on Asian dishes or European dishes (Prieto, and Revilla, 2006).
For that purpose, past 7 years’ financial data of the restaurant company has been used.
Table 2: Financial performance in terms of expenditure and sales
Yea
r
Advertising expenditure (£’000) Asian dishes(£’000) European dishes (£’000)
2007 25 200 120
2008 28 230 150
2009 30 300 200
2010 26 270 110
2011 27 330 220
2012 25 350 240
2013 22 300 200
Descriptive statistics
For advertising expenditure
Advertising
expenditure
(£’000)
Mean 26.14286
Standard Error 0.961858
Median 26
Mode 25
Standard Deviation 2.544836
Sample Variance 6.47619
Kurtosis 0.516825
Skewness -0.13696
Range 8
6
⊘ This is a preview!⊘
Do you want full access?
Subscribe today to unlock all pages.
Trusted by 1+ million students worldwide
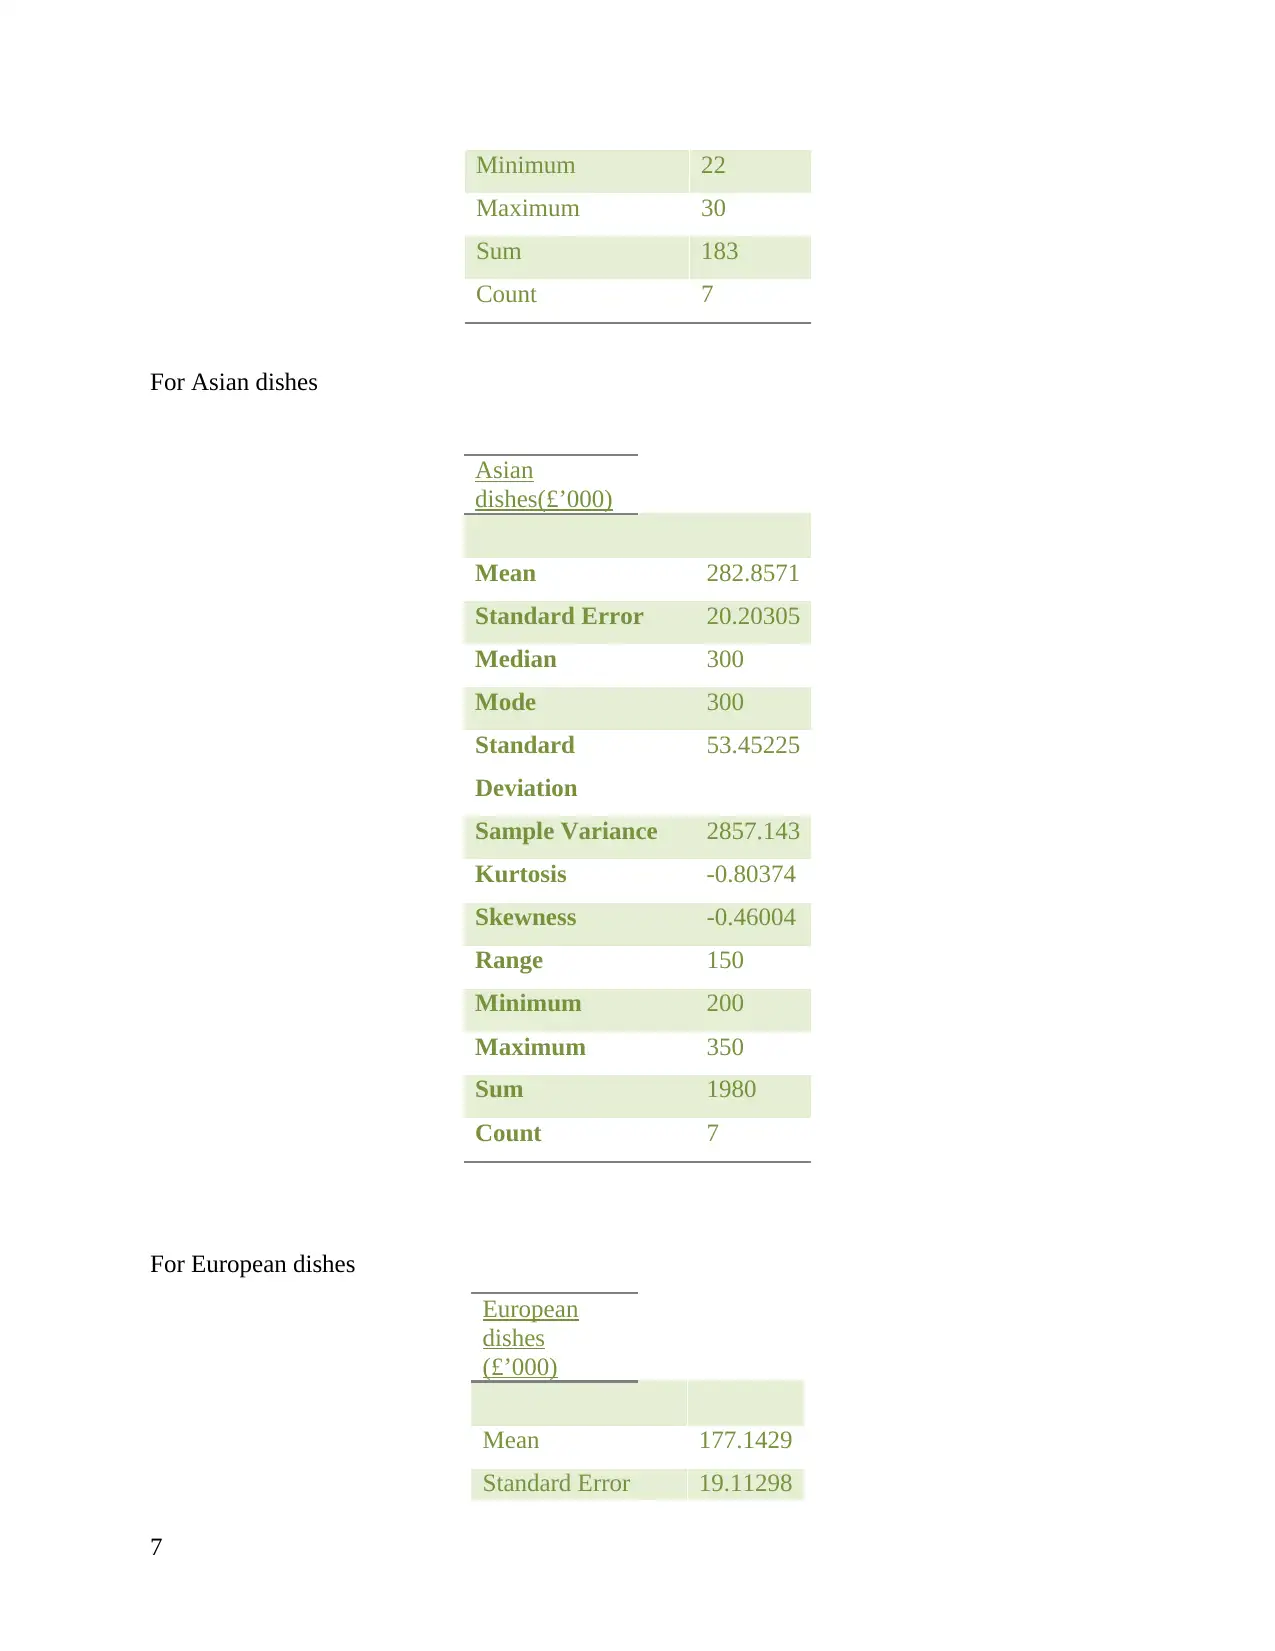
Minimum 22
Maximum 30
Sum 183
Count 7
For Asian dishes
Asian
dishes(£’000)
Mean 282.8571
Standard Error 20.20305
Median 300
Mode 300
Standard
Deviation
53.45225
Sample Variance 2857.143
Kurtosis -0.80374
Skewness -0.46004
Range 150
Minimum 200
Maximum 350
Sum 1980
Count 7
For European dishes
European
dishes
(£’000)
Mean 177.1429
Standard Error 19.11298
7
Paraphrase This Document
Need a fresh take? Get an instant paraphrase of this document with our AI Paraphraser
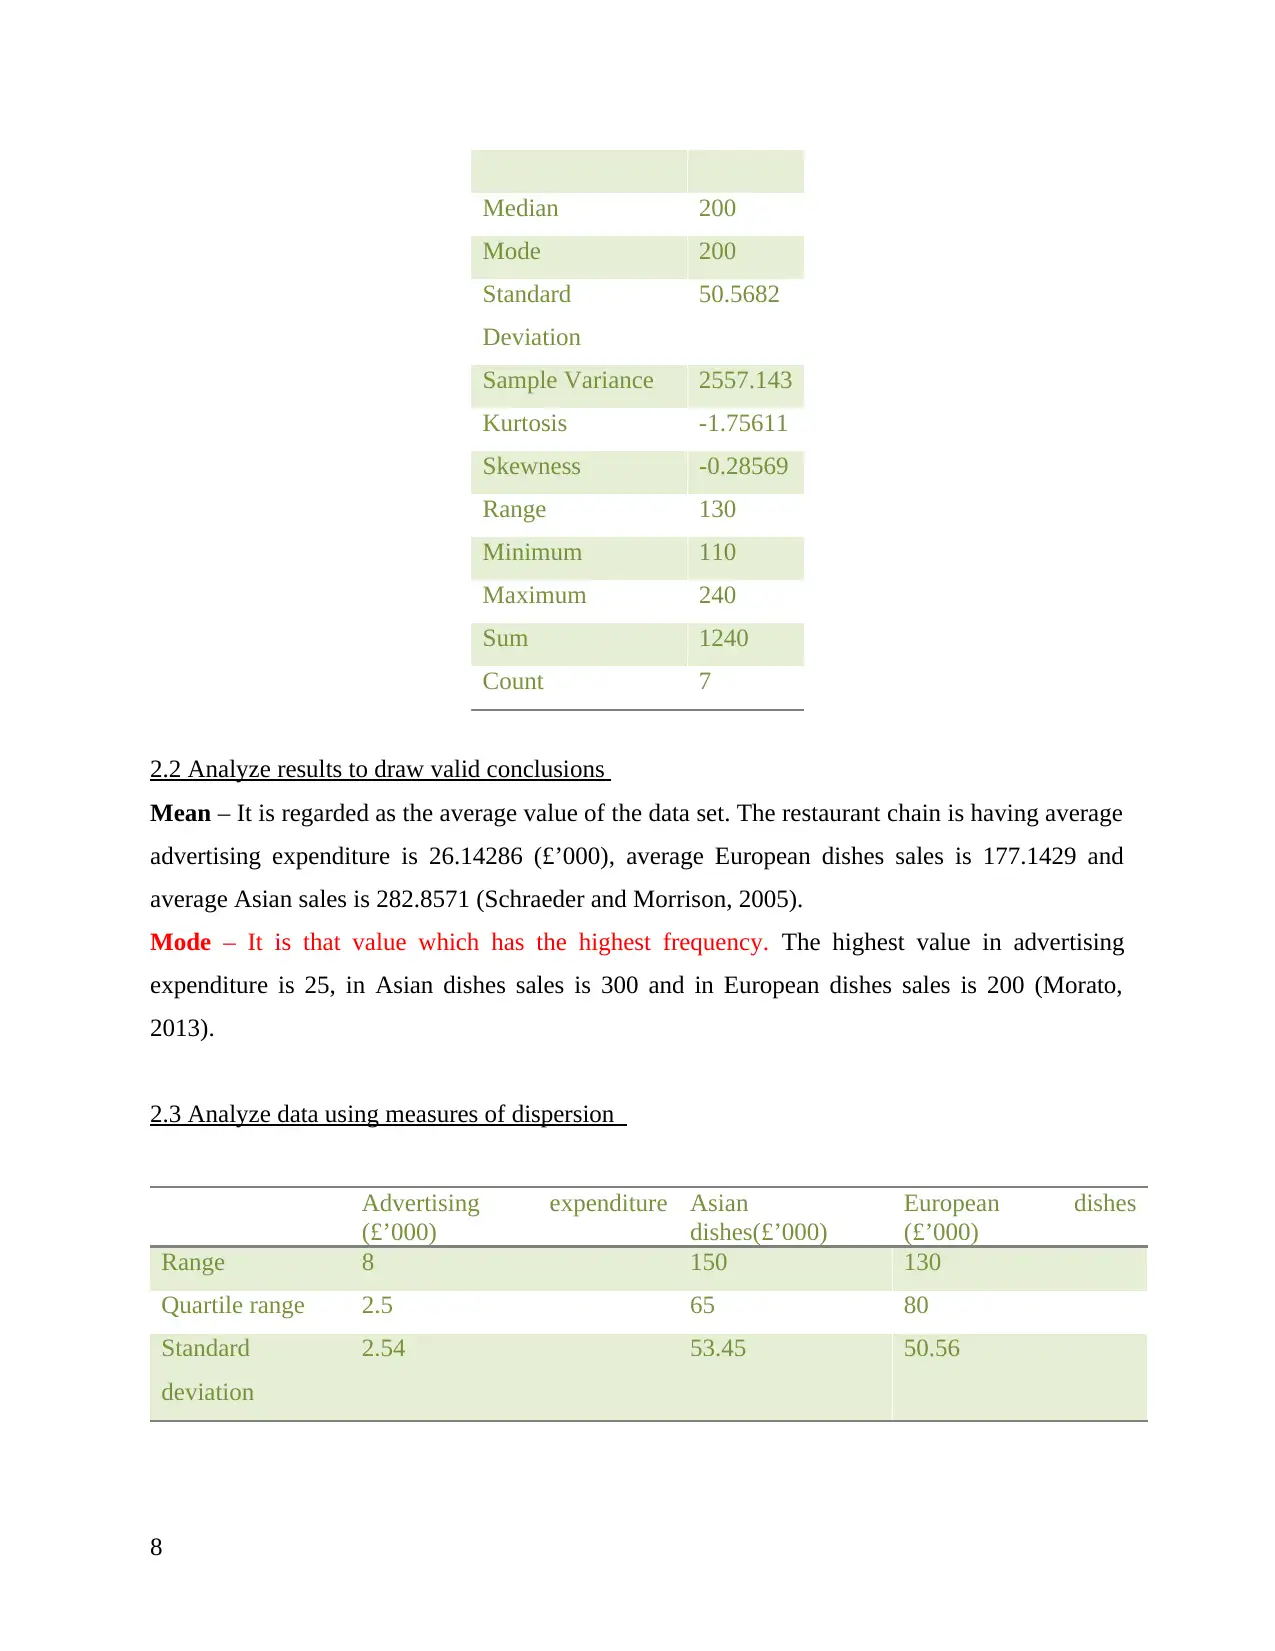
Median 200
Mode 200
Standard
Deviation
50.5682
Sample Variance 2557.143
Kurtosis -1.75611
Skewness -0.28569
Range 130
Minimum 110
Maximum 240
Sum 1240
Count 7
2.2 Analyze results to draw valid conclusions
Mean – It is regarded as the average value of the data set. The restaurant chain is having average
advertising expenditure is 26.14286 (£’000), average European dishes sales is 177.1429 and
average Asian sales is 282.8571 (Schraeder and Morrison, 2005).
Mode – It is that value which has the highest frequency. The highest value in advertising
expenditure is 25, in Asian dishes sales is 300 and in European dishes sales is 200 (Morato,
2013).
2.3 Analyze data using measures of dispersion
Advertising expenditure
(£’000)
Asian
dishes(£’000)
European dishes
(£’000)
Range 8 150 130
Quartile range 2.5 65 80
Standard
deviation
2.54 53.45 50.56
8
Range – Difference between the highest and lowest number is range. The range value for
advertising expenditure is 8, for Asian dishes it is 150 and for European dishes is 130.
(Newbold, and et. al., 2009). The value of range for advertising expenditure shows that
the expenditure is not highly spread out. While the range for Asian and European dishes
shows that sales for both the dishes are highly spread out in the data set. Quartile range – It divides the quartile into four confined intervals. (Day, 2005). The
quartile range for advertising expenditure is 2.5, for Asian dishes its 65 and for European
dishes, it is 80. The quartile range for advertising expenditure shows that less than half of
the expenditure is dispersed. For Asian dishes it shows that more than 50% of the sales
are dispersed and for European dishes it shows that near to 100% of the sales are
dispersed
Standard deviation – It is a measure used to quantify the amount of variation or
dispersion of a set of data values. The standard deviation for advertising expenditure is
2.54, for Asian dishes it is 53.45 and for European dishes is 50.56. (Graff, 2003)
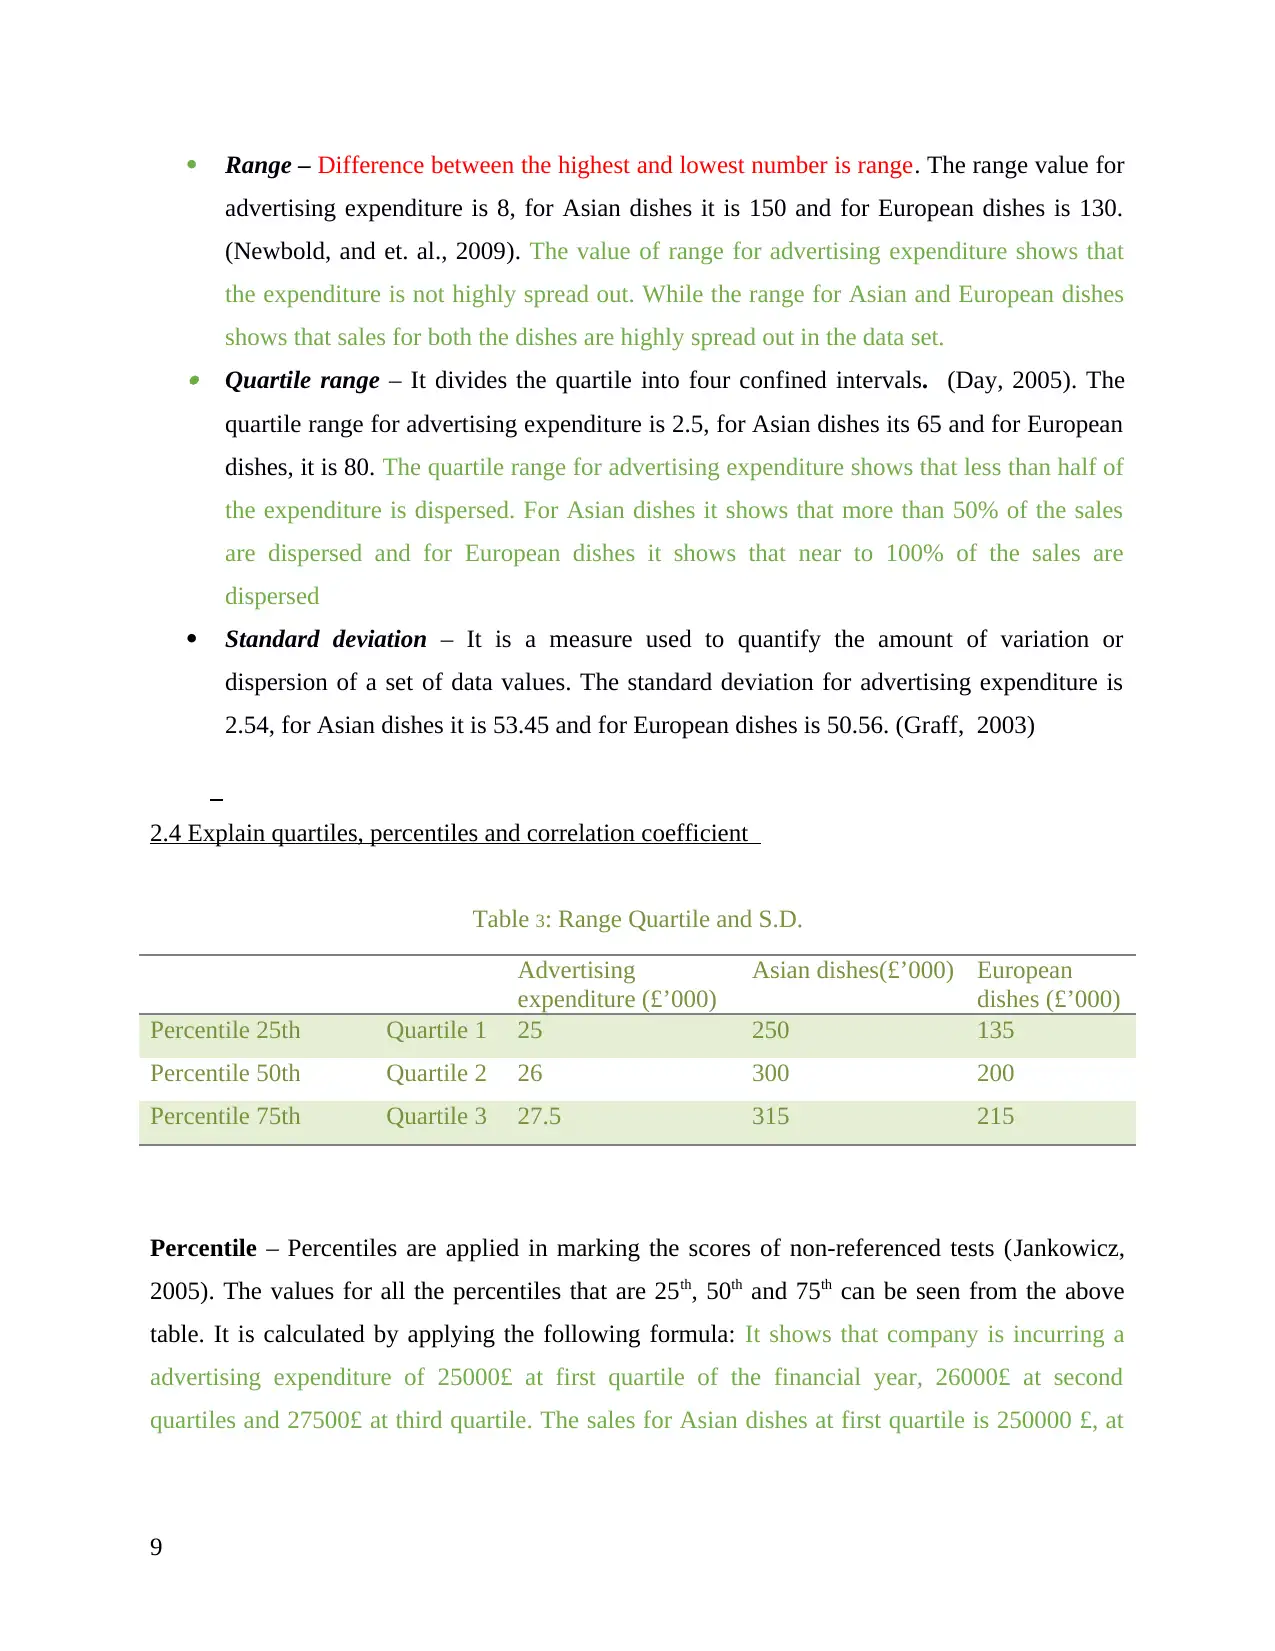
2.4 Explain quartiles, percentiles and correlation coefficient
Table 3: Range Quartile and S.D.
Advertising
expenditure (£’000)
Asian dishes(£’000) European
dishes (£’000)
Percentile 25th Quartile 1 25 250 135
Percentile 50th Quartile 2 26 300 200
Percentile 75th Quartile 3 27.5 315 215
Percentile – Percentiles are applied in marking the scores of non-referenced tests (Jankowicz,
2005). The values for all the percentiles that are 25th, 50th and 75th can be seen from the above
table. It is calculated by applying the following formula: It shows that company is incurring a
advertising expenditure of 25000£ at first quartile of the financial year, 26000£ at second
quartiles and 27500£ at third quartile. The sales for Asian dishes at first quartile is 250000 £, at
9
advertising expenditure is 8, for Asian dishes it is 150 and for European dishes is 130.
(Newbold, and et. al., 2009). The value of range for advertising expenditure shows that
the expenditure is not highly spread out. While the range for Asian and European dishes
shows that sales for both the dishes are highly spread out in the data set. Quartile range – It divides the quartile into four confined intervals. (Day, 2005). The
quartile range for advertising expenditure is 2.5, for Asian dishes its 65 and for European
dishes, it is 80. The quartile range for advertising expenditure shows that less than half of
the expenditure is dispersed. For Asian dishes it shows that more than 50% of the sales
are dispersed and for European dishes it shows that near to 100% of the sales are
dispersed
Standard deviation – It is a measure used to quantify the amount of variation or
dispersion of a set of data values. The standard deviation for advertising expenditure is
2.54, for Asian dishes it is 53.45 and for European dishes is 50.56. (Graff, 2003)
2.4 Explain quartiles, percentiles and correlation coefficient
Table 3: Range Quartile and S.D.
Advertising
expenditure (£’000)
Asian dishes(£’000) European
dishes (£’000)
Percentile 25th Quartile 1 25 250 135
Percentile 50th Quartile 2 26 300 200
Percentile 75th Quartile 3 27.5 315 215
Percentile – Percentiles are applied in marking the scores of non-referenced tests (Jankowicz,
2005). The values for all the percentiles that are 25th, 50th and 75th can be seen from the above
table. It is calculated by applying the following formula: It shows that company is incurring a
advertising expenditure of 25000£ at first quartile of the financial year, 26000£ at second
quartiles and 27500£ at third quartile. The sales for Asian dishes at first quartile is 250000 £, at
9
⊘ This is a preview!⊘
Do you want full access?
Subscribe today to unlock all pages.
Trusted by 1+ million students worldwide
second quartile it is 300000£ and at third quartile it is 315000£. The sales for European dishes at
first quartile is 135£, at second quartile is 200000£ and at third quartile is 215000£.
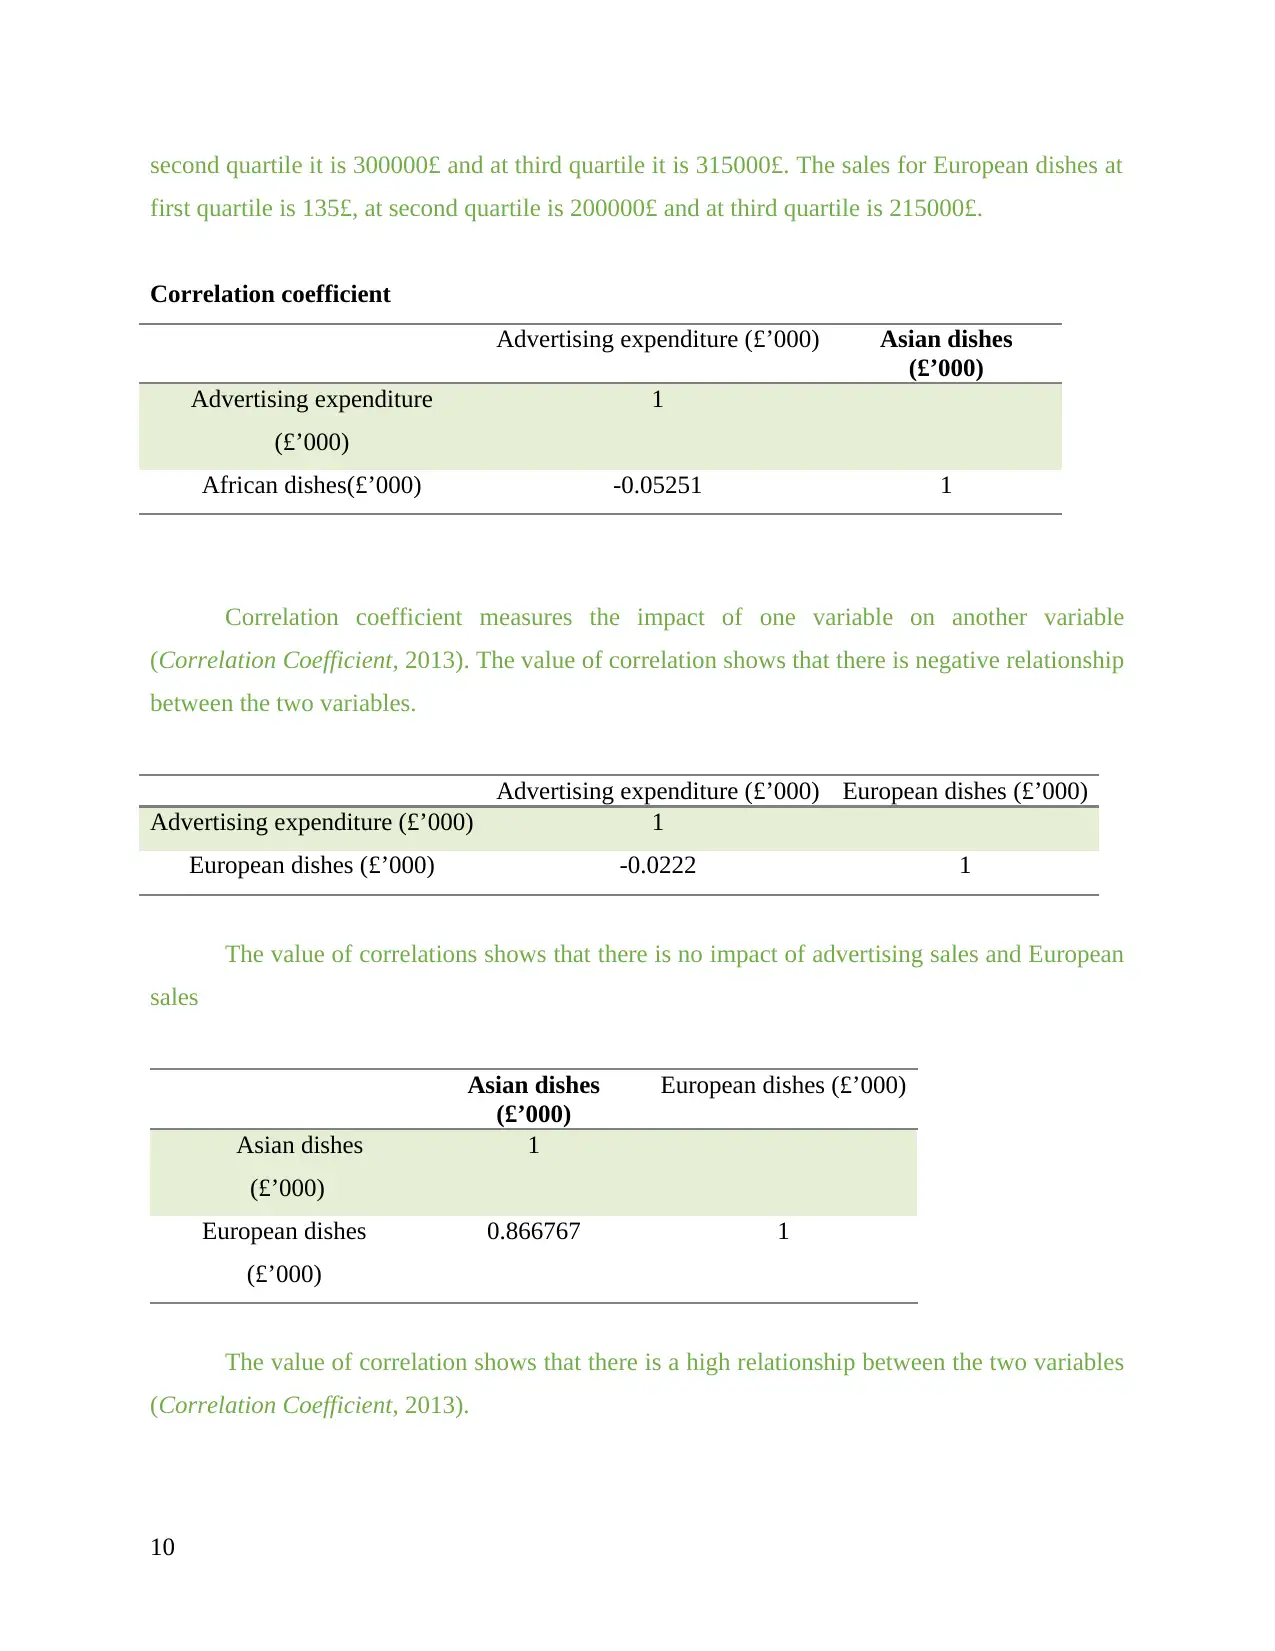
Correlation coefficient
Advertising expenditure (£’000) Asian dishes
(£’000)
Advertising expenditure
(£’000)
1
African dishes(£’000) -0.05251 1
Correlation coefficient measures the impact of one variable on another variable
(Correlation Coefficient, 2013). The value of correlation shows that there is negative relationship
between the two variables.
Advertising expenditure (£’000) European dishes (£’000)
Advertising expenditure (£’000) 1
European dishes (£’000) -0.0222 1
The value of correlations shows that there is no impact of advertising sales and European
sales
Asian dishes
(£’000)
European dishes (£’000)
Asian dishes
(£’000)
1
European dishes
(£’000)
0.866767 1
The value of correlation shows that there is a high relationship between the two variables
(Correlation Coefficient, 2013).
10
first quartile is 135£, at second quartile is 200000£ and at third quartile is 215000£.
Correlation coefficient
Advertising expenditure (£’000) Asian dishes
(£’000)
Advertising expenditure
(£’000)
1
African dishes(£’000) -0.05251 1
Correlation coefficient measures the impact of one variable on another variable
(Correlation Coefficient, 2013). The value of correlation shows that there is negative relationship
between the two variables.
Advertising expenditure (£’000) European dishes (£’000)
Advertising expenditure (£’000) 1
European dishes (£’000) -0.0222 1
The value of correlations shows that there is no impact of advertising sales and European
sales
Asian dishes
(£’000)
European dishes (£’000)
Asian dishes
(£’000)
1
European dishes
(£’000)
0.866767 1
The value of correlation shows that there is a high relationship between the two variables
(Correlation Coefficient, 2013).
10
Paraphrase This Document
Need a fresh take? Get an instant paraphrase of this document with our AI Paraphraser
LO 3 Produce information in appropriate formats for decision making
3.1 Graphs through spreadsheets
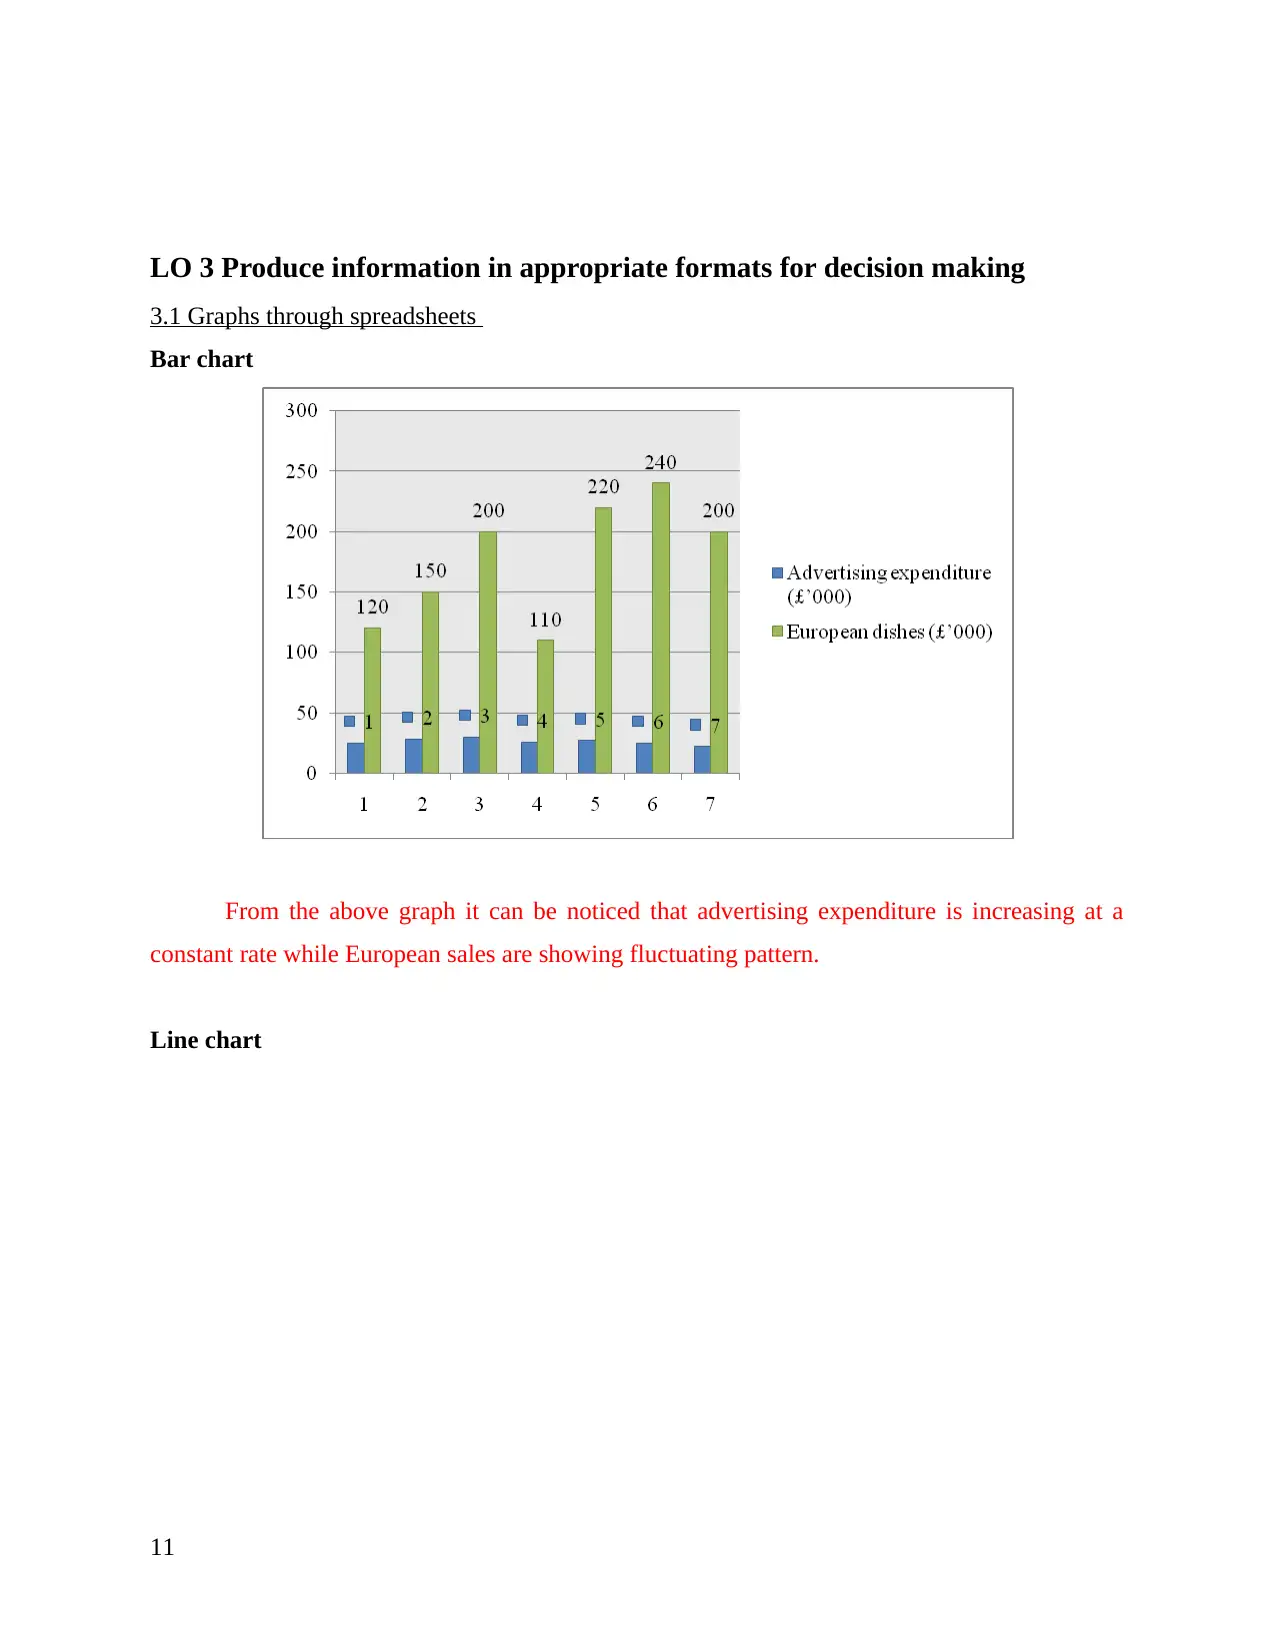
Bar chart
From the above graph it can be noticed that advertising expenditure is increasing at a
constant rate while European sales are showing fluctuating pattern.
Line chart
11
3.1 Graphs through spreadsheets
Bar chart
From the above graph it can be noticed that advertising expenditure is increasing at a
constant rate while European sales are showing fluctuating pattern.
Line chart
11
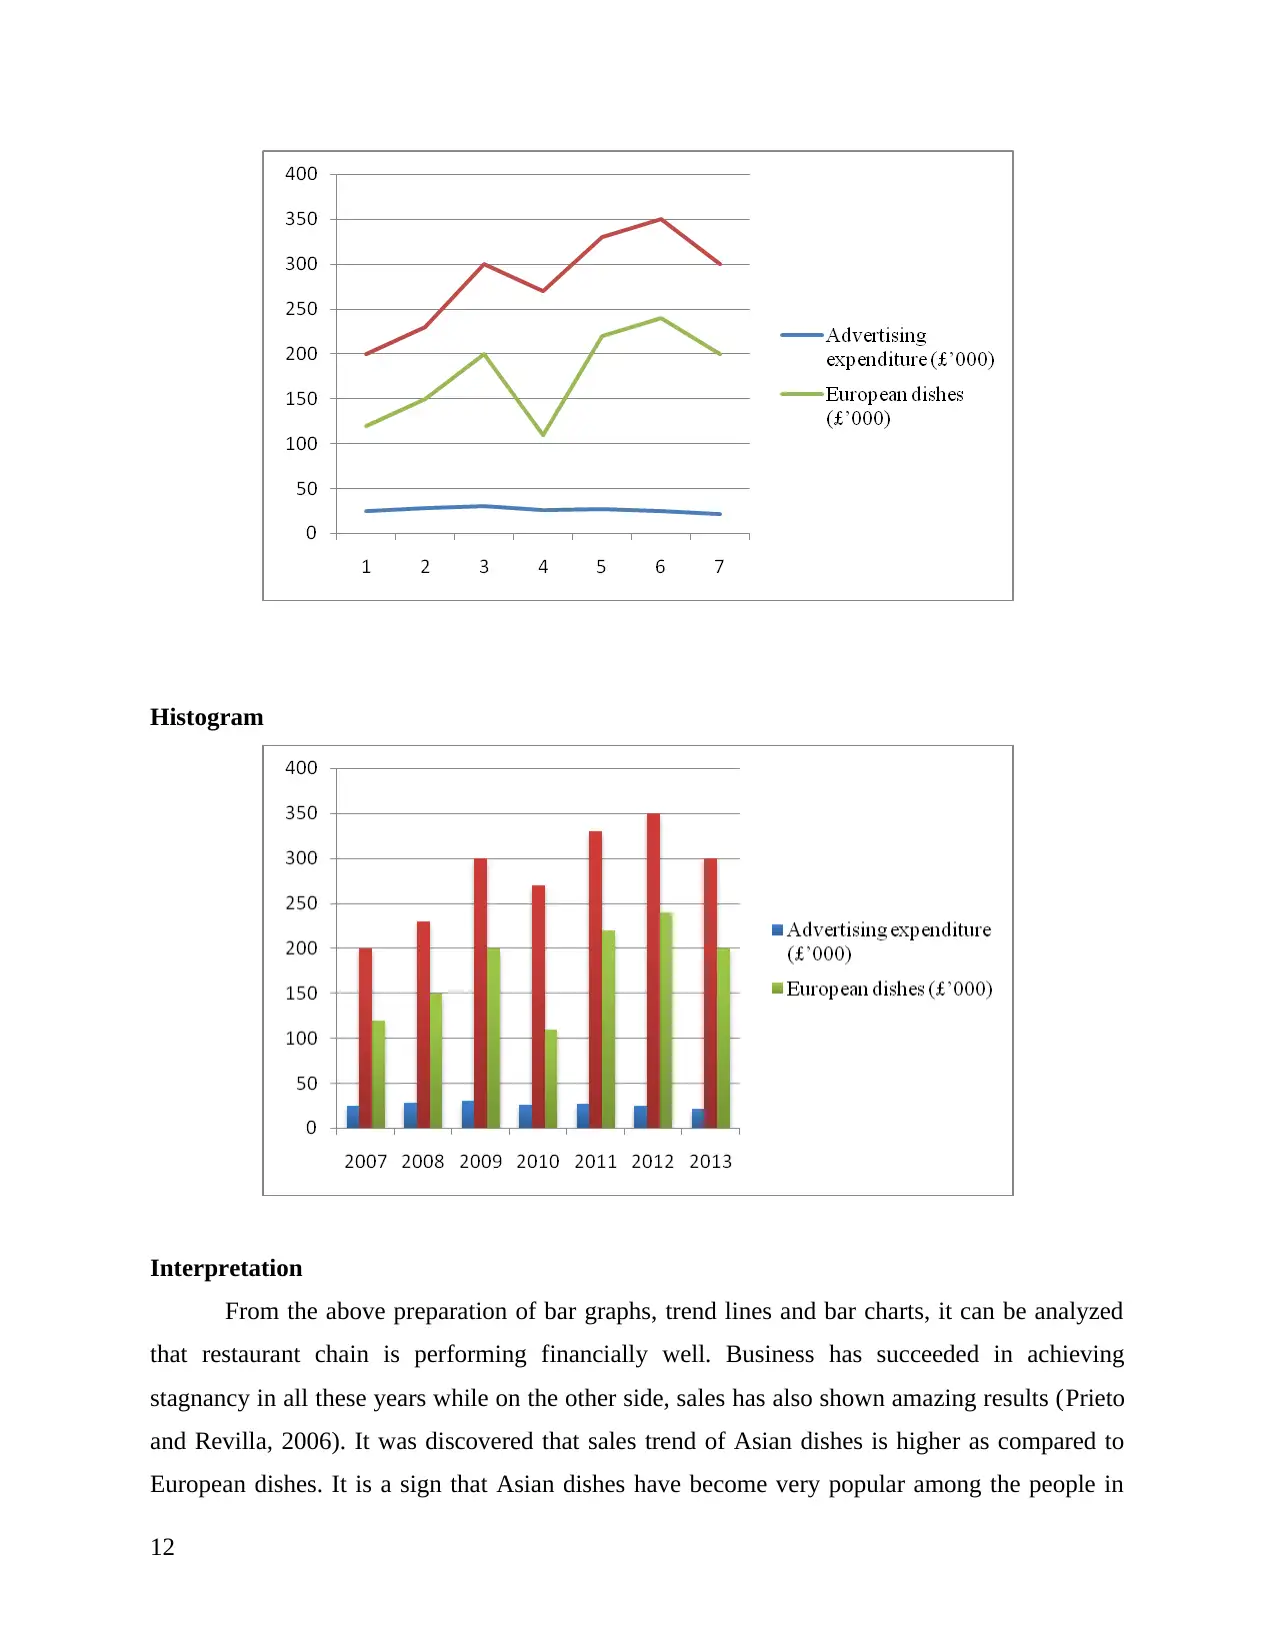
Histogram
Interpretation
From the above preparation of bar graphs, trend lines and bar charts, it can be analyzed
that restaurant chain is performing financially well. Business has succeeded in achieving
stagnancy in all these years while on the other side, sales has also shown amazing results (Prieto
and Revilla, 2006). It was discovered that sales trend of Asian dishes is higher as compared to
European dishes. It is a sign that Asian dishes have become very popular among the people in
12
⊘ This is a preview!⊘
Do you want full access?
Subscribe today to unlock all pages.
Trusted by 1+ million students worldwide
1 out of 23
Related Documents


Your All-in-One AI-Powered Toolkit for Academic Success.
+13062052269
info@desklib.com
Available 24*7 on WhatsApp / Email
![[object Object]](/_next/static/media/star-bottom.7253800d.svg)
Unlock your academic potential
Copyright © 2020–2026 A2Z Services. All Rights Reserved. Developed and managed by ZUCOL.