Business Decision Making (AC 3.3): Sales and Profit Analysis Report

Verified

Added on  2023/04/21

|11
|684
|214
Report
AI Summary
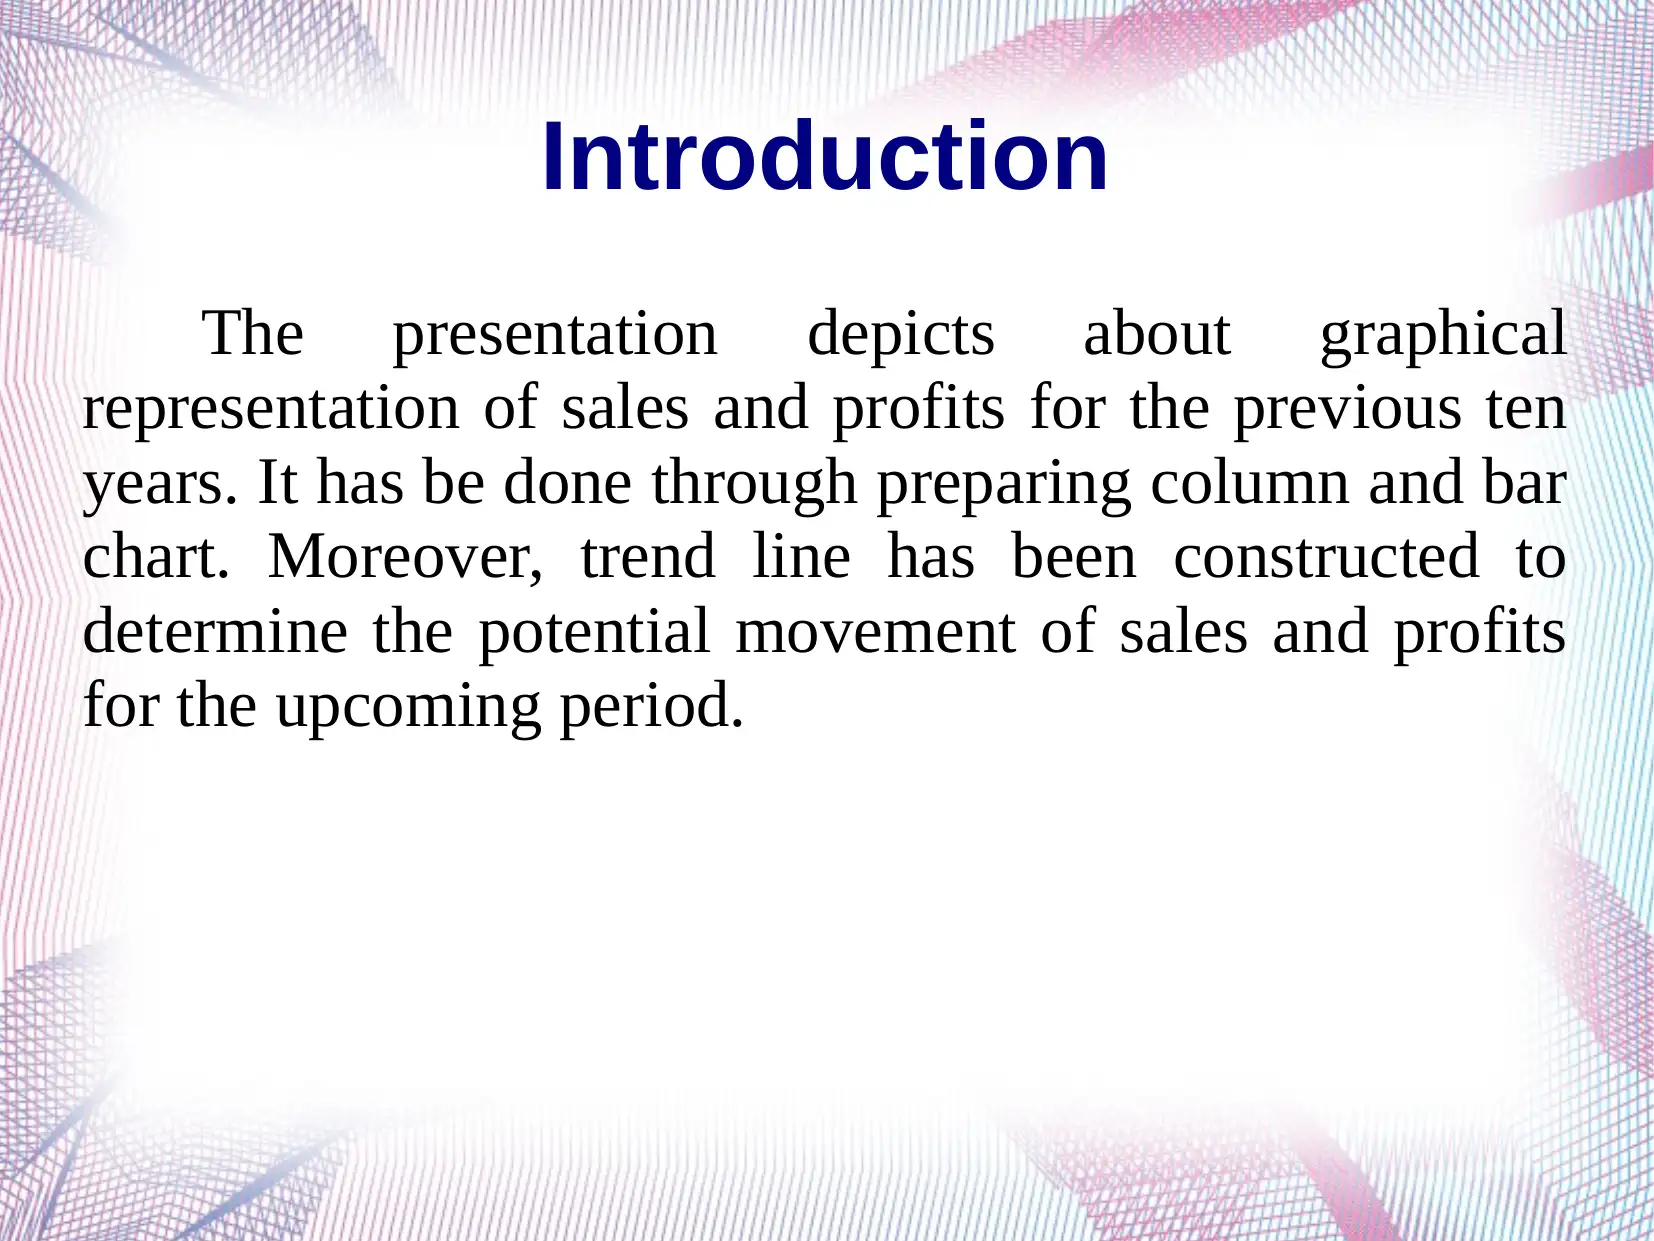
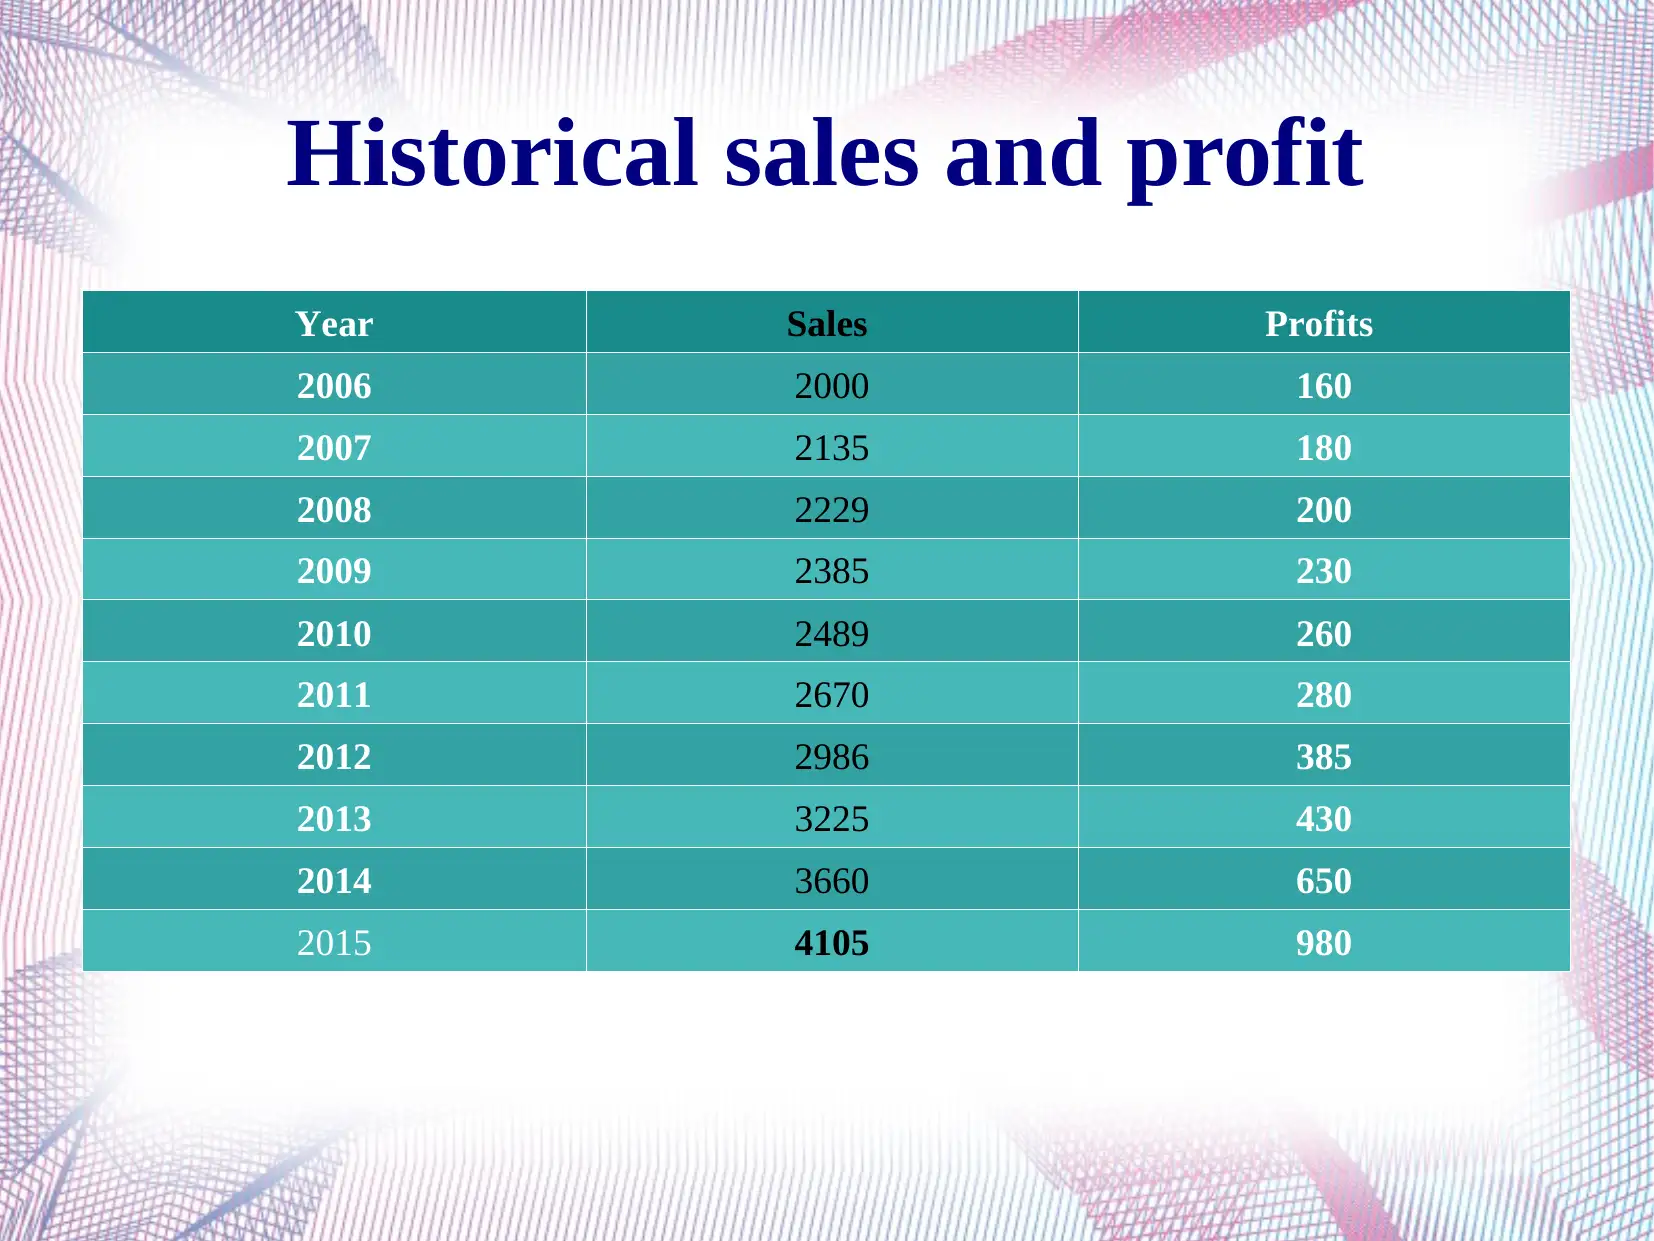
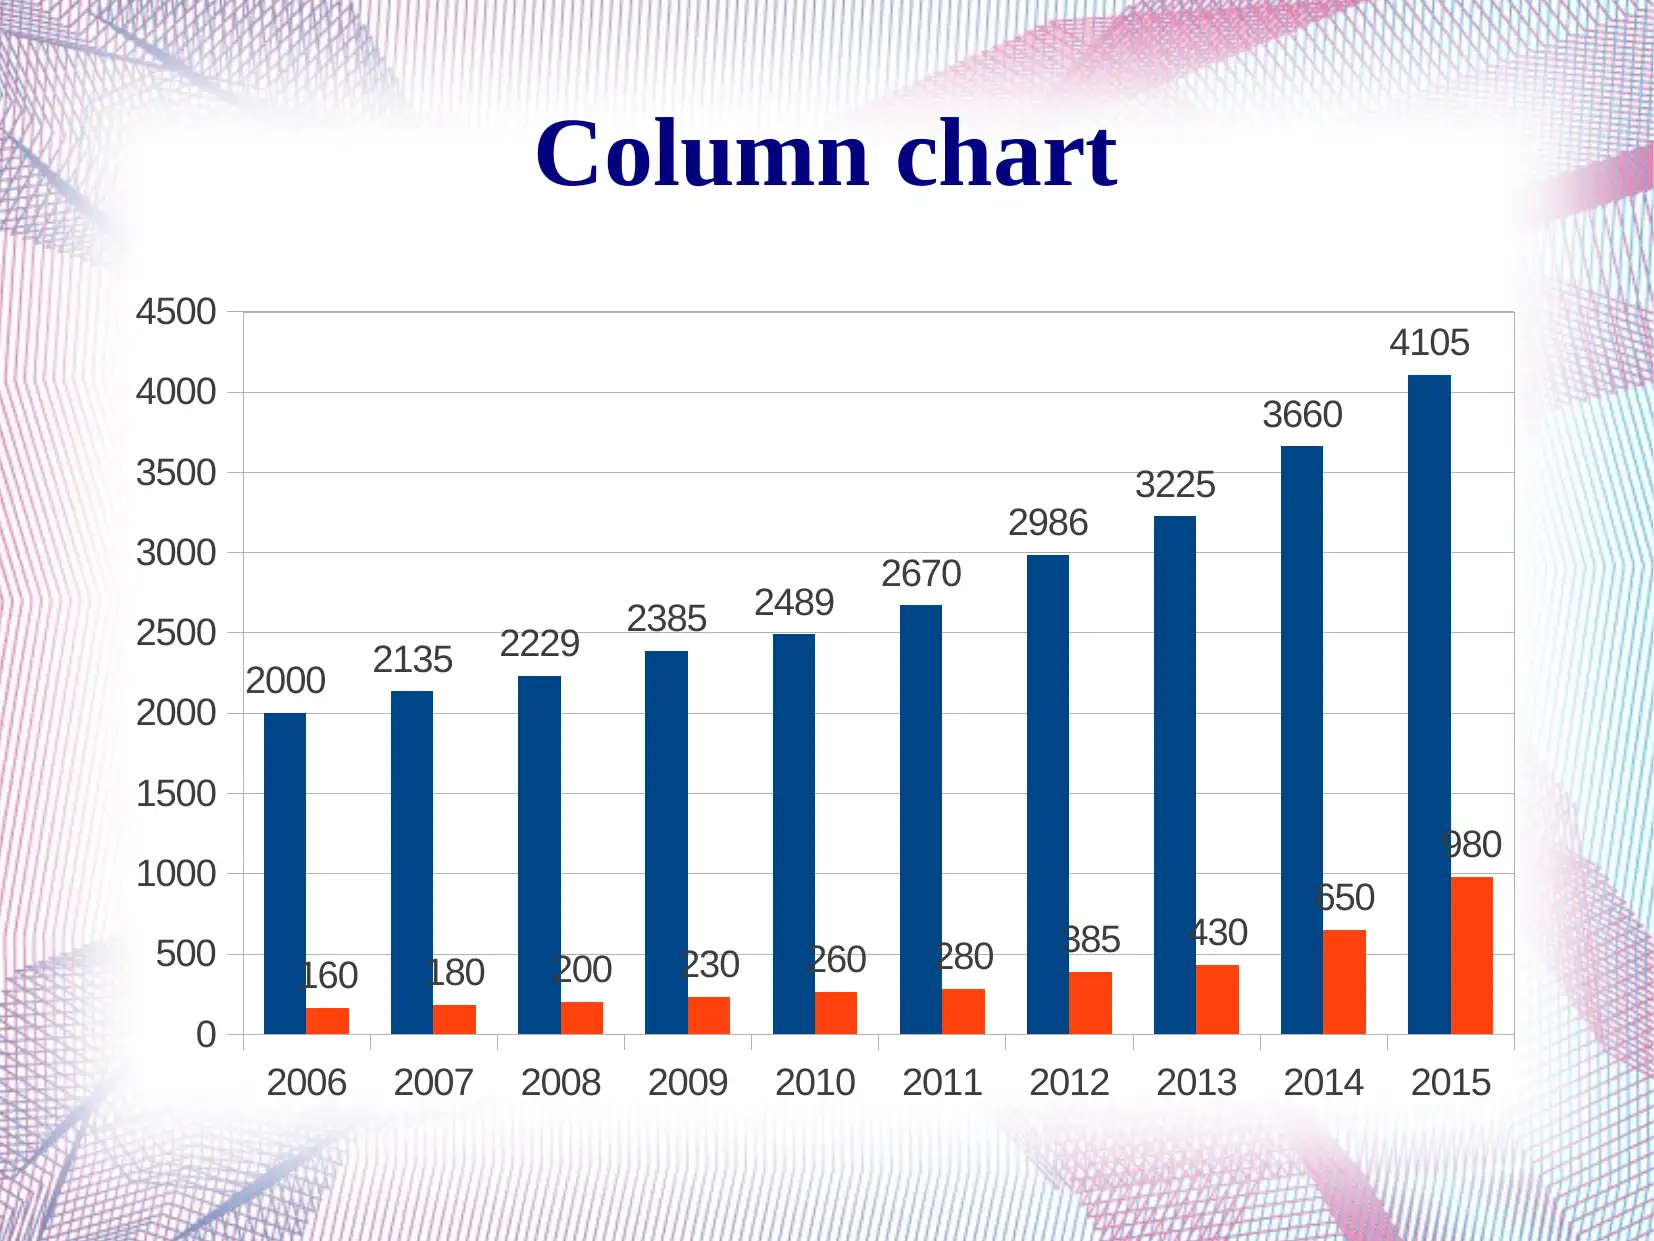
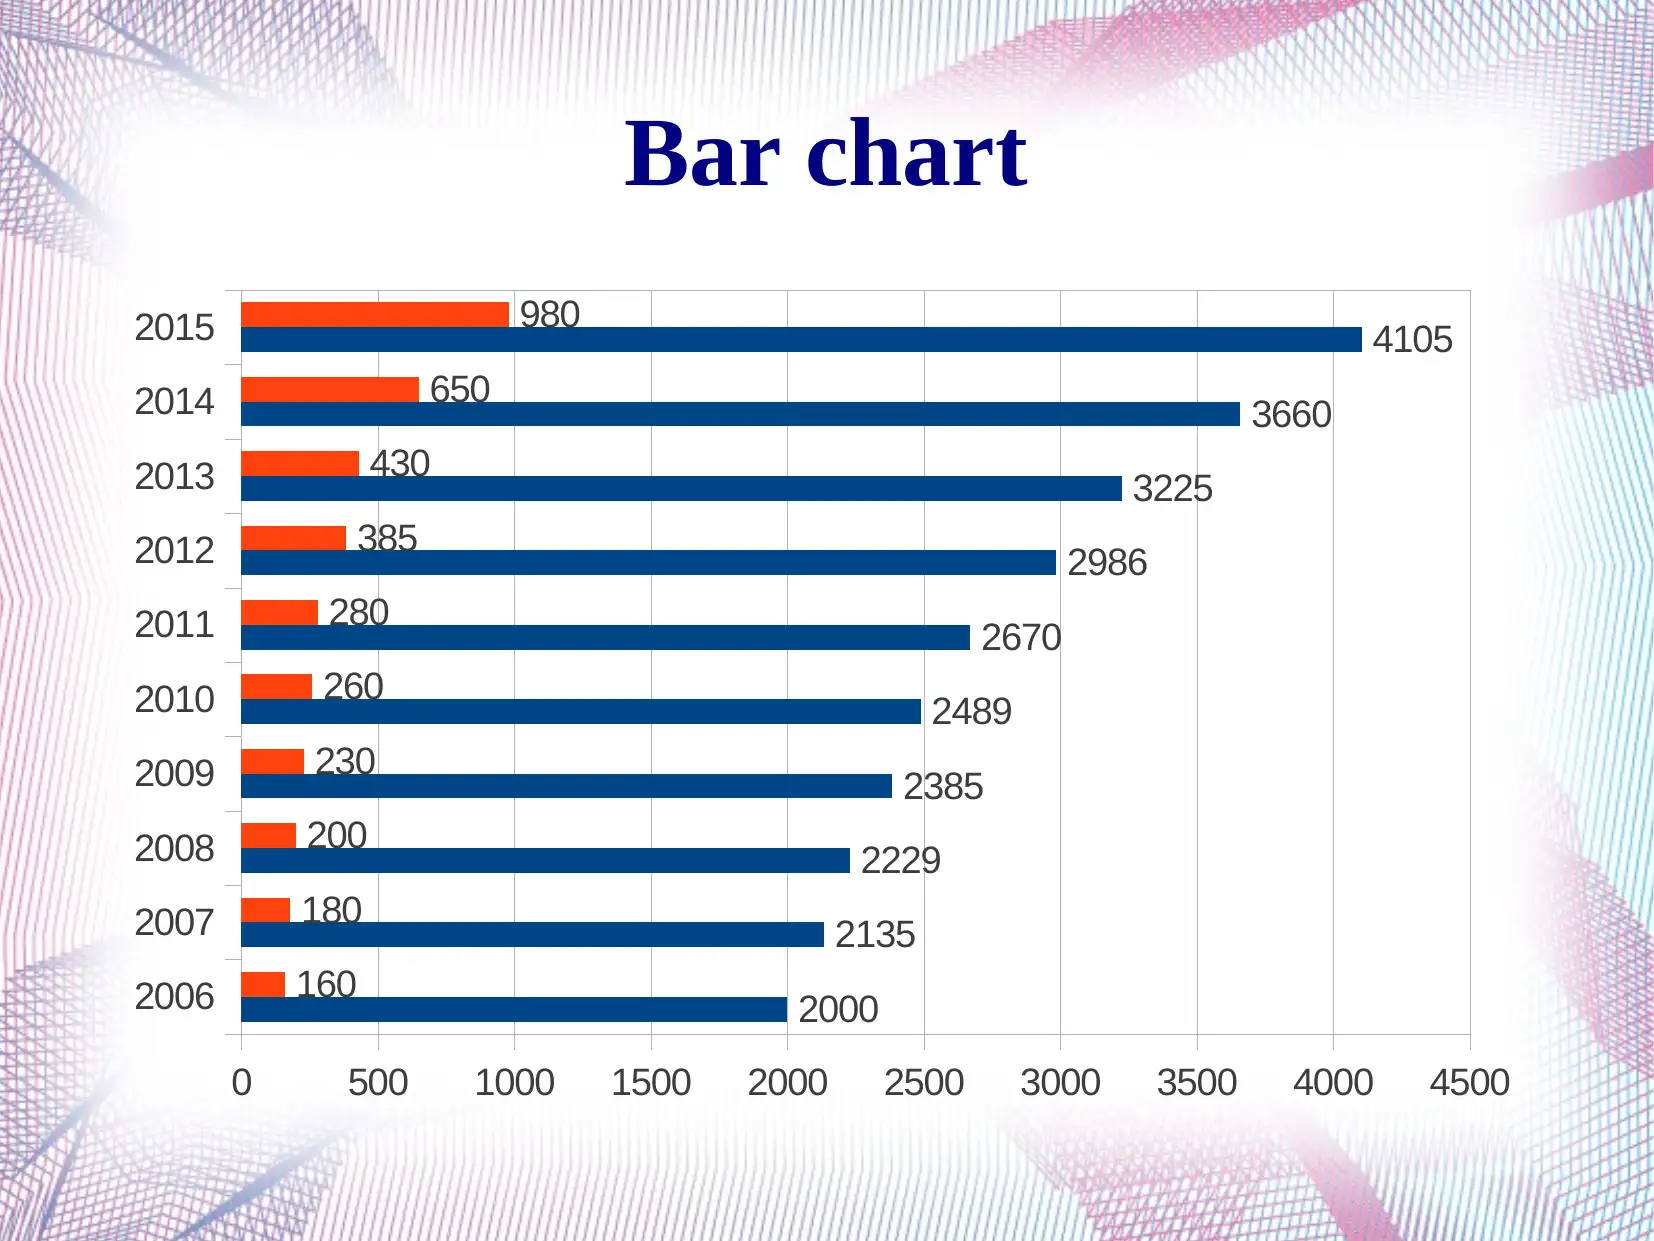
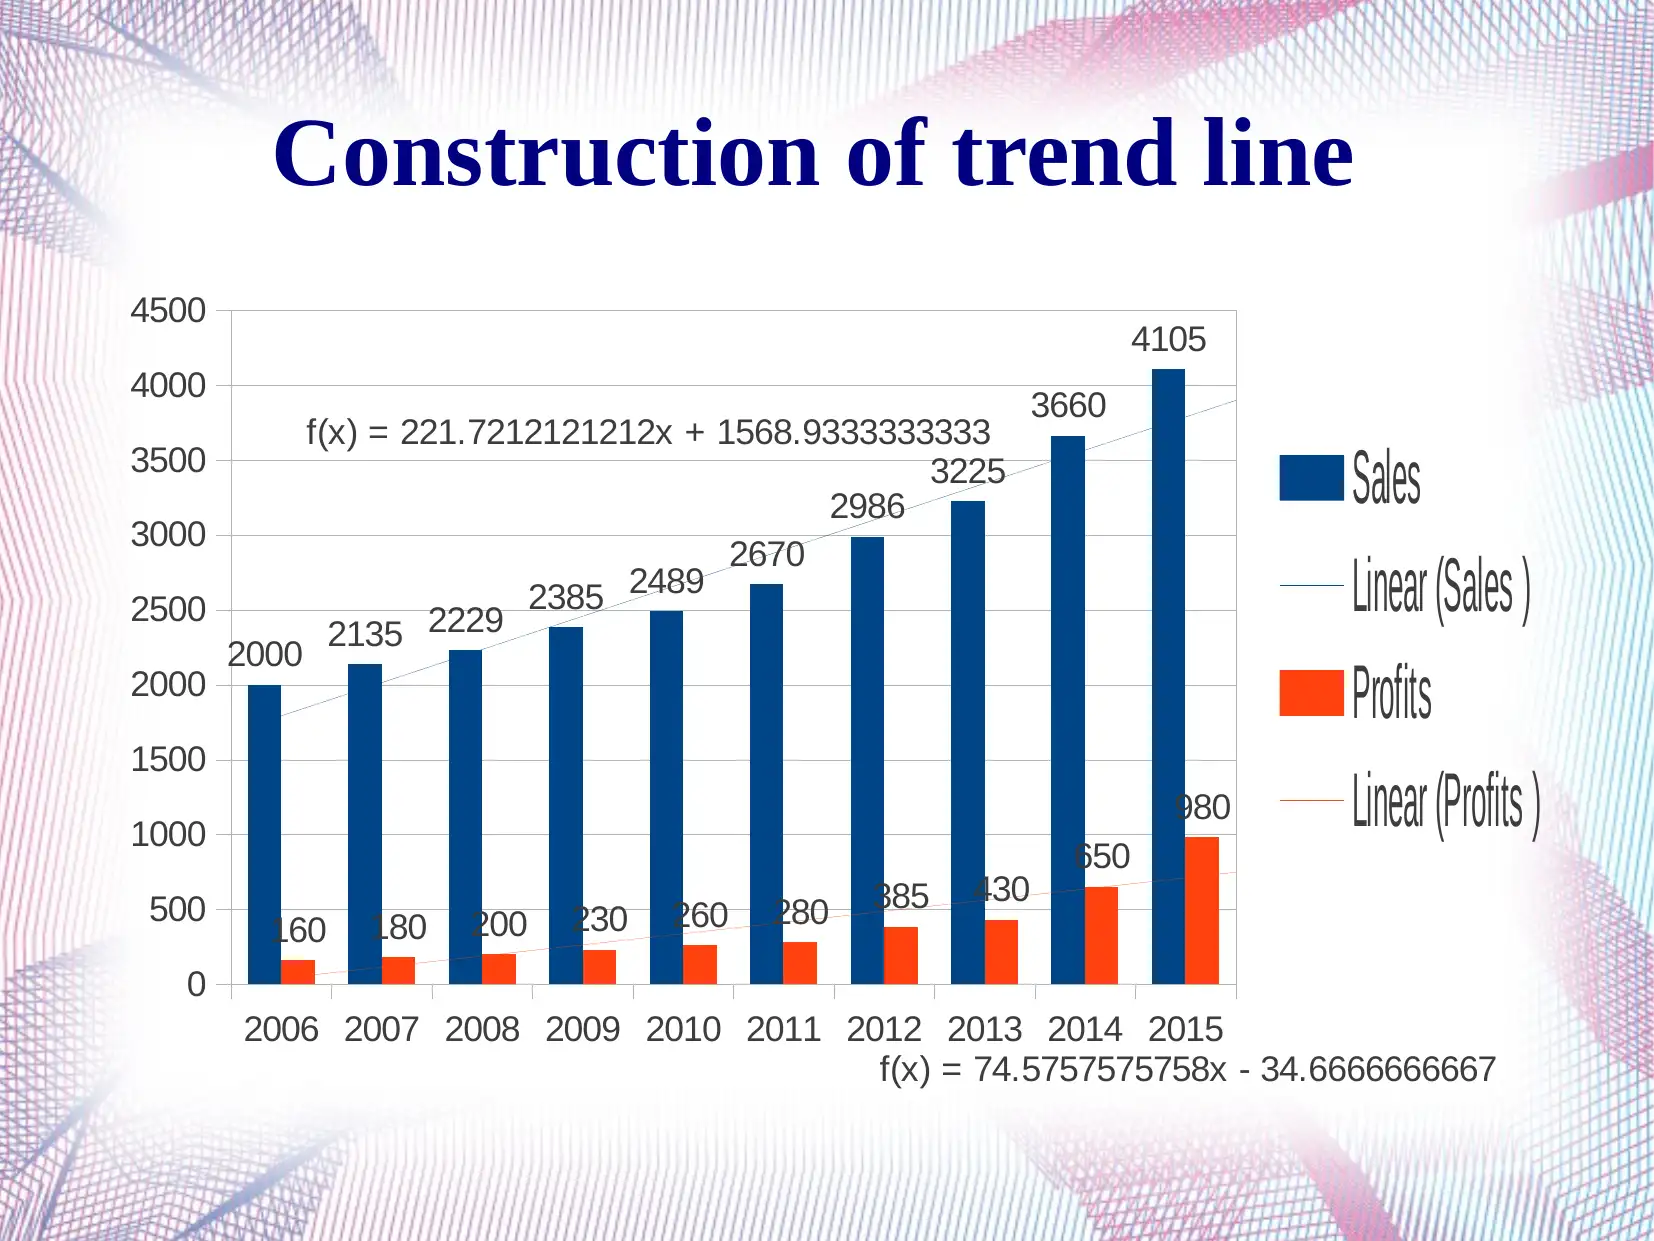
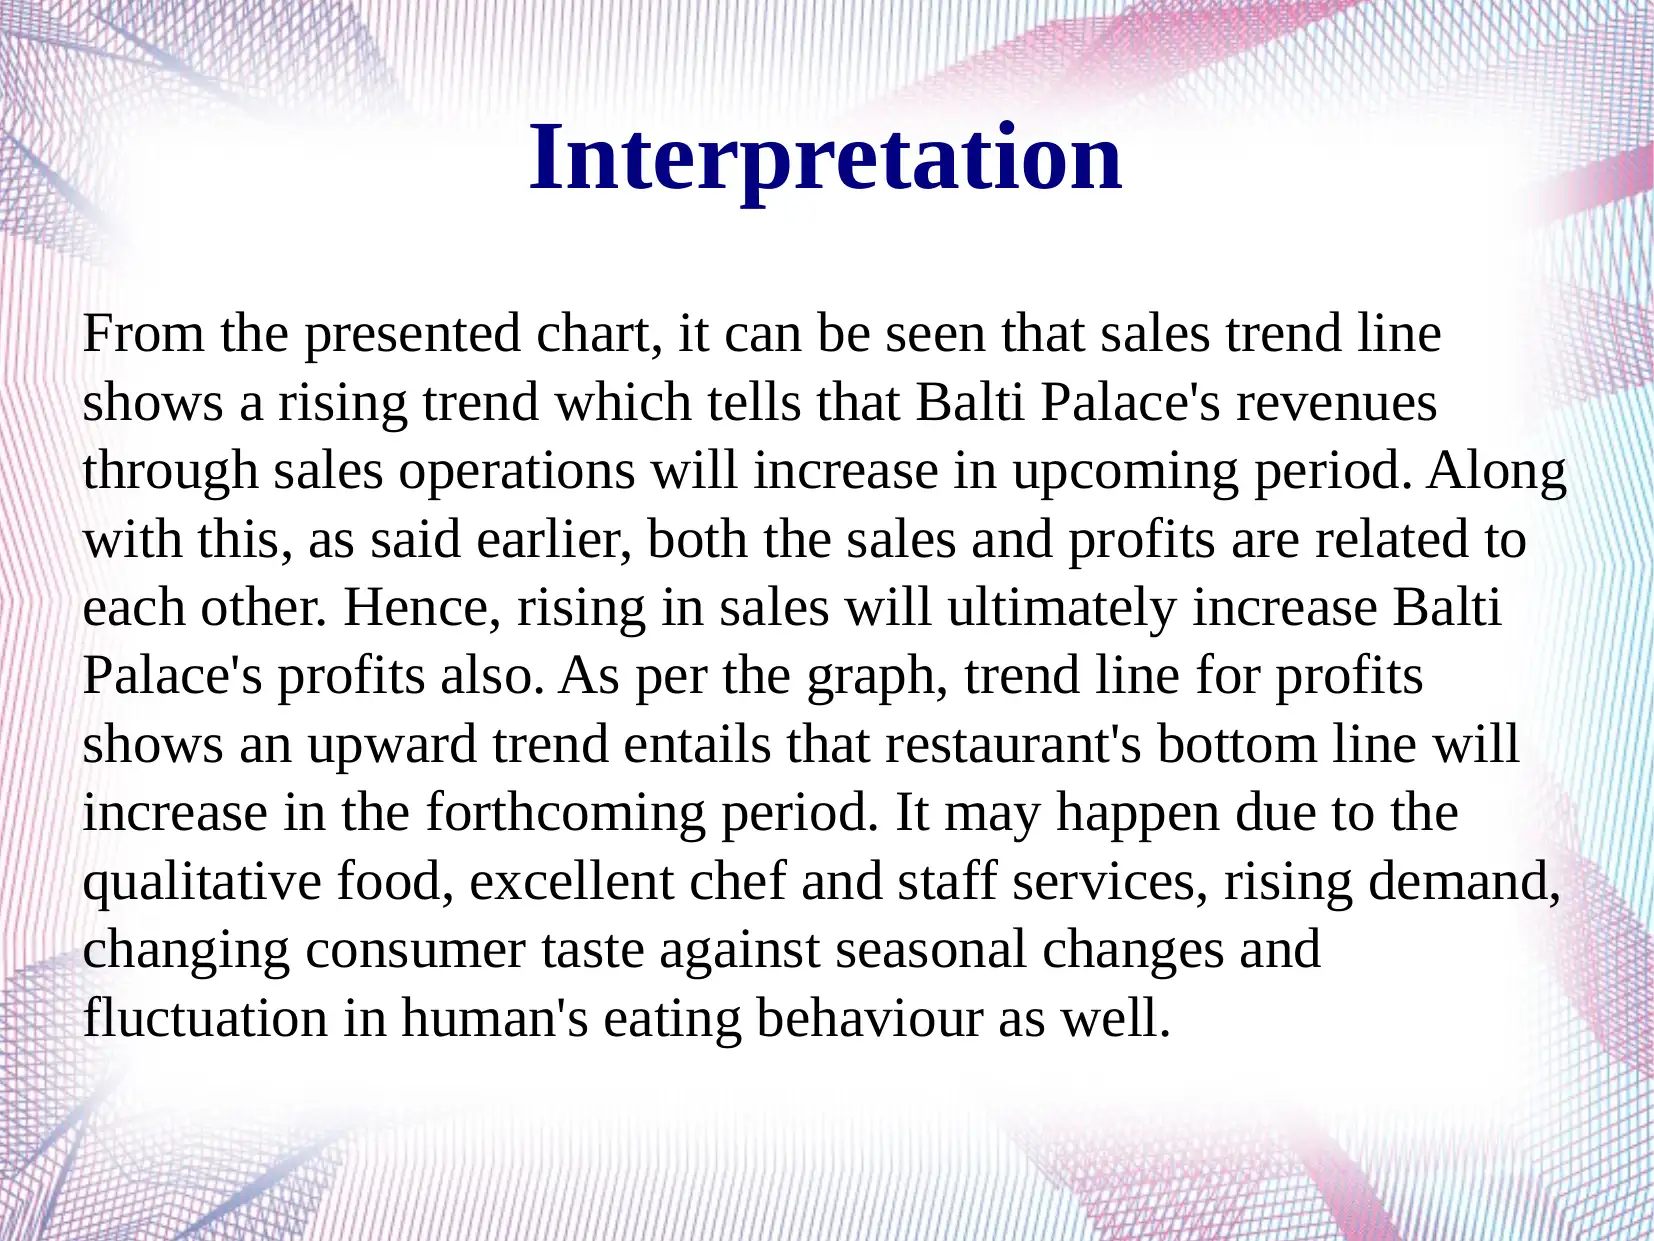
This report analyzes the sales and profit data of Balti Palace restaurant over a ten-year period (2006-2015). The analysis is presented through column and bar charts, visually representing the fluctuating sales and profit trends. The report highlights an increasing trend in both sales and profits, especially after 2010, indicating the restaurant's market volatility influenced by factors like changing consumer preferences, economic situations, and online food delivery services. Trend lines are constructed to forecast future movements, suggesting a continued rise in both sales and profitability. The report includes references to academic sources that support the use of graphical presentations in business decision making.
tabler-icon-diamond-filled.svg

Contribute Materials

Your contribution can guide someone’s learning journey. Share your documents today.
Document Page
Business decision making(AC 3.3)
tabler-icon-diamond-filled.svg

Secure Best Marks with AI Grader

Need help grading? Try our AI Grader for instant feedback on your assignments.
Document Page
Introduction
The presentation depicts about graphical
representation of sales and profits for the previous ten
years. It has be done through preparing column and bar
chart. Moreover, trend line has been constructed to
determine the potential movement of sales and profits
for the upcoming period.
Document Page
Historical sales and profit
Year Sales Profits
2006 2000 160
2007 2135 180
2008 2229 200
2009 2385 230
2010 2489 260
2011 2670 280
2012 2986 385
2013 3225 430
2014 3660 650
2015 4105 980
Document Page
Column chart
2006 2007 2008 2009 2010 2011 2012 2013 2014 2015
0
500
1000
1500
2000
2500
3000
3500
4000
4500
2000 2135 2229 2385 2489 2670
2986
3225
3660
4105
160 180 200 230 260 280 385 430 650
980
tabler-icon-diamond-filled.svg

Secure Best Marks with AI Grader

Need help grading? Try our AI Grader for instant feedback on your assignments.
Document Page
Bar chart
2006
2007
2008
2009
2010
2011
2012
2013
2014
2015
0 500 1000 1500 2000 2500 3000 3500 4000 4500
2000
2135
2229
2385
2489
2670
2986
3225
3660
4105
160
180
200
230
260
280
385
430
650
980
Document Page
Interpretation
From the basis of above chart, it can be said that both the sales and profits
are changing at fluctuating rate. Till the year 2010, Balti Palace's
revenues has been increased at lower rate. In the year 2006, its revenue
was £2000 increased to £2489 in the year 2010. After that, it has been
increased at faster rate as it has been enhanced to £4105 in 2015.
Along with this, profitability also moved in same direction as in the
year 2006, it was £160 significantly increased to £980 in 2015.
Henceforth, it became clear that restaurant's market is highly volatile
because of changing eating priorities and customer's food taste.
Moreover, other factors such as infrastructure, economic situation,
various types of food, online food delivery and price changes also lead
to bring significant change in Balti palace's revenues and profitability
in the market.
Document Page
Trend line
It is a line that helps to predict or forecast potential movement in
restaurant's sales and profitability. Trend analysis is a technical
analysis tool that provide assistance to estimate that both the
productivity and profitability will increase or decrease in future
period.
tabler-icon-diamond-filled.svg

Paraphrase This Document

Need a fresh take? Get an instant paraphrase of this document with our AI Paraphraser
Document Page
Construction of trend line
2006 2007 2008 2009 2010 2011 2012 2013 2014 2015
0
500
1000
1500
2000
2500
3000
3500
4000
4500
2000 2135 2229 2385 2489 2670
2986
3225
3660
4105
160 180 200 230 260 280 385 430 650
980
f(x) = 221.7212121212x + 1568.9333333333
f(x) = 74.5757575758x - 34.6666666667
Sales
Linear (Sales )
Profits
Linear (Profits )
Document Page
Interpretation
From the presented chart, it can be seen that sales trend line
shows a rising trend which tells that Balti Palace's revenues
through sales operations will increase in upcoming period. Along
with this, as said earlier, both the sales and profits are related to
each other. Hence, rising in sales will ultimately increase Balti
Palace's profits also. As per the graph, trend line for profits
shows an upward trend entails that restaurant's bottom line will
increase in the forthcoming period. It may happen due to the
qualitative food, excellent chef and staff services, rising demand,
changing consumer taste against seasonal changes and
fluctuation in human's eating behaviour as well.
Document Page
References
Hawley, S. T. and et. al., 2008. The impact of the format of graphical
presentation on health-related knowledge and treatment choices. Patient
education and counseling. 73(3). pp. 448-455.
Liese, A.D. and et.al., 2013. Characterizing the food retail environment: impact
of count, type, and geospatial error in 2 secondary data sources. Journal of
nutrition education and behavior. 45(5). pp. 435-442.
Morato, A. E., 2013. Business decision making. eBooklt.com
tabler-icon-diamond-filled.svg

Secure Best Marks with AI Grader

Need help grading? Try our AI Grader for instant feedback on your assignments.
Document Page
Thank You!
chevron_up_icon
1 out of 11
circle_padding
hide_on_mobile
zoom_out_icon
logo.png

Your All-in-One AI-Powered Toolkit for Academic Success.

Available 24*7 on WhatsApp / Email

[object Object]