Decision Support Tools: Decision Analysis, Regression & Simulation

Verified

Added on  2023/03/23

|13
|1709
|65
Homework Assignment
AI Summary
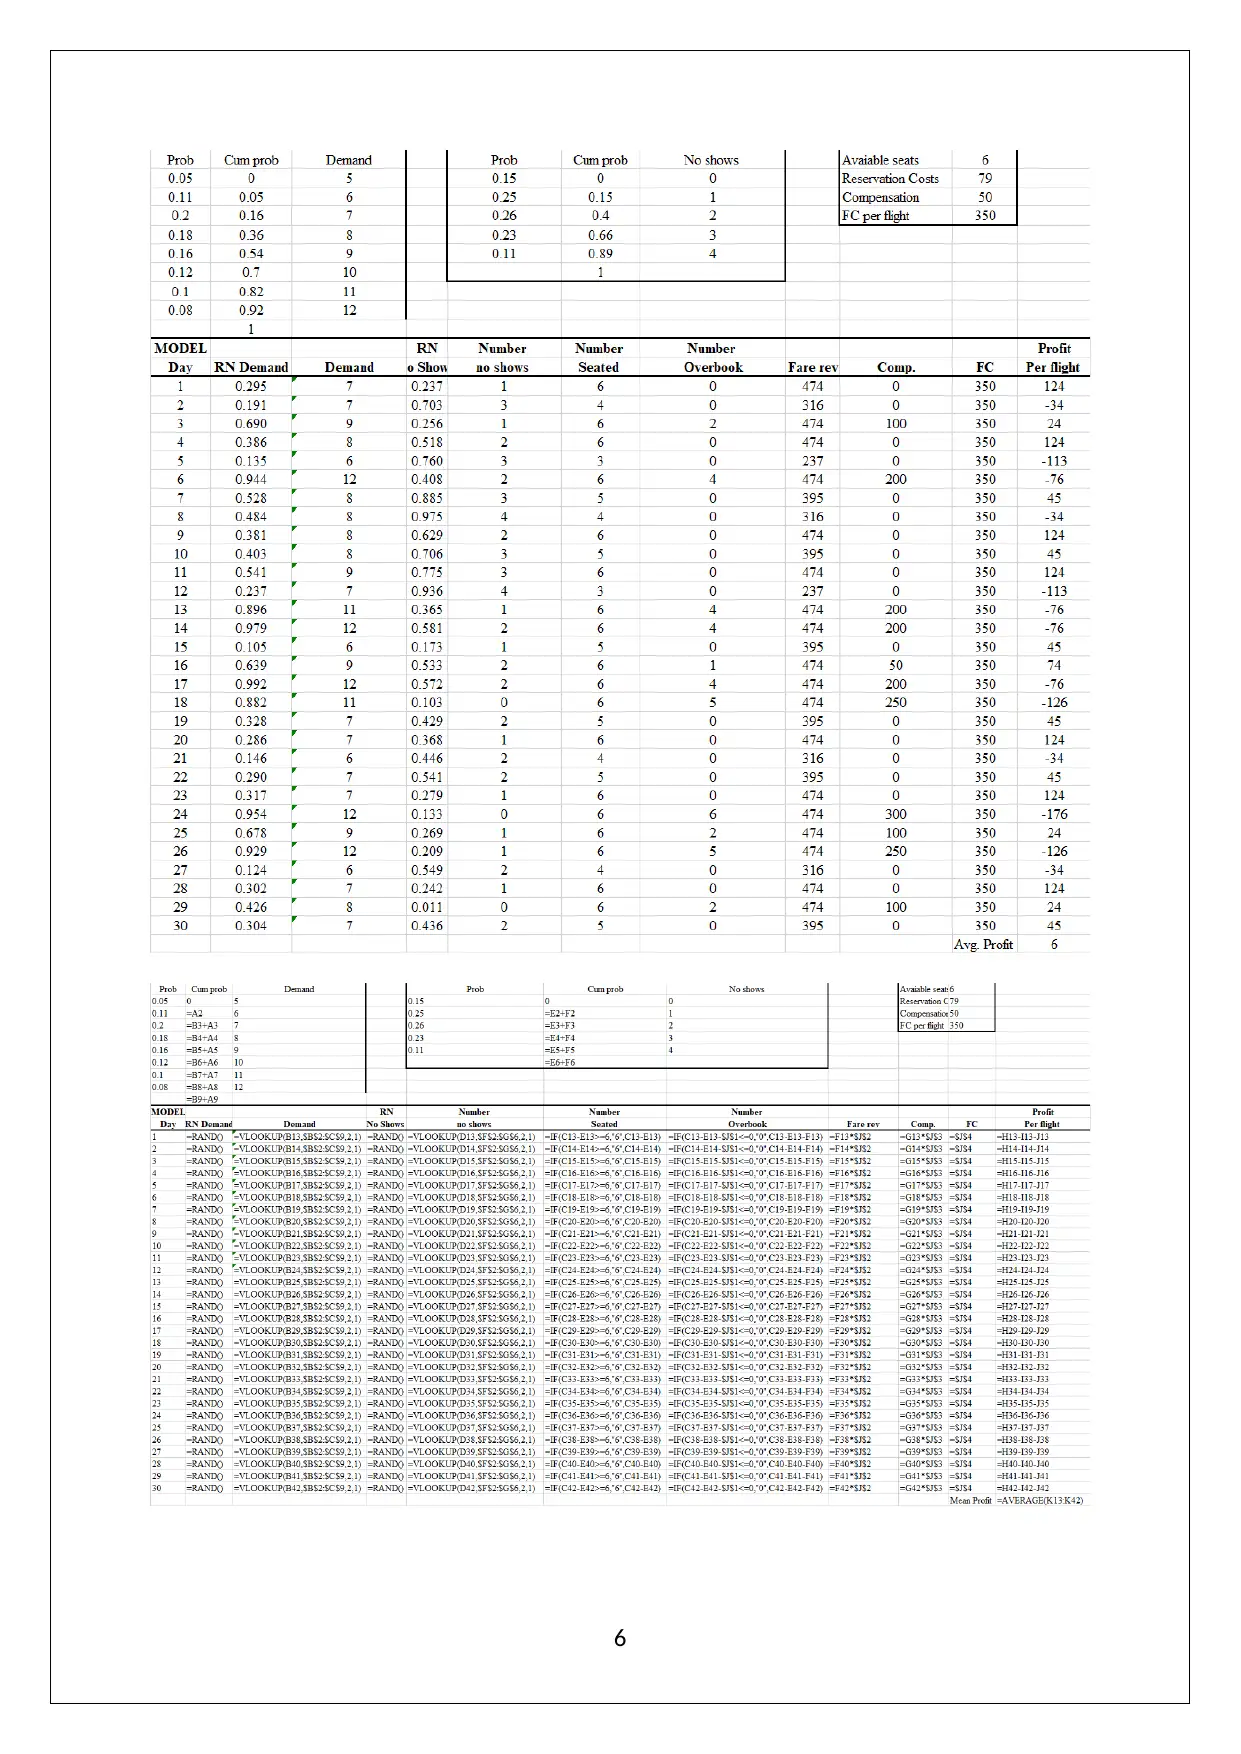
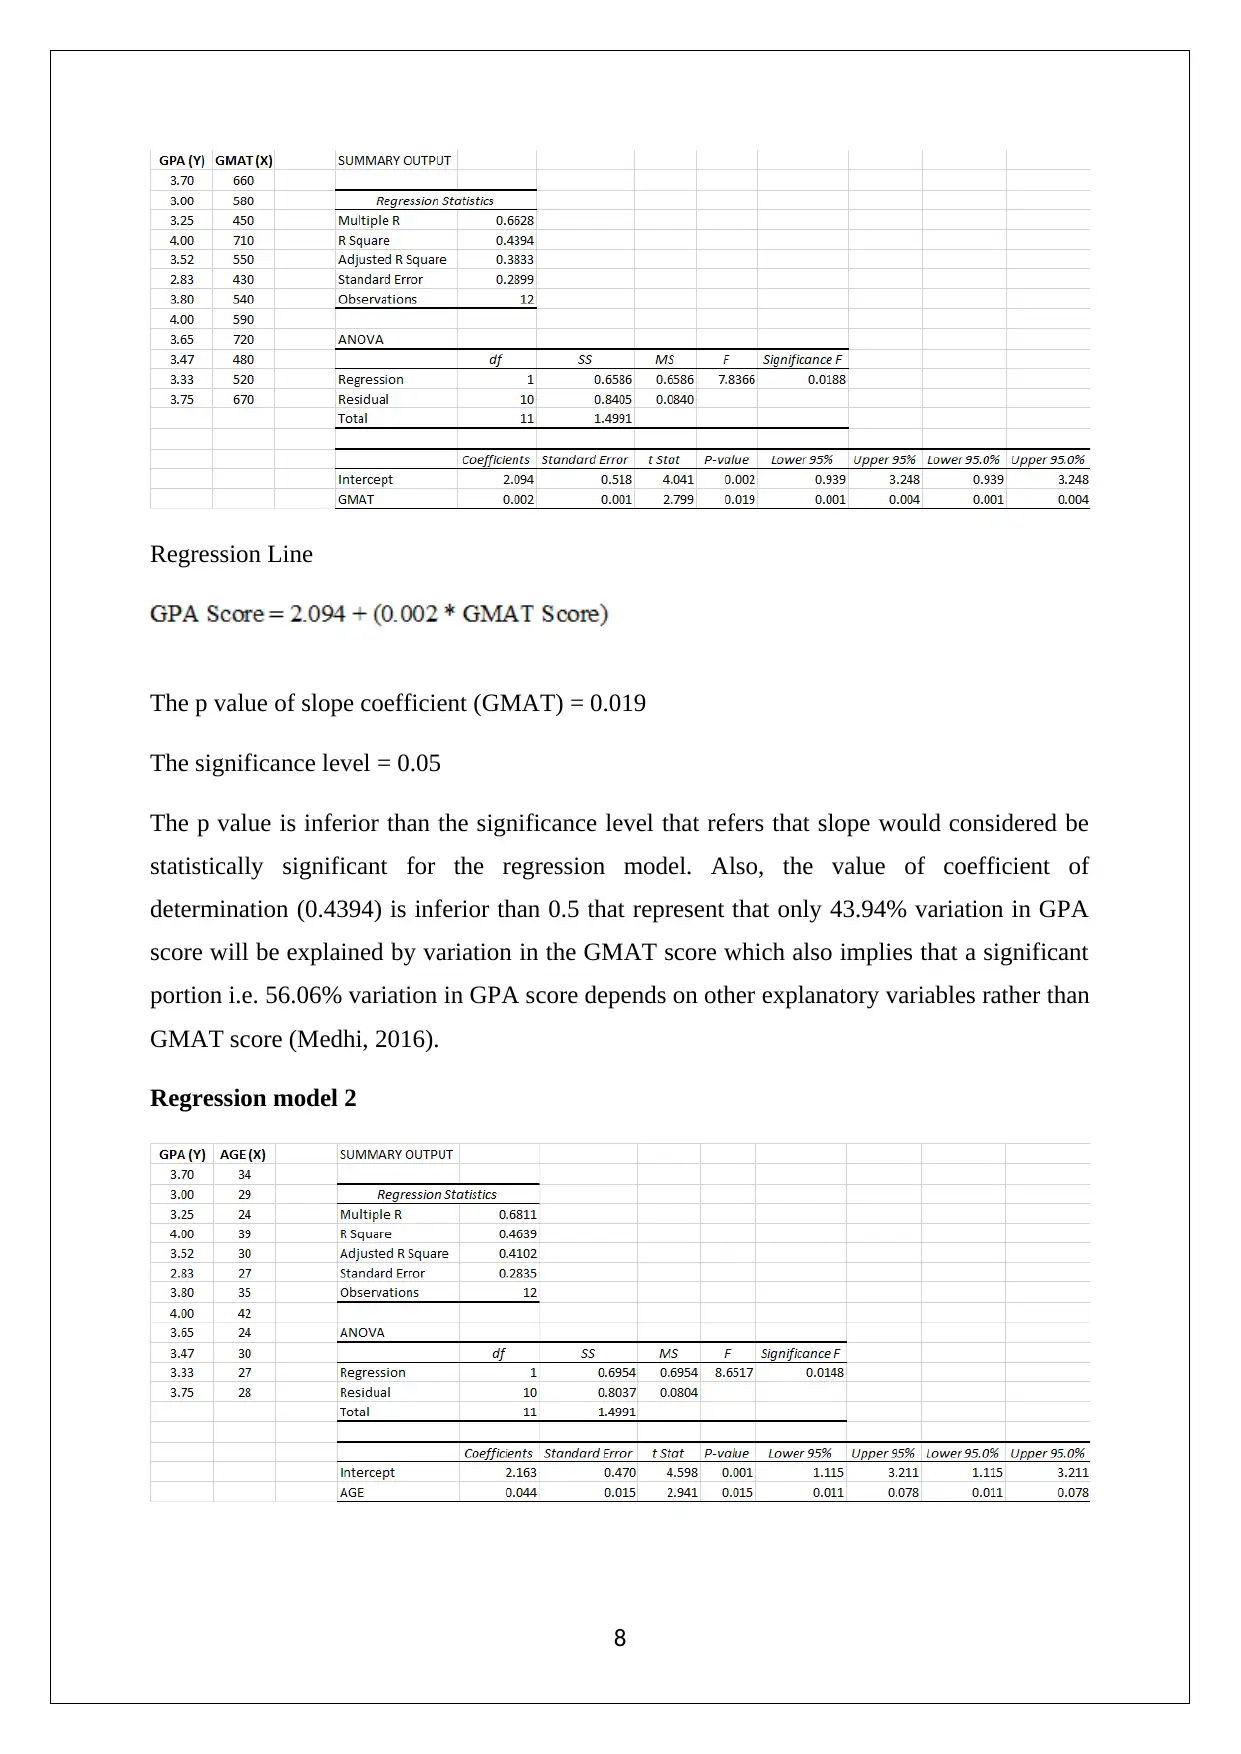
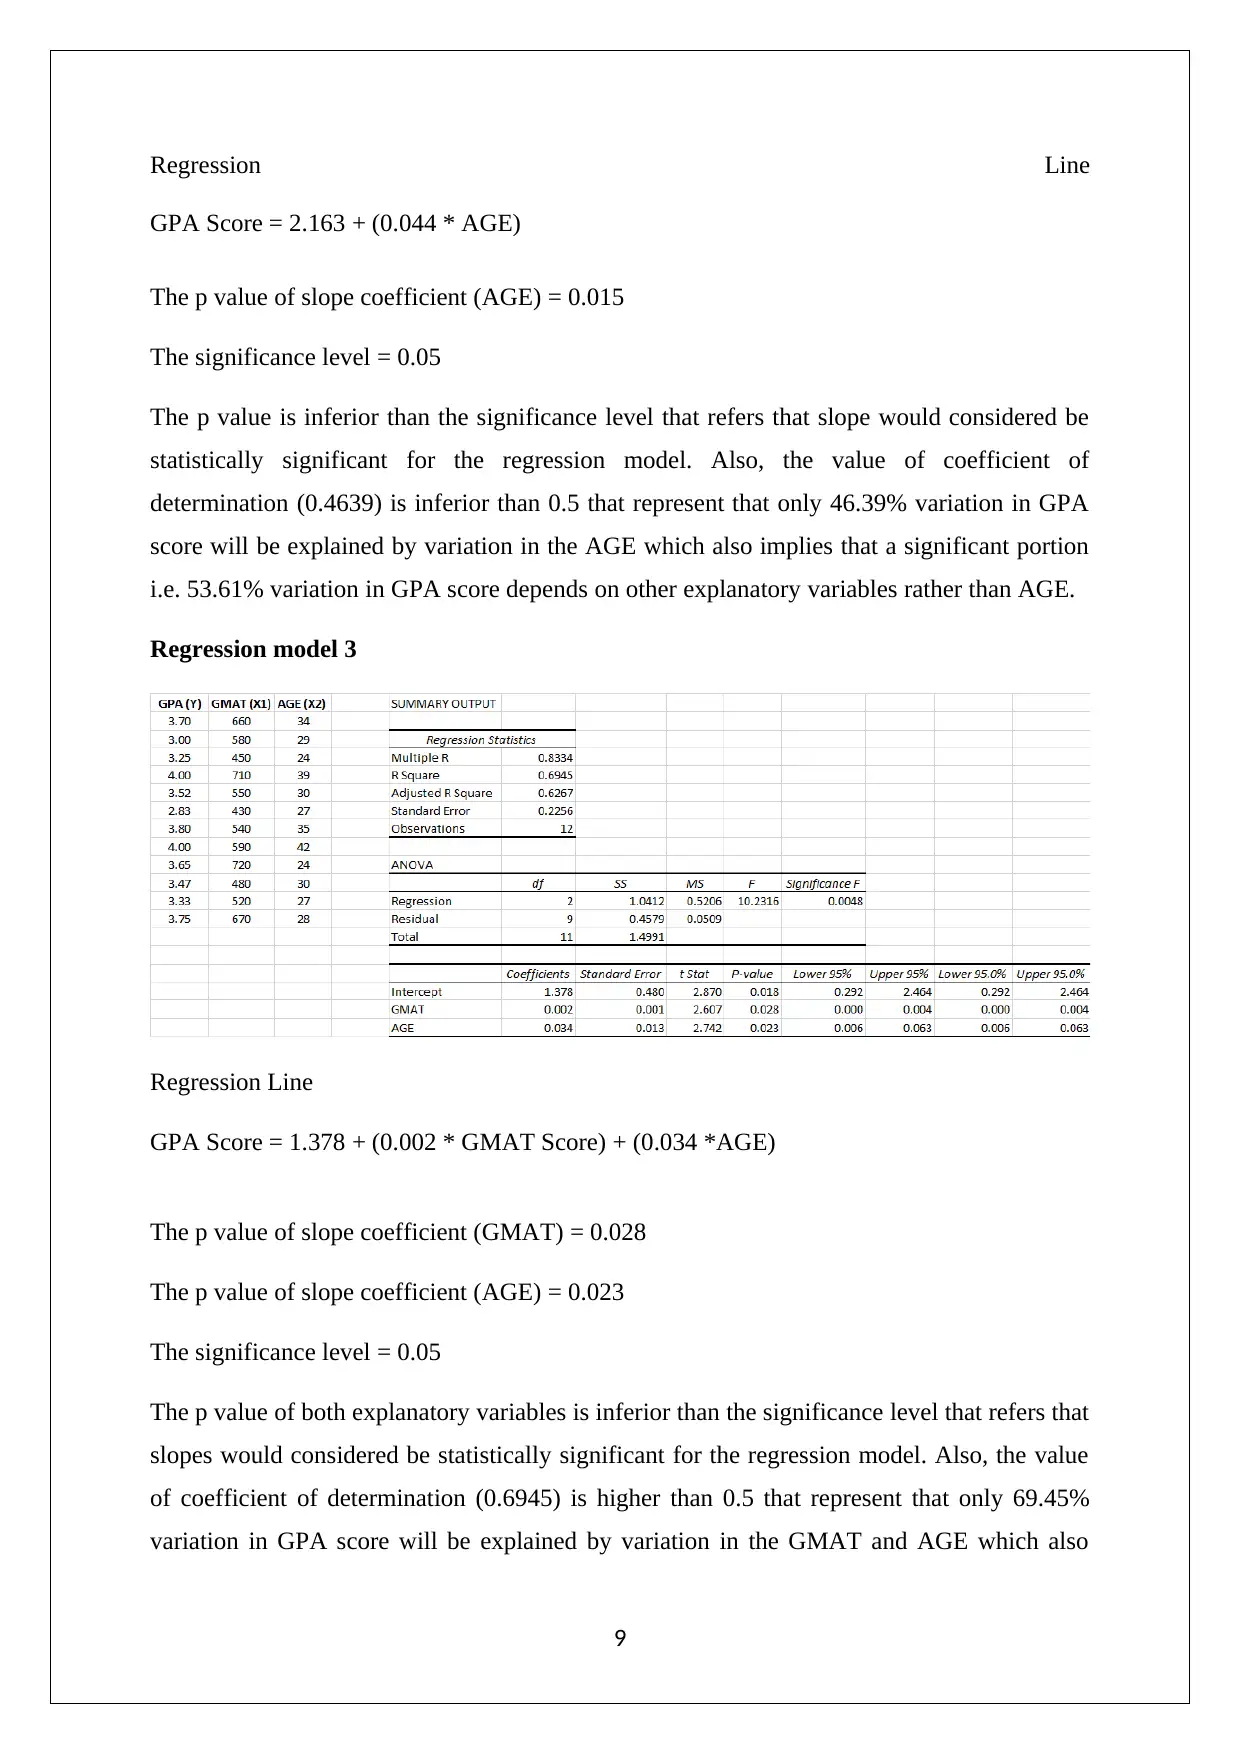
This assignment solution provides a comprehensive analysis of various decision support tools. It begins by discussing the advantages and steps involved in using a payoff matrix for decision analysis. It further differentiates decision trees from payoff matrices, highlighting scenarios where decision trees are preferred, such as sequential decision-making. The solution then applies different decision-making criteria (Optimist, Pessimist, Laplace, Regret, EMV, EVPI) to a practical problem. The assignment also includes a Monte Carlo simulation for airline operations, analyzing the impact of ticket fare and overbooking compensation on profitability. Finally, the solution includes a regression analysis to predict GPA scores based on GMAT scores and age, comparing different models based on their R-squared values and statistical significance. Numerical problems are solved with step by step solution.
Document Page
DECISION SUPPORT TOOLS
STUDENT ID
[Pick the date]
tabler-icon-diamond-filled.svg

Paraphrase This Document

Need a fresh take? Get an instant paraphrase of this document with our AI Paraphraser
Document Page
Question 1
(a) One key advantage that is associated with the use of payoff matrix is that it highlights the
possible payoffs (profit/losses) associated with the various states for the choices that the
decision maker can potentially make. Then, based on the underlying decision making
criterion, a decision can be made with regards to the underlying optimum choice. In order
to facilitate this, there are various steps which are outlined as follows (Eriksson &
Kovalainen, 2015).
First Step: The various states which are uncertain but probabilistic in nature need to be
identified.
Second Step: The potential payoff for each of the choices ought to be identified with regards
to different states that are possible in future.
Third Step: The requisite results ought to be expressed in the form of a matrix with states
along the column and choices across row.
(b) Even though both payoff matrix and decision tree are deployed for decision making but
there are certain scenarios in which one of the methods might be preferred over the other.
One such scenario is sequential decision making where it is essential that parallel decision
making cannot be carried out as the impact of one decision tends to be seen on the next
decision. In such scenarios, it is advisable to use decision trees instead of payoff matrix
(Flick, 2015).
(c) George would select the appropriate alternative based on the type of method used.
(1) The payoff matrix can be formed by considering the given data and information.
(2) George is considered to be an Optimist then he will select maximum value of the
maximum row values of each alternative. Hence, robot 1 will be taken into account.
2
Document Page
(3) George is considered to be a Pessimist then he will select maximum value of the
minimum row values of each alternative. Hence, he should choose third alternative i.e. do
nothing.
(4) George has considered Lapalce Criterion then he will select maximum mean of the mean
value of the row values of each alternative. Hence, robot 1 or robot 2 will be taken into
account because both has same mean.
-
(5)George has considered Regret Criterion then he will select minimum value of the
maximumrow value of each alternative. Hence, 2 will be taken into account
(6) George has considered expected monetary value then he will select max EMV from each
of the alternative. Hence, robot 1 will be taken into account
3
Document Page
(7) EVPI
Question 2
(a) Revised prior probabilities
Explanation (Formula view)
(b) Posterior probability
P(S1 | Y1) (From Above) = 0.6279
4
tabler-icon-diamond-filled.svg

Paraphrase This Document

Need a fresh take? Get an instant paraphrase of this document with our AI Paraphraser
Document Page
(c) Expected value with simple information (EVSI) and ENGSI
Now,
(d) Expected value with perfect information (EVPI)
Question 3
a) The requisite Monte Carlo simulation is carried out for the airline operations in the
manner exhibited below.
5
Document Page
6
Document Page
(2) The simulation model above reflects that if the fare is increased and no other parameter is
altered, then there is a positive influence on the profitability of the operations. This is on
expected lines and does not come as a surprise. However, a key aspect which remains
unaddressed in this regards is that higher fare can have adverse impact on the demand along
with no show probability. The current analysis has been performed assuming that these
remain constant by altering prices.
Further, if the overcompensation booking amount is decreased, then a positive impact on
profits is seen. On the contrary, any increase in this amount would adversely impact the
profitability of operations. As in the case of ticket fare, the above analysis is valid only when
the other factors remain constant which seem unlikely.
(3) The Manager
ABC Company
Dear Sir
A simulation model has been run based on the input data provided so as to estimate the
current profitability. Also, various inputs have been altered in order to understand their
impact on the overall profits generated. Two variables that are critical in this regards are
ticket fare and overbooking compensation. Increase of ticket fare and/ or decreasing the
overbooking compensation tends to have a positive influence on the profitability of the airline
operations. However, as indicated in the previous question any changes made to these
variables would impact demand and no show probabilities. As a result, before making any
permanent changes with regards to the identified variables, it makes sense that research is
done through pilot runs with regards to impact of changes in fare and overbooking
compensation on demand and other variables. Once this is understood and incorporated in the
existing model can the precise impact be completely understood which would aid in prudent
decision making.
Yours Sincerely
Question 4
Regression model 1
7
tabler-icon-diamond-filled.svg

Paraphrase This Document

Need a fresh take? Get an instant paraphrase of this document with our AI Paraphraser
Document Page
Regression Line
The p value of slope coefficient (GMAT) = 0.019
The significance level = 0.05
The p value is inferior than the significance level that refers that slope would considered be
statistically significant for the regression model. Also, the value of coefficient of
determination (0.4394) is inferior than 0.5 that represent that only 43.94% variation in GPA
score will be explained by variation in the GMAT score which also implies that a significant
portion i.e. 56.06% variation in GPA score depends on other explanatory variables rather than
GMAT score (Medhi, 2016).
Regression model 2
8
Document Page
Regression Line
GPA Score = 2.163 + (0.044 * AGE)
The p value of slope coefficient (AGE) = 0.015
The significance level = 0.05
The p value is inferior than the significance level that refers that slope would considered be
statistically significant for the regression model. Also, the value of coefficient of
determination (0.4639) is inferior than 0.5 that represent that only 46.39% variation in GPA
score will be explained by variation in the AGE which also implies that a significant portion
i.e. 53.61% variation in GPA score depends on other explanatory variables rather than AGE.
Regression model 3
Regression Line
GPA Score = 1.378 + (0.002 * GMAT Score) + (0.034 *AGE)
The p value of slope coefficient (GMAT) = 0.028
The p value of slope coefficient (AGE) = 0.023
The significance level = 0.05
The p value of both explanatory variables is inferior than the significance level that refers that
slopes would considered be statistically significant for the regression model. Also, the value
of coefficient of determination (0.6945) is higher than 0.5 that represent that only 69.45%
variation in GPA score will be explained by variation in the GMAT and AGE which also
9
Document Page
implies that nearly 30.55% variation in GPA score depends on other explanatory variables
rather than AGE and GMAT score (Taylor & Cihon, 2014).
(2) For outlining the superior choice in relation to the linear regression models computed
above, the crucial parameter would be R2 which is a indicator of model fit and predictive
capability. Further, from the Model 1 and Model 2, the key takeaway is that the dependent
variable is significantly dependent on both Age and GMAT. As a result, Model 3 would be
the preferred model since it considers both these significant variables. Also, Model 3 has the
highest R2 value which also provides support (Eriksson & Kovalainen, 2015).
(3) Regression line inputs
AGE = 29 years
GMAT Score = 600
Regression mode 3, equation would be appropriate to find the GPA Score.
GPA Score = 1.378 + (0.002 * GMAT Score) + (0.034 *AGE)
GPA Score = 1.378 + (0.002 * 600) + (0.034 *29) = 3.512
Question 5
(1) The unit contribution margin would be computed for product A in order to find the break-
even units and the break-even units in dollars
10
tabler-icon-diamond-filled.svg

Paraphrase This Document

Need a fresh take? Get an instant paraphrase of this document with our AI Paraphraser
Document Page
(2) Target profit = $600
(3) Unit contribution margin
The total profit (post tax) = $1400
(4) Assuming that units of product A is N and Units of product B is 2N.
Therefore,
Gross profit derived from product A = 2N * Per unit sale price
Gross profit derived from product A = 2N * 6 = 12 N
Similarly,
Gross profit derived from product B = N * Per unit sale price
Gross profit derived from product A= N * 6 = 12 N
Total gross profit derived from both products = 24N
Now,
Total fixed cost = $5200
Total gross profit = Fixed cost + Profit before tax
24 N =5200+2000
Which means N=300
11
Document Page
Hence,
References
Eriksson, P. & Kovalainen, A. (2015). Quantitative methods in business research (3rded.).
London: Sage Publications.
Flick, U. (2015). Introducing research methodology: A beginner's guide to doing a research
project (4thed.). New York: Sage Publications.
Hillier, F. (2016).Introduction to Operations Research.(6thed.). New York: MvcGraw Hill
Publications.
Medhi, J. (2016). Statistical Methods: An Introductory Text (4thed.). Sydney: New Age
International.
12
chevron_up_icon
1 out of 13
circle_padding
hide_on_mobile
zoom_out_icon
[object Object]