Business Decision Making Report: Analysis of Syngenta's Product Launch
VerifiedAdded on 2020/06/05
|20
|3412
|283
Report
AI Summary
This report analyzes Syngenta's business decision-making process for launching its Amistar product in the US market. It details the plan for data collection, including primary and secondary data sources, and assesses survey methodologies, including the use of questionnaires. The report includes significant calculations such as mean, median, mode, variance, and standard deviation, along with an analysis of the results. It also covers quartile, percentile, and correlation coefficient explanations. Graphical presentations of data and trend lines are provided, alongside a formal business report. Furthermore, the report explores the use of information processing tools like management information systems, executive information systems, and transaction processing systems, along with the application of Gantt charts and financial tools for decision-making. The report concludes with recommendations for improving Syngenta's product production and market strategies.

BUSINESS DECISION
MAKING
MAKING
Paraphrase This Document
Need a fresh take? Get an instant paraphrase of this document with our AI Paraphraser
Table of Contents
INTRODUCTION...........................................................................................................................1
1.1 Plan for the collection of data...............................................................................................1
1.2 Assessing survey methodology and sampling.......................................................................2
1.3 Questionnaire survey.............................................................................................................2
TASK 2............................................................................................................................................4
2.1 Significant calculation of this organisation...........................................................................4
2.2 Analysing the results.............................................................................................................5
2.3 Range and standard deviation of the organisation................................................................5
2.4 Explaining quartile, percentile and correlation coefficient of the company.........................5
TASK 3............................................................................................................................................6
3.1 Graphical presentation of the data.........................................................................................6
3.2 Trend line of the company....................................................................................................7
3.3 Presentation...........................................................................................................................7
3.4 Formal business report..........................................................................................................7
TASK 4............................................................................................................................................8
4.1 Use of information processing tool.......................................................................................8
4.2 Gantt chart as project management tool................................................................................9
4.3 Financial tools for decision making....................................................................................10
CONCLUSION..............................................................................................................................11
REFERENCES..............................................................................................................................12
INTRODUCTION
Business decision making is process where the professionals of an organisation drive
consulting affair for the better functioning of the organisation. This can be done by the various
primary or secondary sources like questionnaire, internet surfing, books and journals, public
survey and research etc. The Syngenta is going launch its product Amistar in US to help the
farmers in protection of their corps. The Amistar product is helpful in protecting the plants from,
the fungal diseases which will result in the good quality of the corps. The survey was made on
the various farmers and locations where the proper condition of climate and land has been
discussed. There are the favourable reviews has been observed through various data collection
process.
1.1 Plan for the collection of data
Primary data:
Primary data collection is the method at which the professionals of any organisation took
the surveys at various location to find out the public demands and requirements. Various surveys
made on the more than 20 managers at the agriculture department about their needs and changes
in the farming as well as the demand of Amistar product (Gill and et.al., 2008). The
questionnaire has been made which brings the favourable results for the product launching. Each
question at the questionnaire helps in developing the area of weaknesses and making the
strategies as according to help the production, pricing, promoting etc. to the product.
Secondary data:
Secondary data collection is done through the various secondary sources like internet,
books, articles, journals etc (Groves and et.al., 2011). For Amistar launching the survey was
made with the help on internet. It describes the whole climate condition and the requirements on
fertilising the corps (methods of data collection- primary and secondary data, 2016). US is the
world's largest corn producer so there is the need of this product. With the help of this product
the corn plants will be protected from the various pests and fungal infections. The information
should be taken from the domestic parties to know the requirement of this product.
1
⊘ This is a preview!⊘
Do you want full access?
Subscribe today to unlock all pages.
Trusted by 1+ million students worldwide
1.2 Assessing survey methodology and sampling
Survey Methodology:
Survey is an important process through which the proper knowledge and data can be
collected before the launching of any product. For the launching of Amistar the surveys can be
done through various methods (Groves and et.al., 2011). It can be through questionnaire,
individual, internet, sampling etc. The questionnaire can be send to the various individuals at
their addresses to know their preferences, needs and want.
Sampling Method:
Sampling helps in dividing the number of population in the various units which has the
similarity in their character, choices or preferences (Sluiter and et.al., 2008). The sampling
method is very helpful in the survey process on Amistar launching. Choose randomly the 20
managers at the agriculture department and made the survey over them about gathering the main
data. It can be made through the various sampling techniques like random, systematic, stratified
and etc.
1.3 Questionnaire survey
Q.1 Demographic informations
[A] Name:
[B] Age:
[C] Gender:
Q.2 How beneficial is this product for you?
[A] Highly beneficial
[B] beneficial
[C] Good
[D] Poor
Q.3 What is the quality of this product?
[A] Best
2
Paraphrase This Document
Need a fresh take? Get an instant paraphrase of this document with our AI Paraphraser
[B] Good
[C] Normal
[D] Disappointing
Q.4 How the prices satisfy you for this product?
[A] Good no need to change
[B] Can be change
[C] Must be changed
Q.5 Is the location of the store is convenient to you?
[A] Yes, it is convenient
[B] No, it must be nearer
Q.6 Is the competitors are better than us?
[A] Yes
[B] No
Q.7 What is your opinion for the advertisement of the product?
[A] It should be promoted
[B] No, there is no need to advertise the product
Q.8 Where do you prefer to purchase the product?
[A] From the online market
[B] From the shopping malls
[C] From the grocery stores
Q.9 How satisfied are you with this product?
[A] Highly satisfied
[B] Satisfied
3
[C] Disappointed
[D] Highly disappointed
Q.10 Are you able to afford this product?
[A] Too luxurious
[B] Normal
[C] Cheap
Q.11 About the product which should be improved?
[A] Product quality
[B] Product pricing
[C] Packaging
Q.12 Would you recommend the products with your social groups?
[A] Yes
[B] No
TASK 2
2.1 Significant calculation of this organisation.
Mean:
Calculation of the mean can be done through the adding all the numbers and dividing
with the volume of numbers (Nguyen and et.al., 2012). It is an average of all the numbers which
is helpful in the better selection of a particular number.
Median:
The number of any list of the numbers is known as the median. It is to be calculated by
arranging the numbers in the ascending order means small to large so the proper selection of
number can be made.(Nguyen and et.al., 2012)
Mode:
4
⊘ This is a preview!⊘
Do you want full access?
Subscribe today to unlock all pages.
Trusted by 1+ million students worldwide
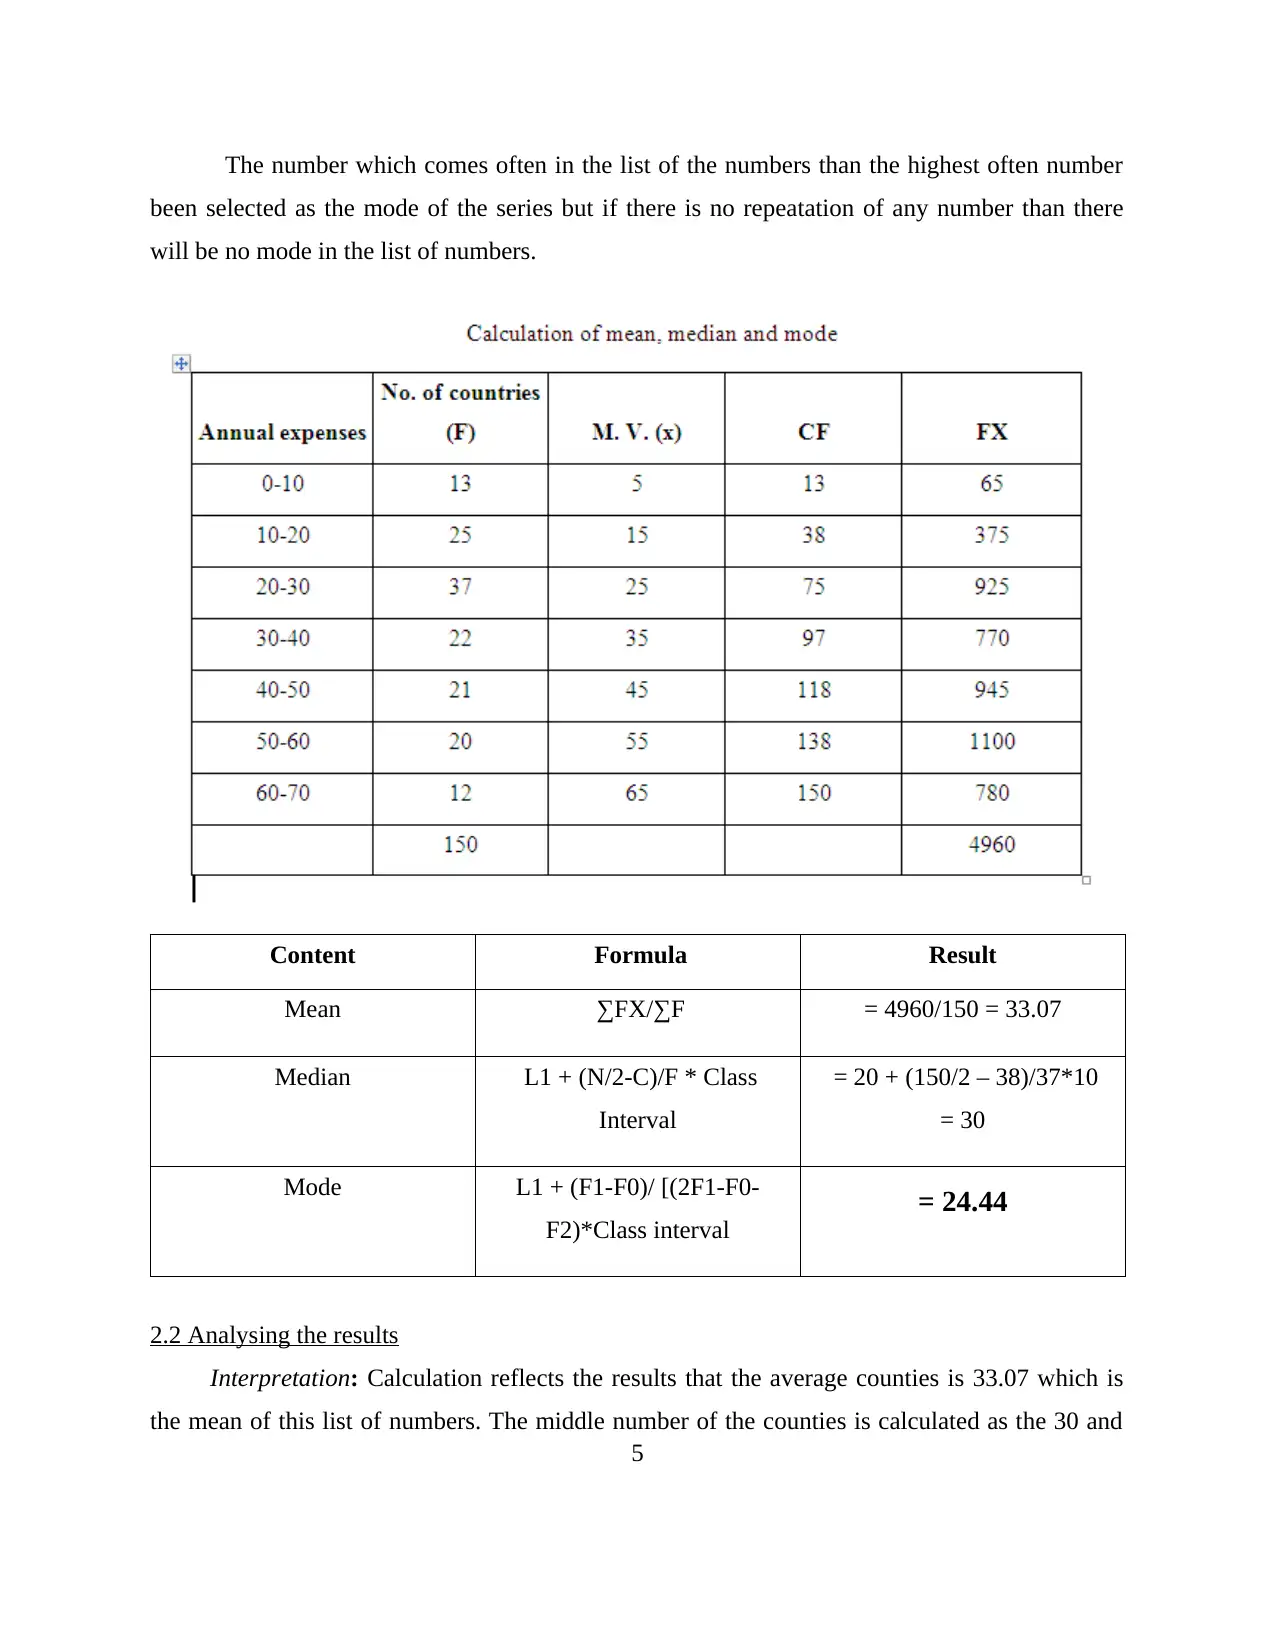
The number which comes often in the list of the numbers than the highest often number
been selected as the mode of the series but if there is no repeatation of any number than there
will be no mode in the list of numbers.
Content Formula Result
Mean ∑FX/∑F = 4960/150 = 33.07
Median L1 + (N/2-C)/F * Class
Interval
= 20 + (150/2 – 38)/37*10
= 30
Mode L1 + (F1-F0)/ [(2F1-F0-
F2)*Class interval
= 24.44
2.2 Analysing the results
Interpretation: Calculation reflects the results that the average counties is 33.07 which is
the mean of this list of numbers. The middle number of the counties is calculated as the 30 and
5
Paraphrase This Document
Need a fresh take? Get an instant paraphrase of this document with our AI Paraphraser
the most often number is 24.44 as the mode of the list of numbers. Thus, the line manager should
go for the scale 30-40 as the potential annual expenditure.
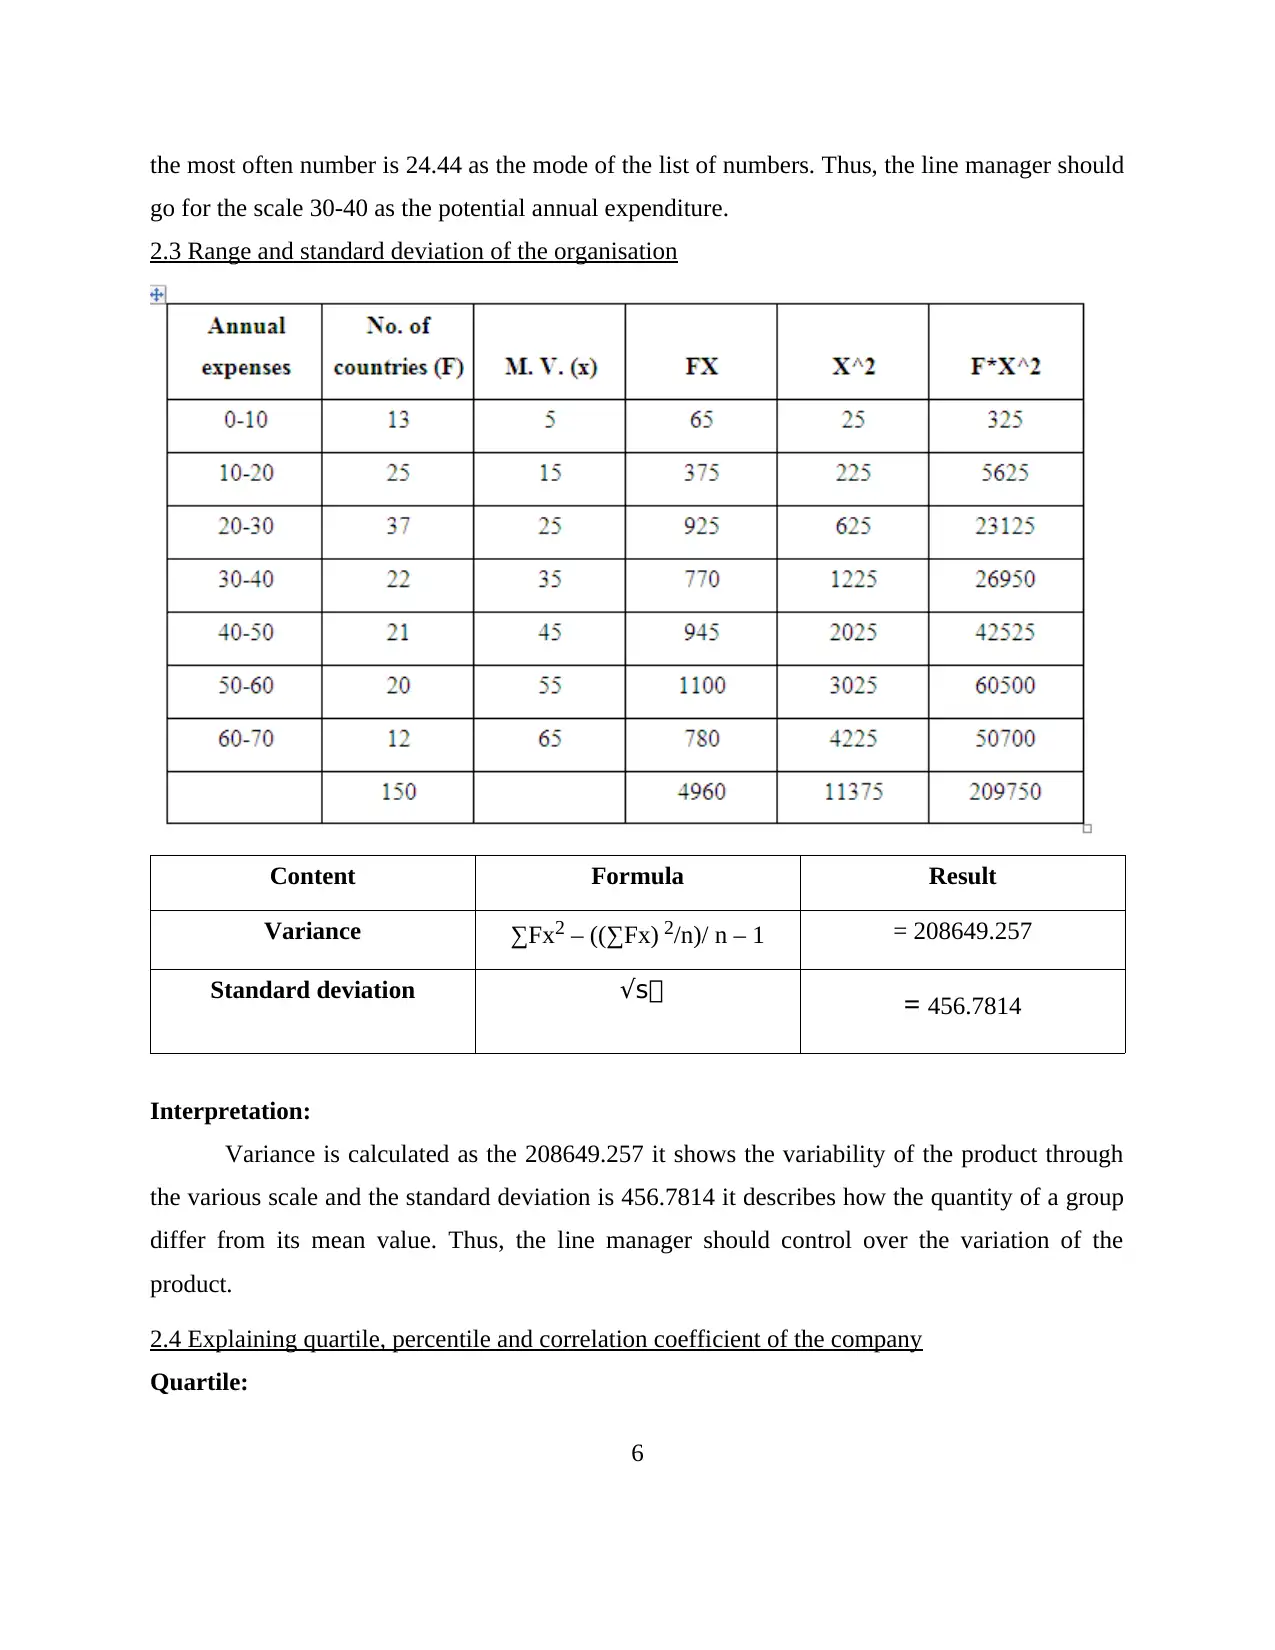
2.3 Range and standard deviation of the organisation
Content Formula Result
Variance ∑Fx2 – ((∑Fx) 2/n)/ n – 1 = 208649.257
Standard deviation √s = 456.7814
Interpretation:
Variance is calculated as the 208649.257 it shows the variability of the product through
the various scale and the standard deviation is 456.7814 it describes how the quantity of a group
differ from its mean value. Thus, the line manager should control over the variation of the
product.
2.4 Explaining quartile, percentile and correlation coefficient of the company
Quartile:
6
go for the scale 30-40 as the potential annual expenditure.
2.3 Range and standard deviation of the organisation
Content Formula Result
Variance ∑Fx2 – ((∑Fx) 2/n)/ n – 1 = 208649.257
Standard deviation √s = 456.7814
Interpretation:
Variance is calculated as the 208649.257 it shows the variability of the product through
the various scale and the standard deviation is 456.7814 it describes how the quantity of a group
differ from its mean value. Thus, the line manager should control over the variation of the
product.
2.4 Explaining quartile, percentile and correlation coefficient of the company
Quartile:
6
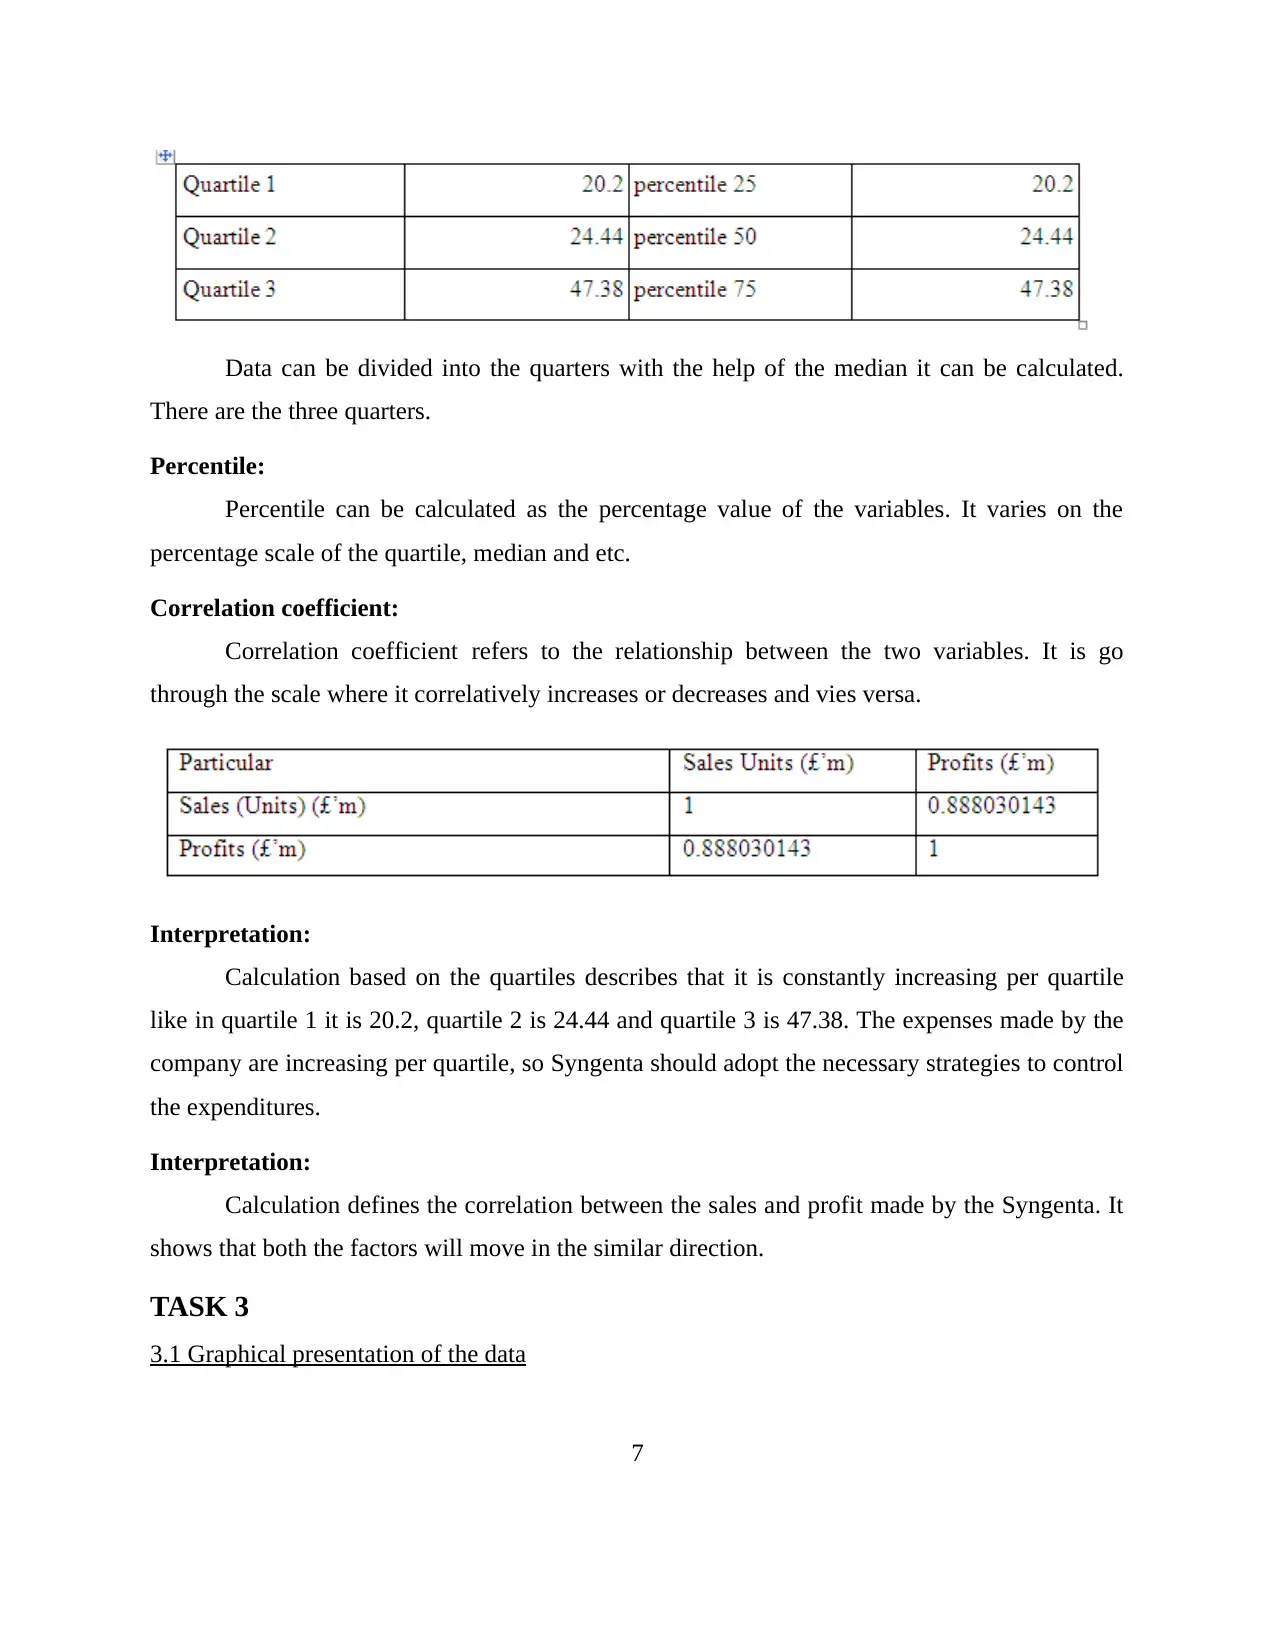
Data can be divided into the quarters with the help of the median it can be calculated.
There are the three quarters.
Percentile:
Percentile can be calculated as the percentage value of the variables. It varies on the
percentage scale of the quartile, median and etc.
Correlation coefficient:
Correlation coefficient refers to the relationship between the two variables. It is go
through the scale where it correlatively increases or decreases and vies versa.
Interpretation:
Calculation based on the quartiles describes that it is constantly increasing per quartile
like in quartile 1 it is 20.2, quartile 2 is 24.44 and quartile 3 is 47.38. The expenses made by the
company are increasing per quartile, so Syngenta should adopt the necessary strategies to control
the expenditures.
Interpretation:
Calculation defines the correlation between the sales and profit made by the Syngenta. It
shows that both the factors will move in the similar direction.
TASK 3
3.1 Graphical presentation of the data
7
⊘ This is a preview!⊘
Do you want full access?
Subscribe today to unlock all pages.
Trusted by 1+ million students worldwide
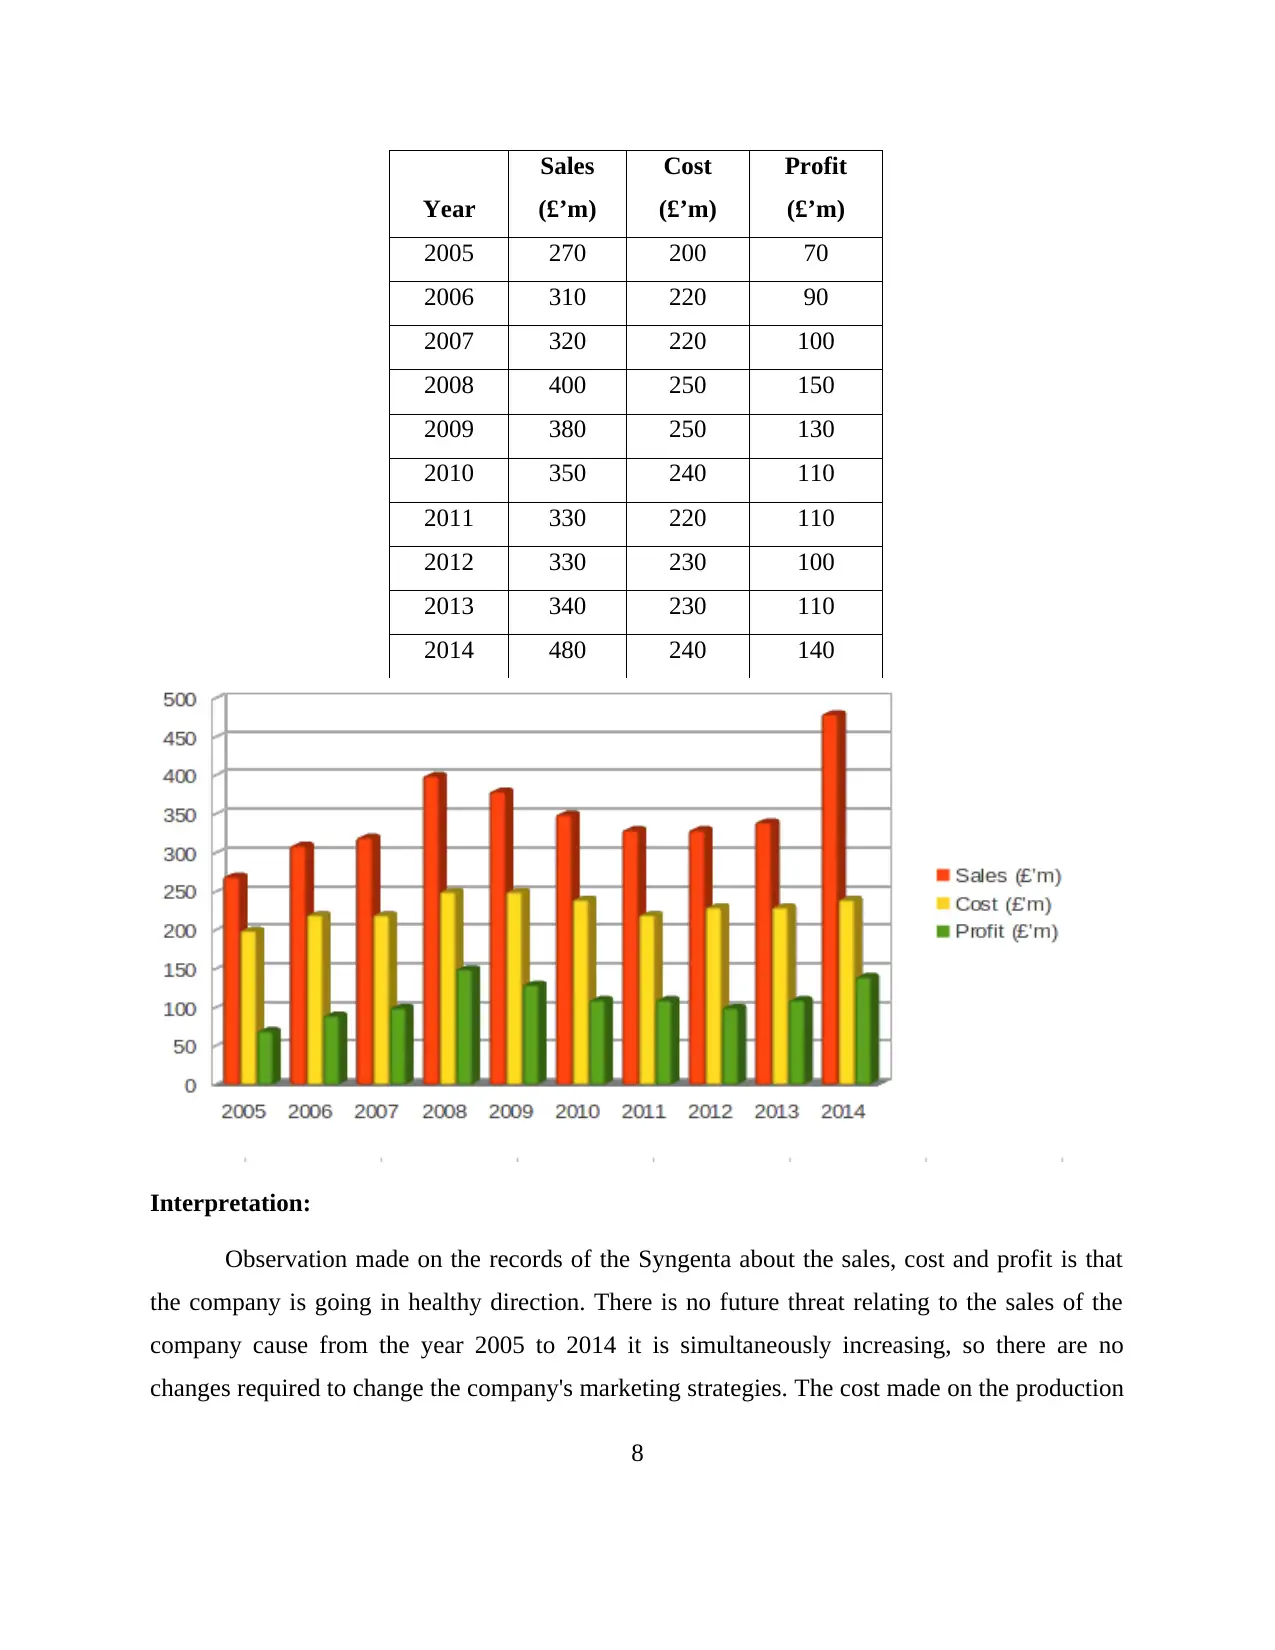
Year
Sales
(£’m)
Cost
(£’m)
Profit
(£’m)
2005 270 200 70
2006 310 220 90
2007 320 220 100
2008 400 250 150
2009 380 250 130
2010 350 240 110
2011 330 220 110
2012 330 230 100
2013 340 230 110
2014 480 240 140
Interpretation:
Observation made on the records of the Syngenta about the sales, cost and profit is that
the company is going in healthy direction. There is no future threat relating to the sales of the
company cause from the year 2005 to 2014 it is simultaneously increasing, so there are no
changes required to change the company's marketing strategies. The cost made on the production
8
Paraphrase This Document
Need a fresh take? Get an instant paraphrase of this document with our AI Paraphraser
is also increasing but not in order as the sales increases, it is a favourable indication to the
company. The profit is also increasing from the beginning year 2005 to 2014. It shows the
growth of the company's reputation in the market and how often the customers are using the
product.
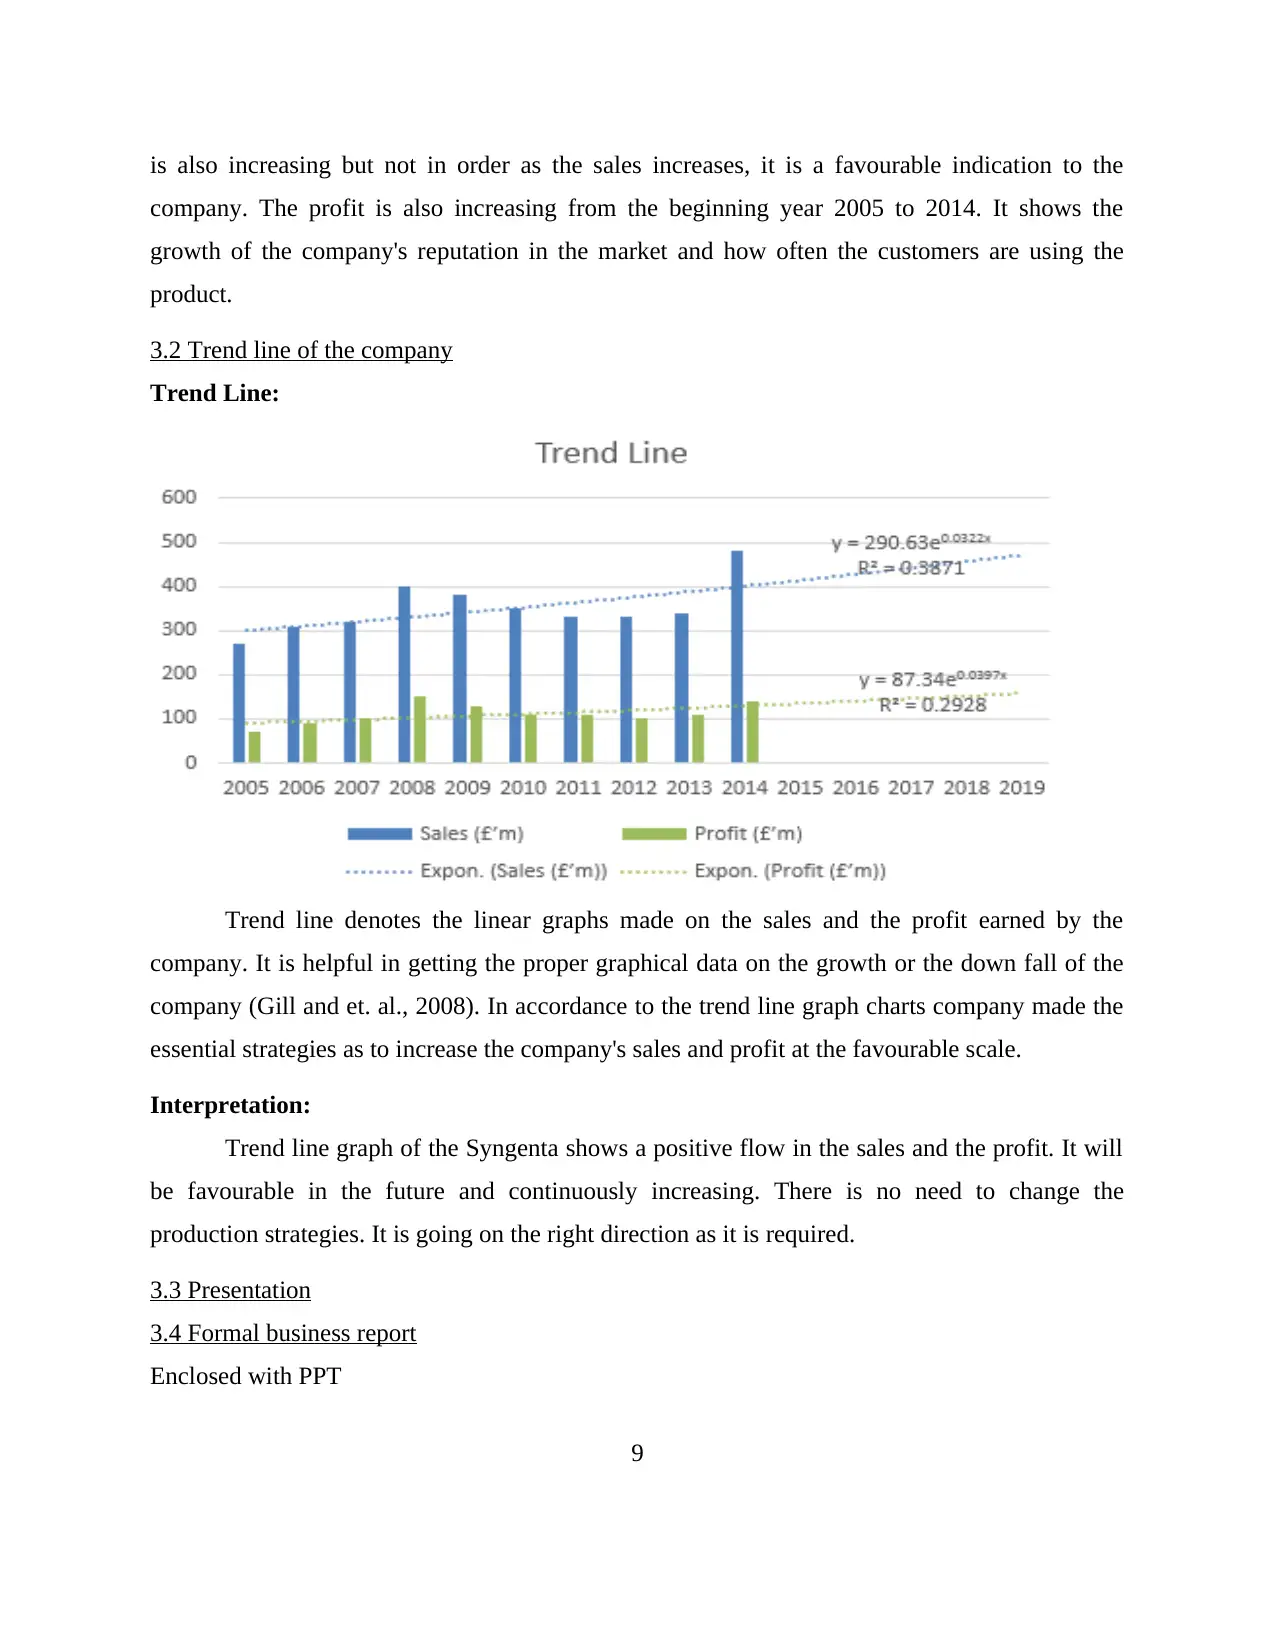
3.2 Trend line of the company
Trend Line:
Trend line denotes the linear graphs made on the sales and the profit earned by the
company. It is helpful in getting the proper graphical data on the growth or the down fall of the
company (Gill and et. al., 2008). In accordance to the trend line graph charts company made the
essential strategies as to increase the company's sales and profit at the favourable scale.
Interpretation:
Trend line graph of the Syngenta shows a positive flow in the sales and the profit. It will
be favourable in the future and continuously increasing. There is no need to change the
production strategies. It is going on the right direction as it is required.
3.3 Presentation
3.4 Formal business report
Enclosed with PPT
9
company. The profit is also increasing from the beginning year 2005 to 2014. It shows the
growth of the company's reputation in the market and how often the customers are using the
product.
3.2 Trend line of the company
Trend Line:
Trend line denotes the linear graphs made on the sales and the profit earned by the
company. It is helpful in getting the proper graphical data on the growth or the down fall of the
company (Gill and et. al., 2008). In accordance to the trend line graph charts company made the
essential strategies as to increase the company's sales and profit at the favourable scale.
Interpretation:
Trend line graph of the Syngenta shows a positive flow in the sales and the profit. It will
be favourable in the future and continuously increasing. There is no need to change the
production strategies. It is going on the right direction as it is required.
3.3 Presentation
3.4 Formal business report
Enclosed with PPT
9
To
Board of Directors
Date: 26/07/2017
Introduction: Amistar in US
Methods: Primary and secondary data being used as sampling, questionnaire, books, journals
and the online sources.
Finding: Assessment of the sales profit and the cost of the company with the help ODF various
calculations by finding mean, mode, median, standard deviation, range, correlation of
coefficient etc.
Conclusion and Recommendation: It has been concluded that the company is having good
growing strength. Further, there should little changes be made as to improve the production of
the Syngenta, that will have the favourable increase in the demand on the product's sales.
TASK 4
4.1 Use of information processing tool
Information processing is useful in manipulation of data from one device to other. For
Amistar launching it is to be done through various techniques on various group of people it can
be through the internal or external source. These are as follows:
Management information system:
This information system helps in generating information’s through the various managers
at the different levels of the management hierarchy. The tactic managers on the launching of
Amistar take decisions as according to the meetings and seminars. Discussed the technology and
the relations with the local parties (Arriagada and et.al., 2009). It helps in generating the fruitful
information which is technically being helpful for the Syngenta. There should be appointment of
the new employees because everyone has innovative ideas that will help in increasing the sales
and profit of the company.
Executive information system:
Execution system is useful in collecting the data within the organisation through the
senior executive and the supporting staff (Arriagada and et.al., 2009). It facilitates the better
10
⊘ This is a preview!⊘
Do you want full access?
Subscribe today to unlock all pages.
Trusted by 1+ million students worldwide
1 out of 20
Related Documents


Your All-in-One AI-Powered Toolkit for Academic Success.
+13062052269
info@desklib.com
Available 24*7 on WhatsApp / Email
![[object Object]](/_next/static/media/star-bottom.7253800d.svg)
Unlock your academic potential
Copyright © 2020–2026 A2Z Services. All Rights Reserved. Developed and managed by ZUCOL.