Business Decision Making: Data Analysis and Report for TUI Company
VerifiedAdded on 2020/01/07
|20
|3936
|271
Report
AI Summary
This report provides a comprehensive analysis of business decision-making within the context of TUI, a tour and travel company. It begins with an introduction to the importance of decision-making in organizational growth and outlines the report's structure, which includes data collection, survey methodology, and questionnaire design. The report delves into primary and secondary data sources, detailing a sampling framework and the use of questionnaires to gather customer preferences, buying behavior, and satisfaction levels. Task 2 focuses on data analysis, employing measures of central tendency such as mean, mode, and median to interpret survey results. The analysis reveals customer demographics, satisfaction levels, travel frequency, and budget preferences, guiding recommendations for tour package development. The report further explores trend line analysis and presents a business presentation and report, culminating in a project plan and evaluation method for launching new tour products. Overall, the report provides valuable insights into data-driven decision-making within the travel industry, emphasizing the importance of customer-centric strategies and market analysis.

BUSINESS DECISION
MAKING
MAKING
Paraphrase This Document
Need a fresh take? Get an instant paraphrase of this document with our AI Paraphraser
Table of Contents
INTRODUCTION 4
TASK 1 4
1.1 Data collection plan 4
1.2 Survey methodology and sampling frame work 5
1.3 Questionnaire 6
TASK 2 7
2.1 Various measures of central tendency 7
2.2 Result Analysis8
2.3 Measurement of dispersion rate of tour 9
2.4 Quartile, percentile and correlation coefficient 9
TASK 3 10
3.1 Data analysis 10
3.2 Trend line Graph 13
3.3 Business Presentation 13
3.4 Business report to develop new product 13
TASK 4 14
4.1 Information processing tool for the launch of a new tour product 14
4.2 Project plan and critical path 15
4.3 Project evaluation method…………………………………………………………....15
CONCLUSION…………………………………………………………………………………16
REFERENCES………………………………………………………………………………….17
17
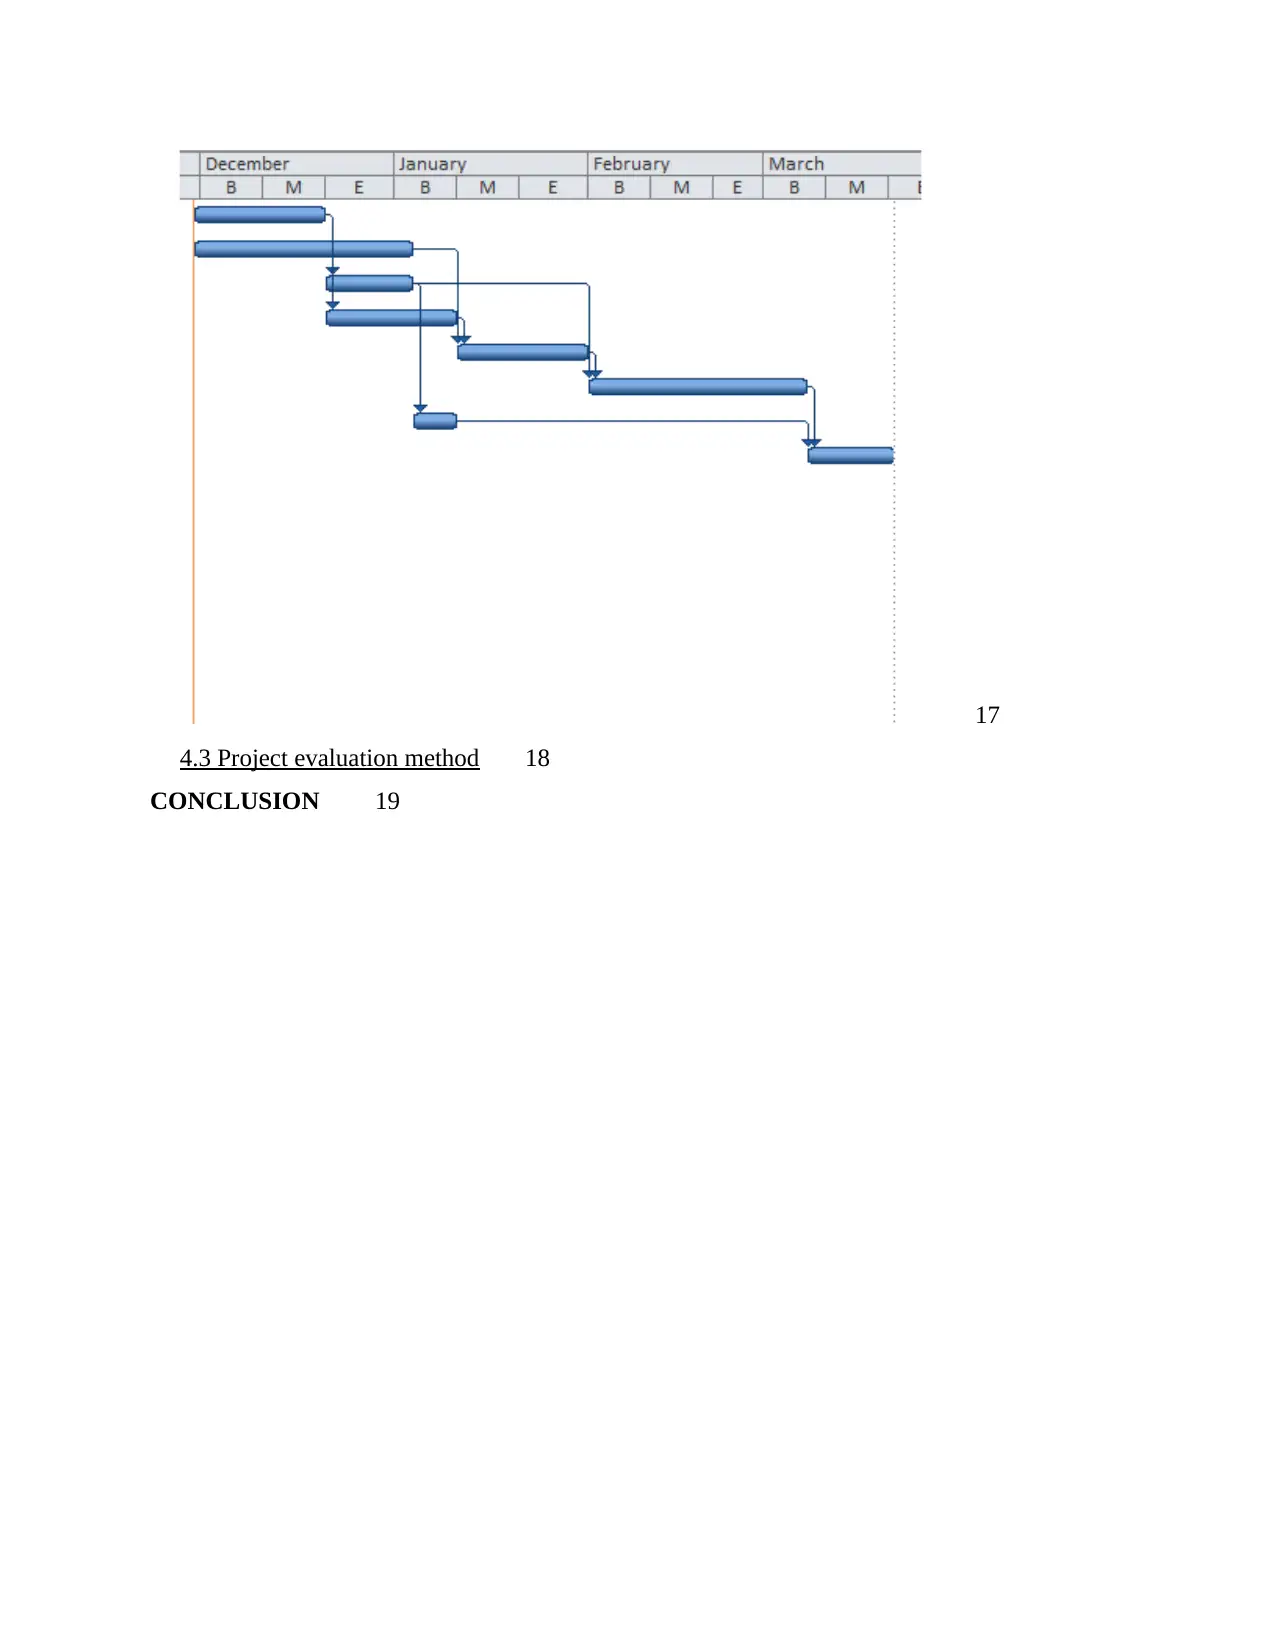
4.3 Project evaluation method 18
CONCLUSION 19
4.3 Project evaluation method 18
CONCLUSION 19
⊘ This is a preview!⊘
Do you want full access?
Subscribe today to unlock all pages.
Trusted by 1+ million students worldwide
INTRODUCTION
The decision making is so important in the future growth of an organization. There are so
many components on the decision should be taken by the authority of business organization such
as assets, liability, investment etc. The right decision-making can help the organization to
achieve its objectives as it has to choose the best option for the organization by which the target
can be achieved. This report is done on the basis of the TUI which is a tour and travel company
and operating internationally. This report have survey methodology and frame of sampling that
relates with the business(Bharadwaj, and et.al., 2013). The primary and secondary sources for
data collection will be discussed in this report so acquiring modern products. The questionnaire
will be done for knowing data about the customer like profile, preference, buying behavior. The
data collection will be done from 90 customers and the study have analysis of that data. To make
sure about the new tour products the calculation of mean, mode, median, standard deviation and
the investment tools will be done in this report which leads to meet with the target effectively.
TASK 1
1.1 Data collection plan
The people of current generation are so very interested in exploring the world. They used to travel
in different places, the attractive destinations. The tour packages that can attract the people are provided
by various tour operators in the current technological generation. The basic needs of the customers,
behavior, new trends in market should be known by the TUI to provide tour packages that can satisfy the
customers, the data collection can be done by two way one is primary and other is secondary(Smith and
et.al., 2017).
Primary sources: It is the first hand data so the researcher collects the information for the
specific subject matter. The reality of market trend, necessities of travelers can be identified by this tool.
There are so many way by which the primary data can be collected such as interview, survey, observation
etc. The major needs of customers has to be identified by the TUI to develop the more attractive tour
packages for them and make sure that what are their expectations(Rasouli and Timmermans, 2014).
The survey can be the best way to collect the details which can help to achieve the desired objective of
the company. The communication between the researcher and customers can be done via email, social
networking sites and other platforms. Questionnaire is helpful to get the same information about
customer. The target population will be sampled as 90 customers, the individual will ask the questions to
them. The questionnaire can help the customer so their feelings, needs, desires can be shared by this. The
Paraphrase This Document
Need a fresh take? Get an instant paraphrase of this document with our AI Paraphraser
people's requirements should be knows to the organization as they can make tour packages
accordingly(Hair and et.al., 2014).
Secondary sources: The existing data can be used by the researcher for the data collection. By
the books, journals, various articles, online source can be used as the secondary sources for collecting the
data. The perception and the behavior of the customers regarding travel can be observed through the
gathered information by the researcher. These methods can help the TUI to get the uncertainties also
according to this information the further plan can be made. The existing researches will tell about the
taste and preference of the customers. The can be considered for making the new designs. The risk can be
evaluated which has been faced by the other organization previously. The uncertainty can be reduced by
making proper plan(Song and et.al., 2017).
1.2 Survey methodology and sampling frame work
Sampling frame work: Basically sampling can be done two methods, its division of its framework is done
in two parts, such as probabilistic and non-probabilistic. The researcher have a aim to identify the
behavior of the people and he also want to know about the desires and requirements of
customers(Gardiner and et.al., 2013). That TUI can make more satisfying tour packages for them. The
probabilistic sampling would be appropriate for achieving that aim. There are so many techniques for the
sampling such as random, stratum etc. the sampling would be best for the current research. The researcher
can have 90 customers with a random approach and whom each one can fill up the questionnaire.
Customer’s preference and the modern trends in the market, these kind of information can be gathered by
the investigator with this approach(Smaliukiene and et.al., 2015).
Survey Methodology: The customer’s preferable things and their needs should be identified by the
researcher to design the tour packages for them. The survey is so helpful to get the relevant information in
which the customer’s needs and their expectation in included. The identification of lacking points in the
existing tour packages can be done by the survey thus, new packages will be made by the TUI’s
manager(De Massis and Kotlar, 2014). That creation of new tour package will help the organization to
enhance their sales percentage and ultimately the profitability will be increased. The survey can be done
by many methods like questionnaire, interviews, documentation review etc. The deep information about
the topic will be gathered by these techniques. The questionnaire is all about the individual have to fill the
questions which will give big amount of information is less time. The interview is the medium in which
the response of the people depends on their knowledge, status, emotional status, and experience. The
present report has been collected the data from the questionnaire which can be helpful to get large data
and information will be reliable(Glavas and Mathews, 2014).
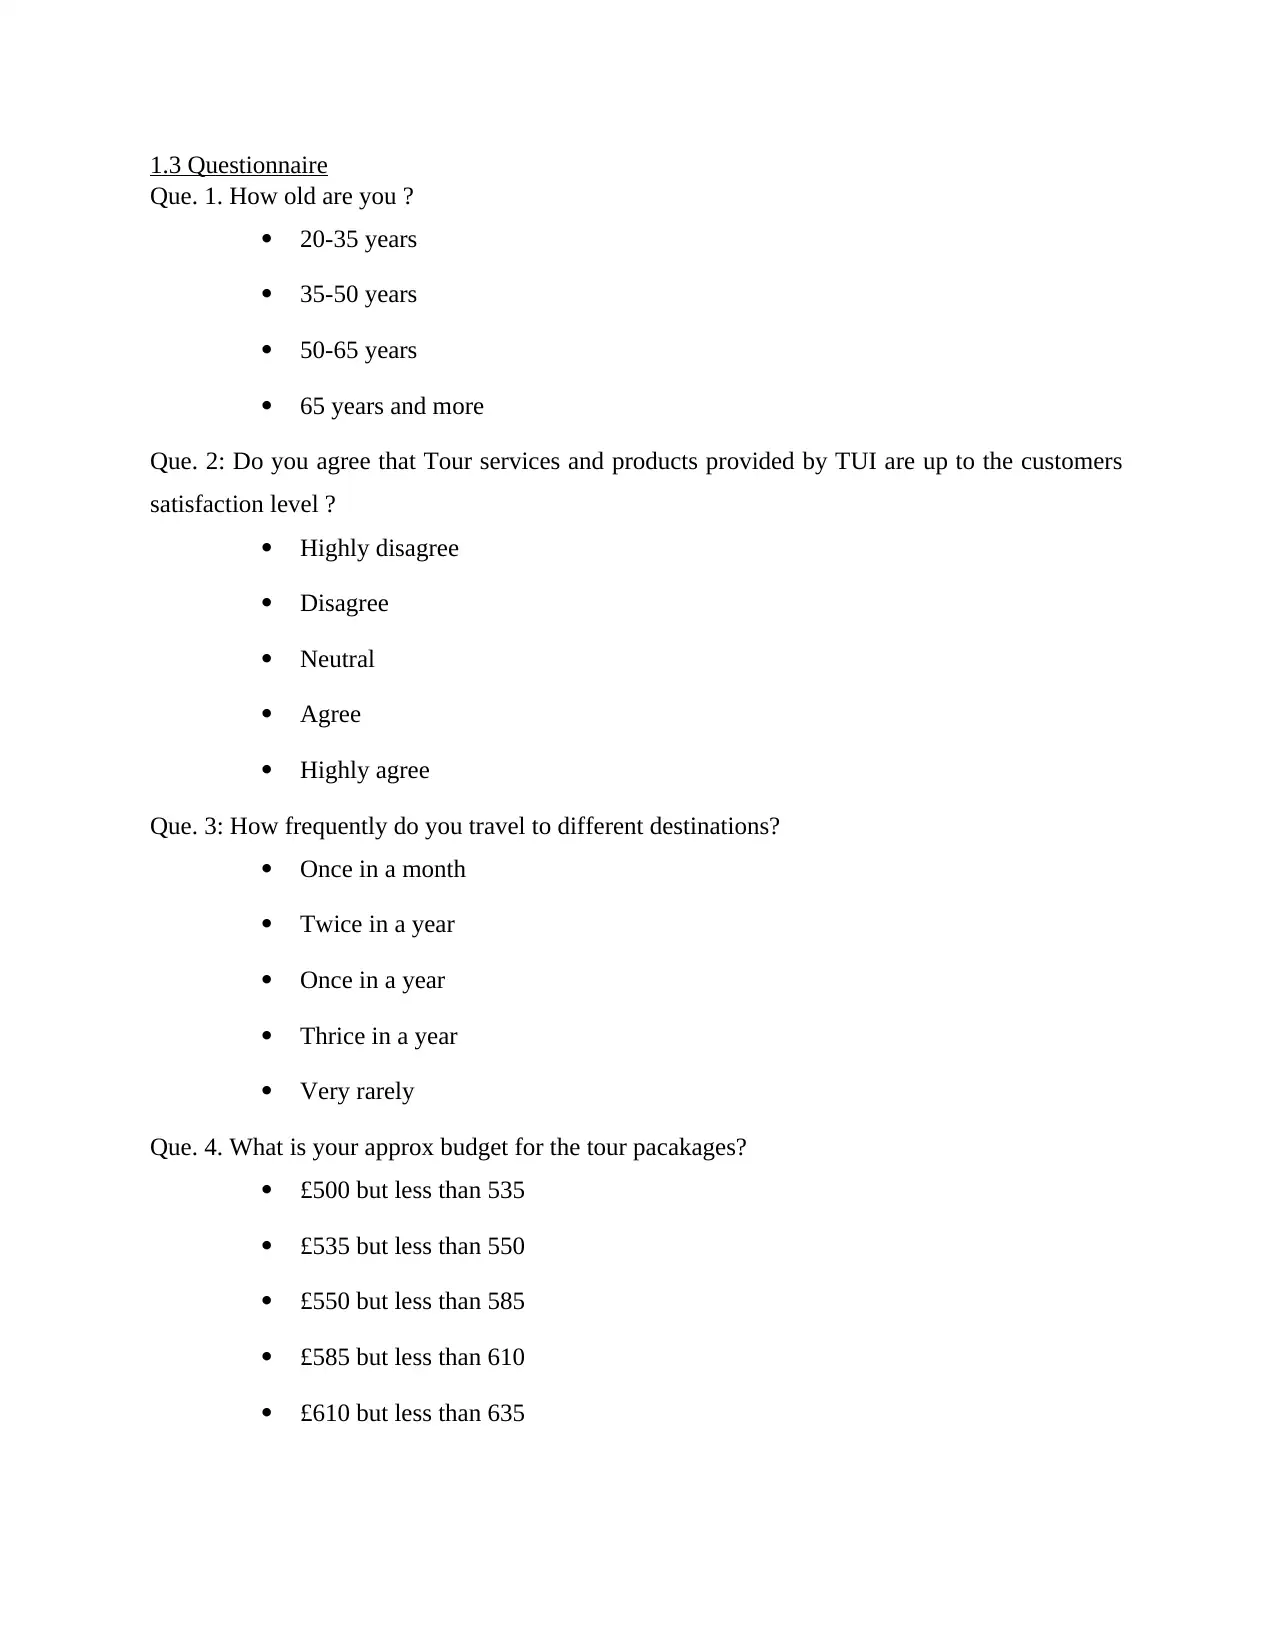
1.3 Questionnaire
Que. 1. How old are you ?
20-35 years
35-50 years
50-65 years
65 years and more
Que. 2: Do you agree that Tour services and products provided by TUI are up to the customers
satisfaction level ?
Highly disagree
Disagree
Neutral
Agree
Highly agree
Que. 3: How frequently do you travel to different destinations?
Once in a month
Twice in a year
Once in a year
Thrice in a year
Very rarely
Que. 4. What is your approx budget for the tour pacakages?
£500 but less than 535
£535 but less than 550
£550 but less than 585
£585 but less than 610
£610 but less than 635
⊘ This is a preview!⊘
Do you want full access?
Subscribe today to unlock all pages.
Trusted by 1+ million students worldwide
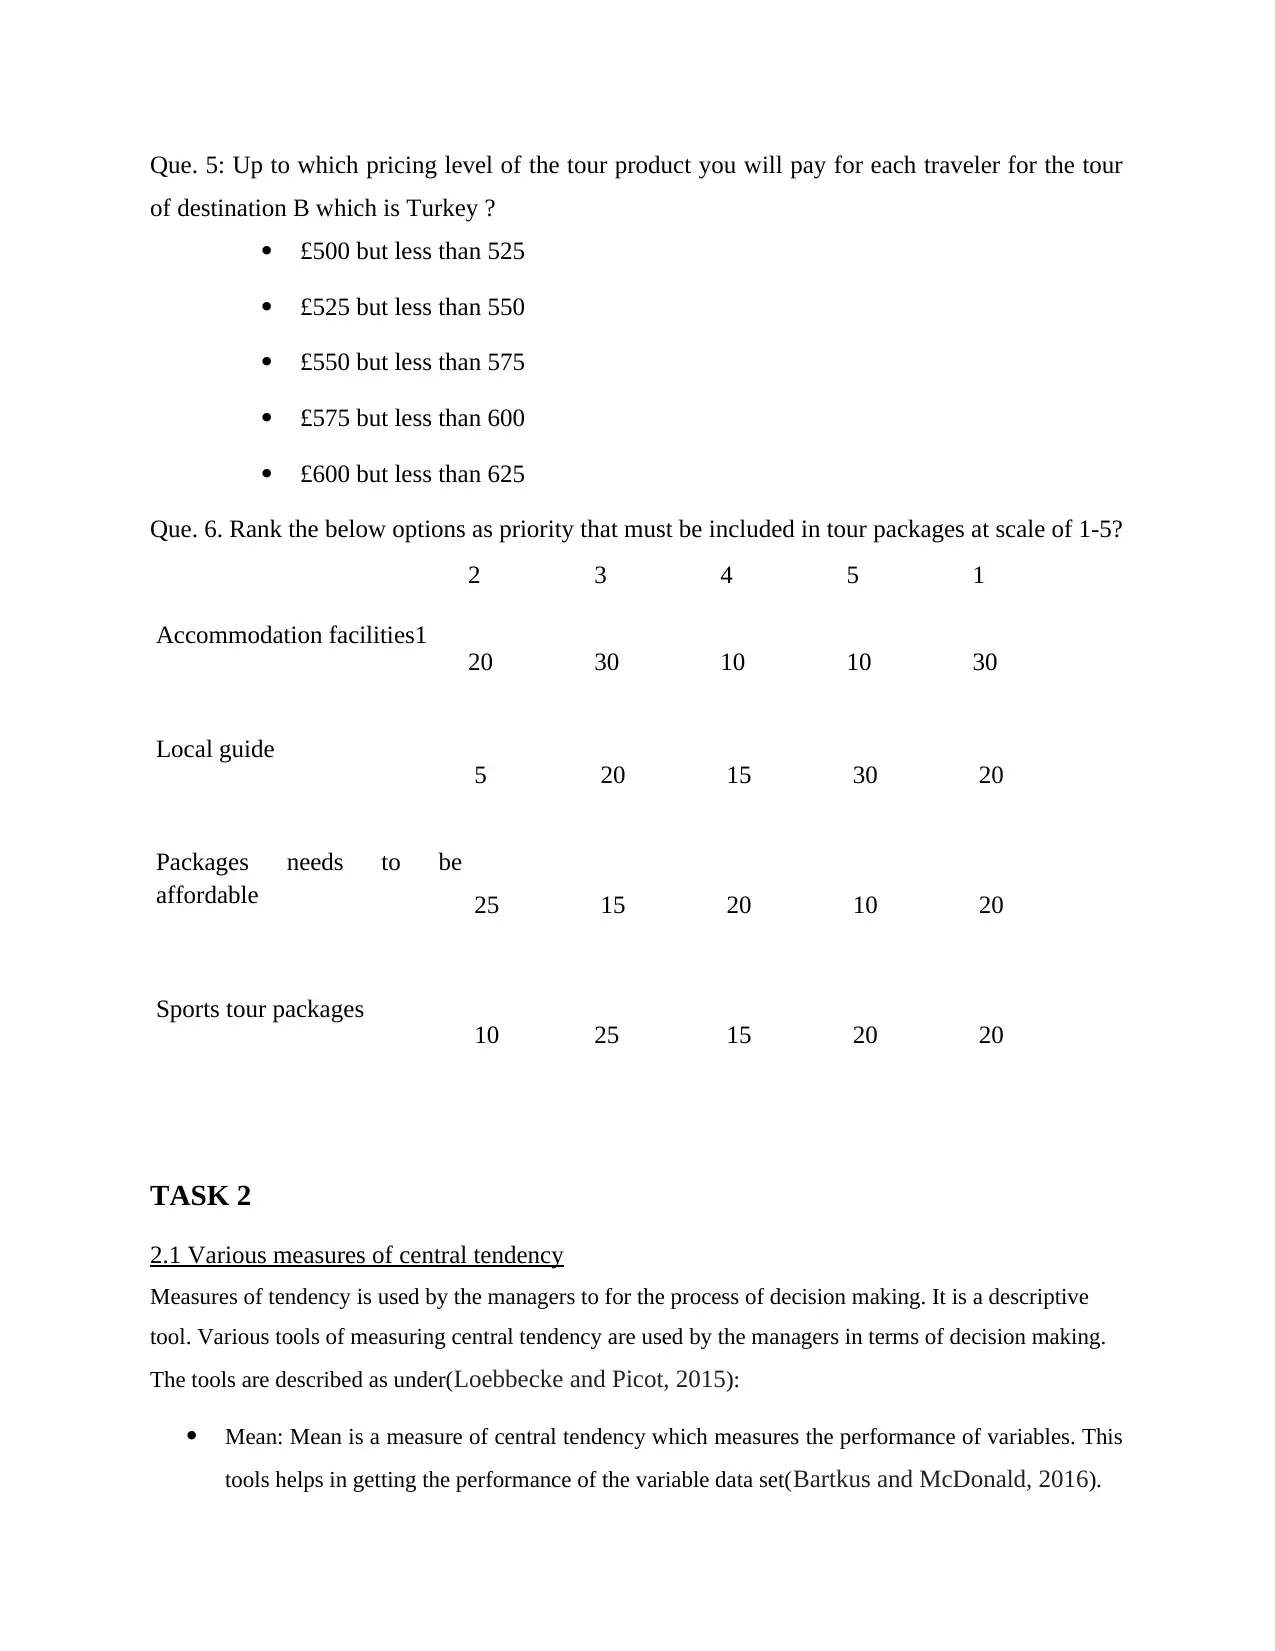
Que. 5: Up to which pricing level of the tour product you will pay for each traveler for the tour
of destination B which is Turkey ?
£500 but less than 525
£525 but less than 550
£550 but less than 575
£575 but less than 600
£600 but less than 625
Que. 6. Rank the below options as priority that must be included in tour packages at scale of 1-5?
2 3 4 5 1
Accommodation facilities1
20 30 10 10 30
Local guide
5 20 15 30 20
Packages needs to be
affordable 25 15 20 10 20
Sports tour packages
10 25 15 20 20
TASK 2
2.1 Various measures of central tendency
Measures of tendency is used by the managers to for the process of decision making. It is a descriptive
tool. Various tools of measuring central tendency are used by the managers in terms of decision making.
The tools are described as under(Loebbecke and Picot, 2015):
Mean: Mean is a measure of central tendency which measures the performance of variables. This
tools helps in getting the performance of the variable data set(Bartkus and McDonald, 2016).
Paraphrase This Document
Need a fresh take? Get an instant paraphrase of this document with our AI Paraphraser
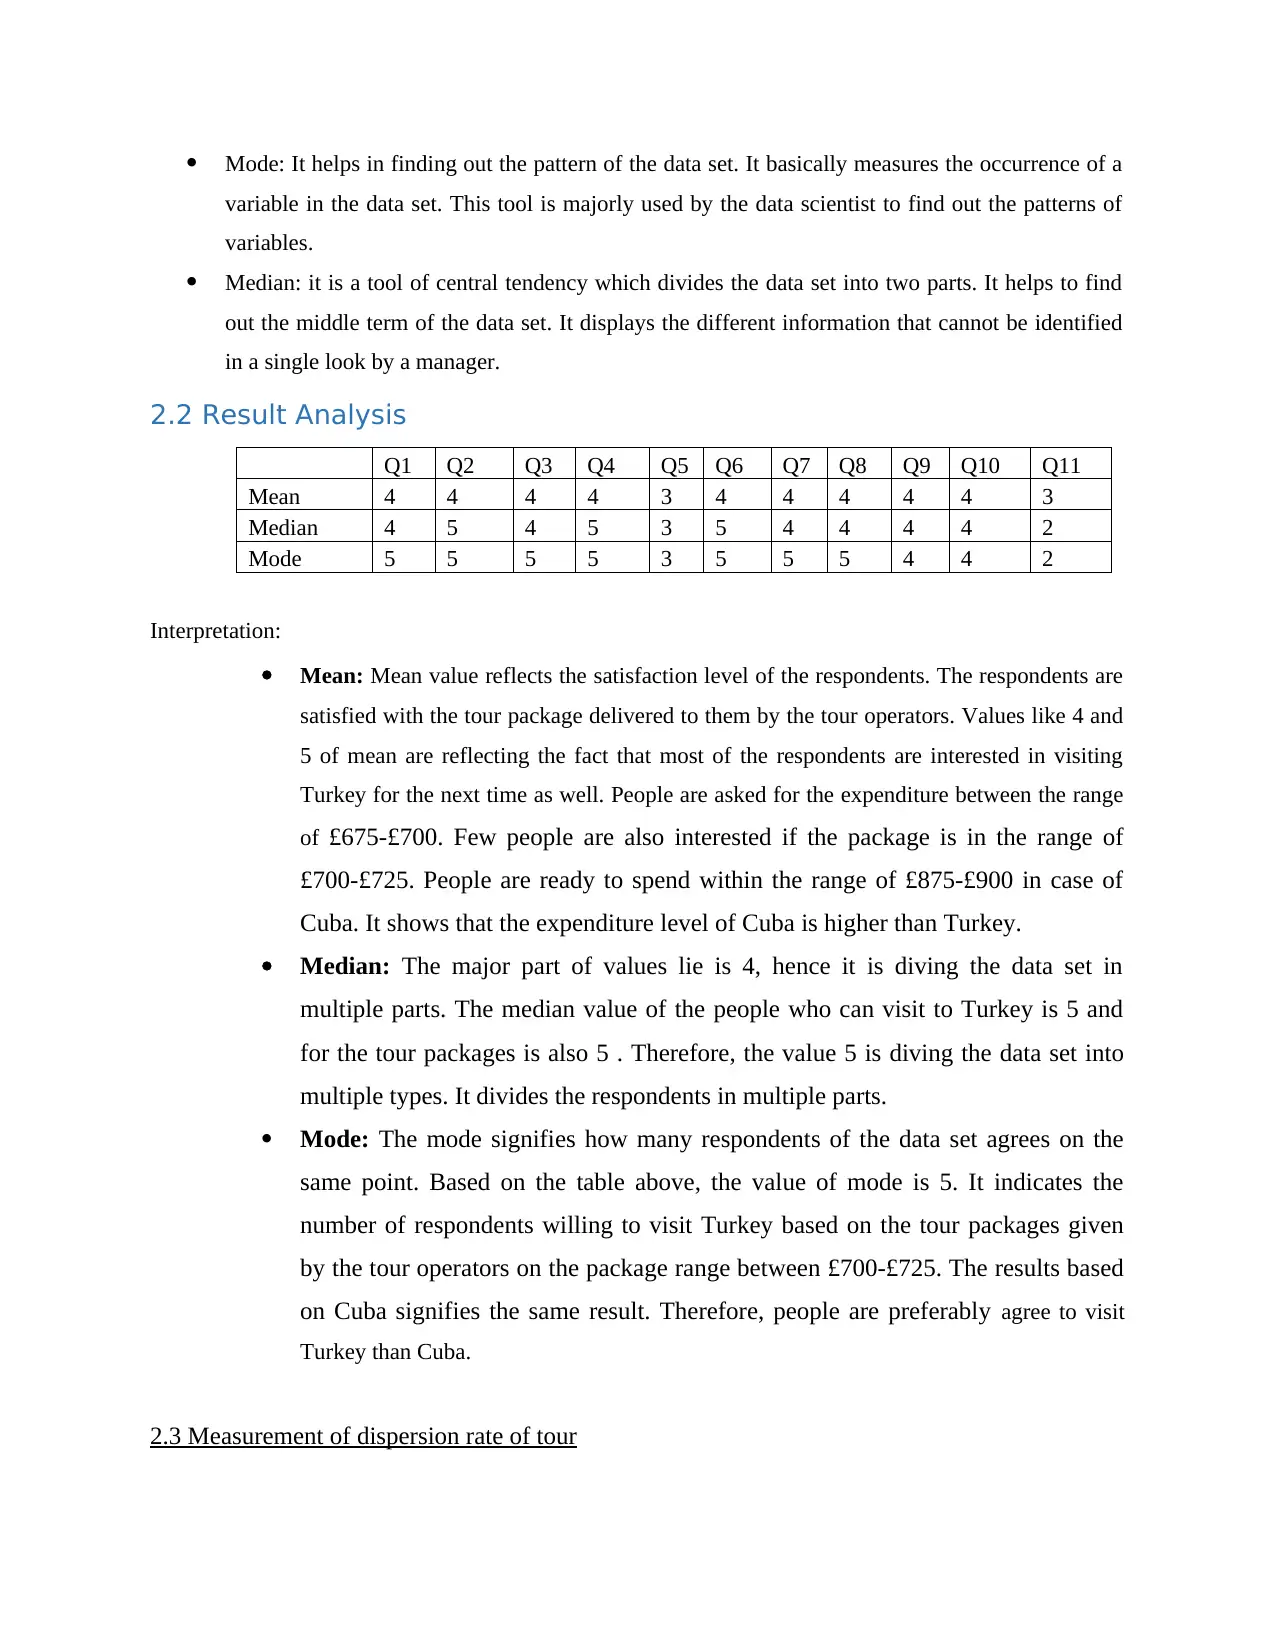
Mode: It helps in finding out the pattern of the data set. It basically measures the occurrence of a
variable in the data set. This tool is majorly used by the data scientist to find out the patterns of
variables.
Median: it is a tool of central tendency which divides the data set into two parts. It helps to find
out the middle term of the data set. It displays the different information that cannot be identified
in a single look by a manager.
2.2 Result Analysis
Q1 Q2 Q3 Q4 Q5 Q6 Q7 Q8 Q9 Q10 Q11
Mean 4 4 4 4 3 4 4 4 4 4 3
Median 4 5 4 5 3 5 4 4 4 4 2
Mode 5 5 5 5 3 5 5 5 4 4 2
Interpretation:
Mean: Mean value reflects the satisfaction level of the respondents. The respondents are
satisfied with the tour package delivered to them by the tour operators. Values like 4 and
5 of mean are reflecting the fact that most of the respondents are interested in visiting
Turkey for the next time as well. People are asked for the expenditure between the range
of £675-£700. Few people are also interested if the package is in the range of
£700-£725. People are ready to spend within the range of £875-£900 in case of
Cuba. It shows that the expenditure level of Cuba is higher than Turkey.
Median: The major part of values lie is 4, hence it is diving the data set in
multiple parts. The median value of the people who can visit to Turkey is 5 and
for the tour packages is also 5 . Therefore, the value 5 is diving the data set into
multiple types. It divides the respondents in multiple parts.
Mode: The mode signifies how many respondents of the data set agrees on the
same point. Based on the table above, the value of mode is 5. It indicates the
number of respondents willing to visit Turkey based on the tour packages given
by the tour operators on the package range between £700-£725. The results based
on Cuba signifies the same result. Therefore, people are preferably agree to visit
Turkey than Cuba.
2.3 Measurement of dispersion rate of tour
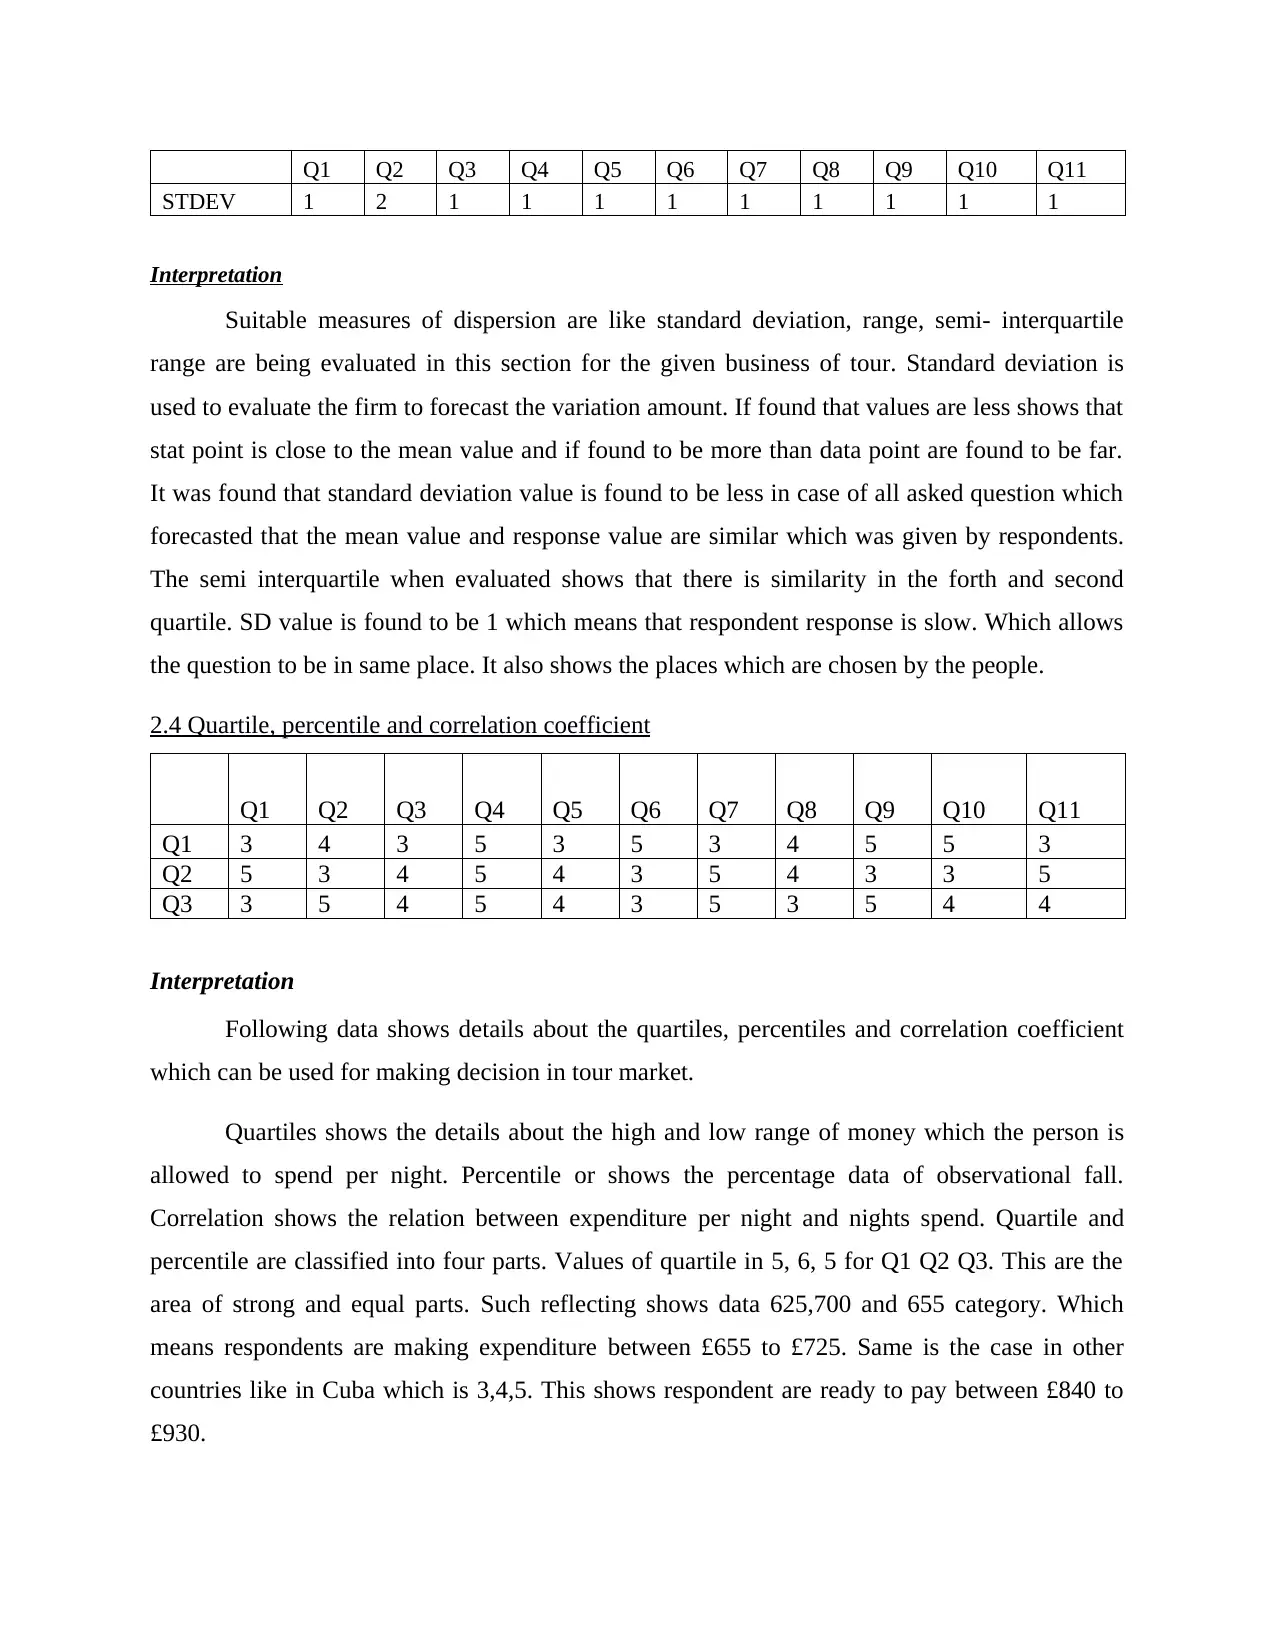
Q1 Q2 Q3 Q4 Q5 Q6 Q7 Q8 Q9 Q10 Q11
STDEV 1 2 1 1 1 1 1 1 1 1 1
Interpretation
Suitable measures of dispersion are like standard deviation, range, semi- interquartile
range are being evaluated in this section for the given business of tour. Standard deviation is
used to evaluate the firm to forecast the variation amount. If found that values are less shows that
stat point is close to the mean value and if found to be more than data point are found to be far.
It was found that standard deviation value is found to be less in case of all asked question which
forecasted that the mean value and response value are similar which was given by respondents.
The semi interquartile when evaluated shows that there is similarity in the forth and second
quartile. SD value is found to be 1 which means that respondent response is slow. Which allows
the question to be in same place. It also shows the places which are chosen by the people.
2.4 Quartile, percentile and correlation coefficient
Q1 Q2 Q3 Q4 Q5 Q6 Q7 Q8 Q9 Q10 Q11
Q1 3 4 3 5 3 5 3 4 5 5 3
Q2 5 3 4 5 4 3 5 4 3 3 5
Q3 3 5 4 5 4 3 5 3 5 4 4
Interpretation
Following data shows details about the quartiles, percentiles and correlation coefficient
which can be used for making decision in tour market.
Quartiles shows the details about the high and low range of money which the person is
allowed to spend per night. Percentile or shows the percentage data of observational fall.
Correlation shows the relation between expenditure per night and nights spend. Quartile and
percentile are classified into four parts. Values of quartile in 5, 6, 5 for Q1 Q2 Q3. This are the
area of strong and equal parts. Such reflecting shows data 625,700 and 655 category. Which
means respondents are making expenditure between £655 to £725. Same is the case in other
countries like in Cuba which is 3,4,5. This shows respondent are ready to pay between £840 to
£930.
⊘ This is a preview!⊘
Do you want full access?
Subscribe today to unlock all pages.
Trusted by 1+ million students worldwide
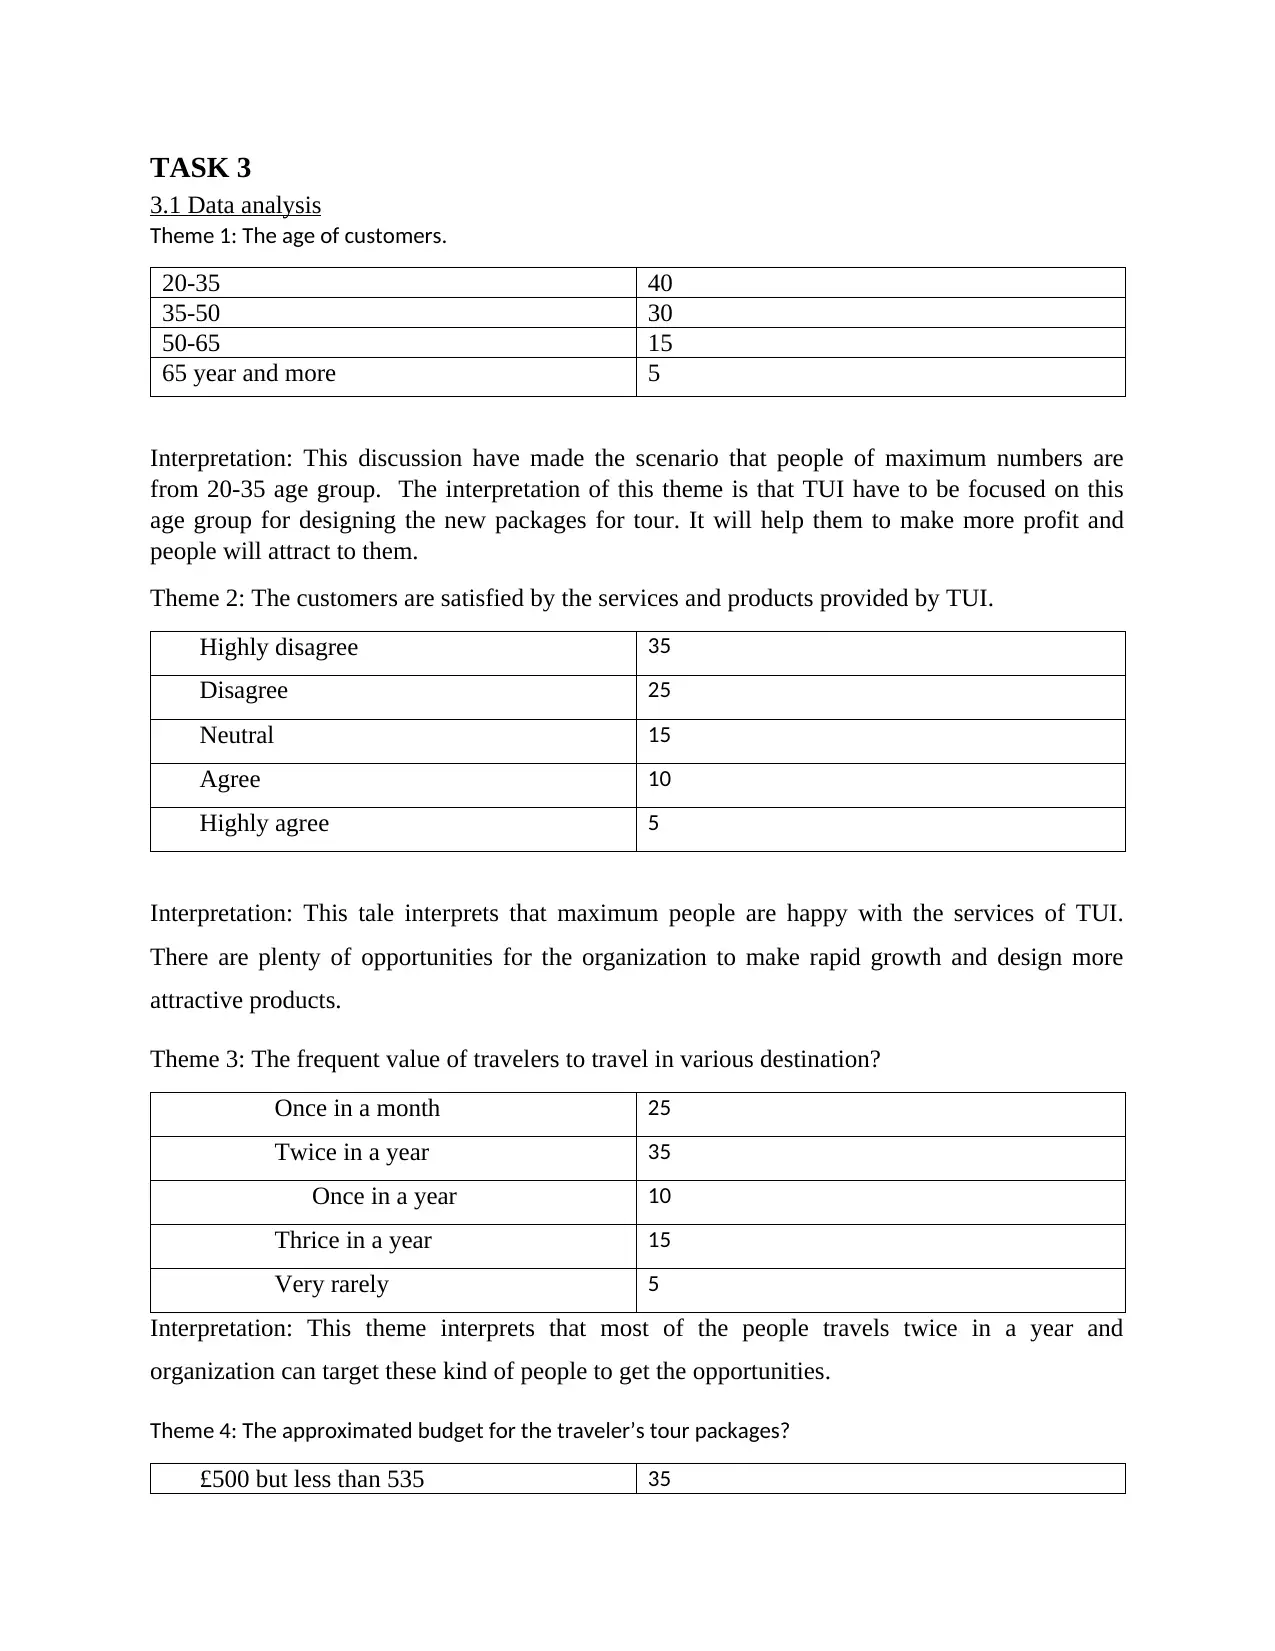
TASK 3
3.1 Data analysis
Theme 1: The age of customers.
20-35 40
35-50 30
50-65 15
65 year and more 5
Interpretation: This discussion have made the scenario that people of maximum numbers are
from 20-35 age group. The interpretation of this theme is that TUI have to be focused on this
age group for designing the new packages for tour. It will help them to make more profit and
people will attract to them.
Theme 2: The customers are satisfied by the services and products provided by TUI.
Highly disagree 35
Disagree 25
Neutral 15
Agree 10
Highly agree 5
Interpretation: This tale interprets that maximum people are happy with the services of TUI.
There are plenty of opportunities for the organization to make rapid growth and design more
attractive products.
Theme 3: The frequent value of travelers to travel in various destination?
Once in a month 25
Twice in a year 35
Once in a year 10
Thrice in a year 15
Very rarely 5
Interpretation: This theme interprets that most of the people travels twice in a year and
organization can target these kind of people to get the opportunities.
Theme 4: The approximated budget for the traveler’s tour packages?
£500 but less than 535 35
Paraphrase This Document
Need a fresh take? Get an instant paraphrase of this document with our AI Paraphraser
£535 but less than 550 20
£550 but less than 585 15
£585 but less than 610 18
£610 but less than 635 2
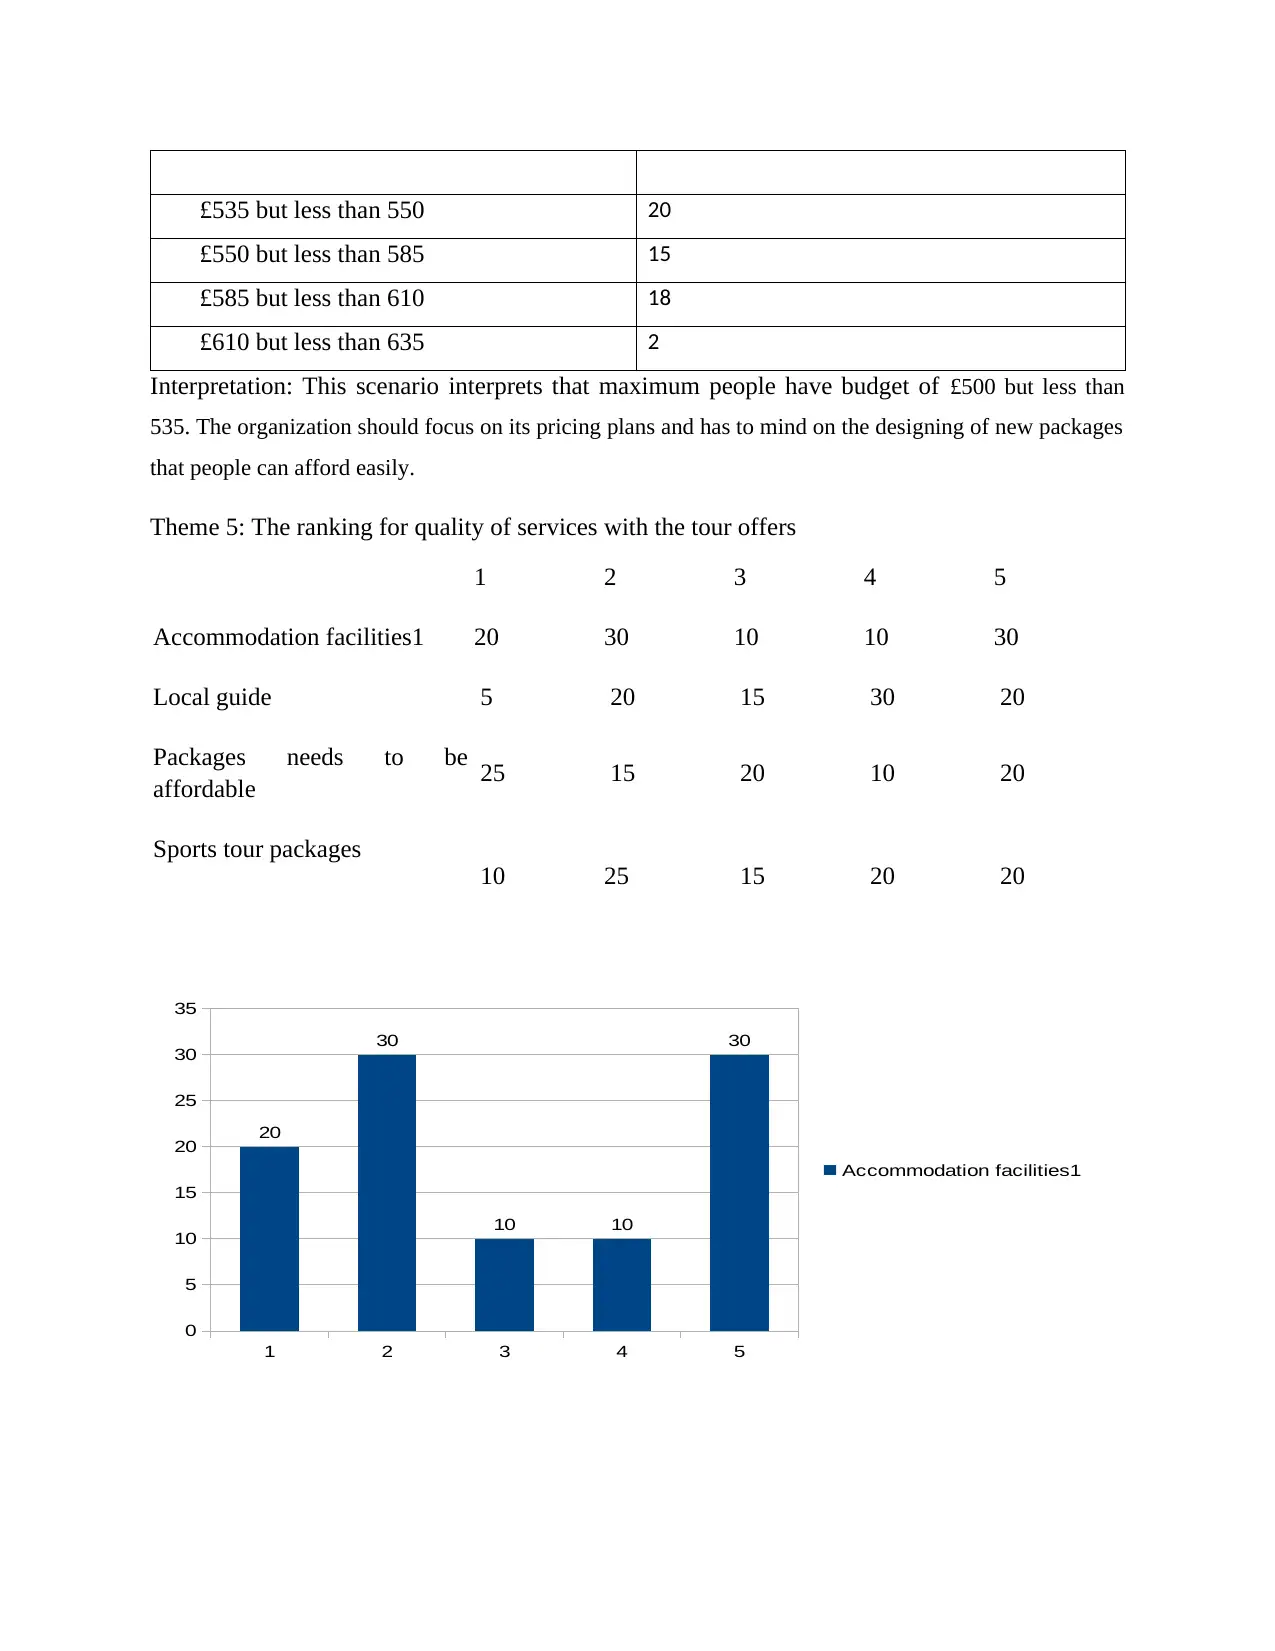
Interpretation: This scenario interprets that maximum people have budget of £500 but less than
535. The organization should focus on its pricing plans and has to mind on the designing of new packages
that people can afford easily.
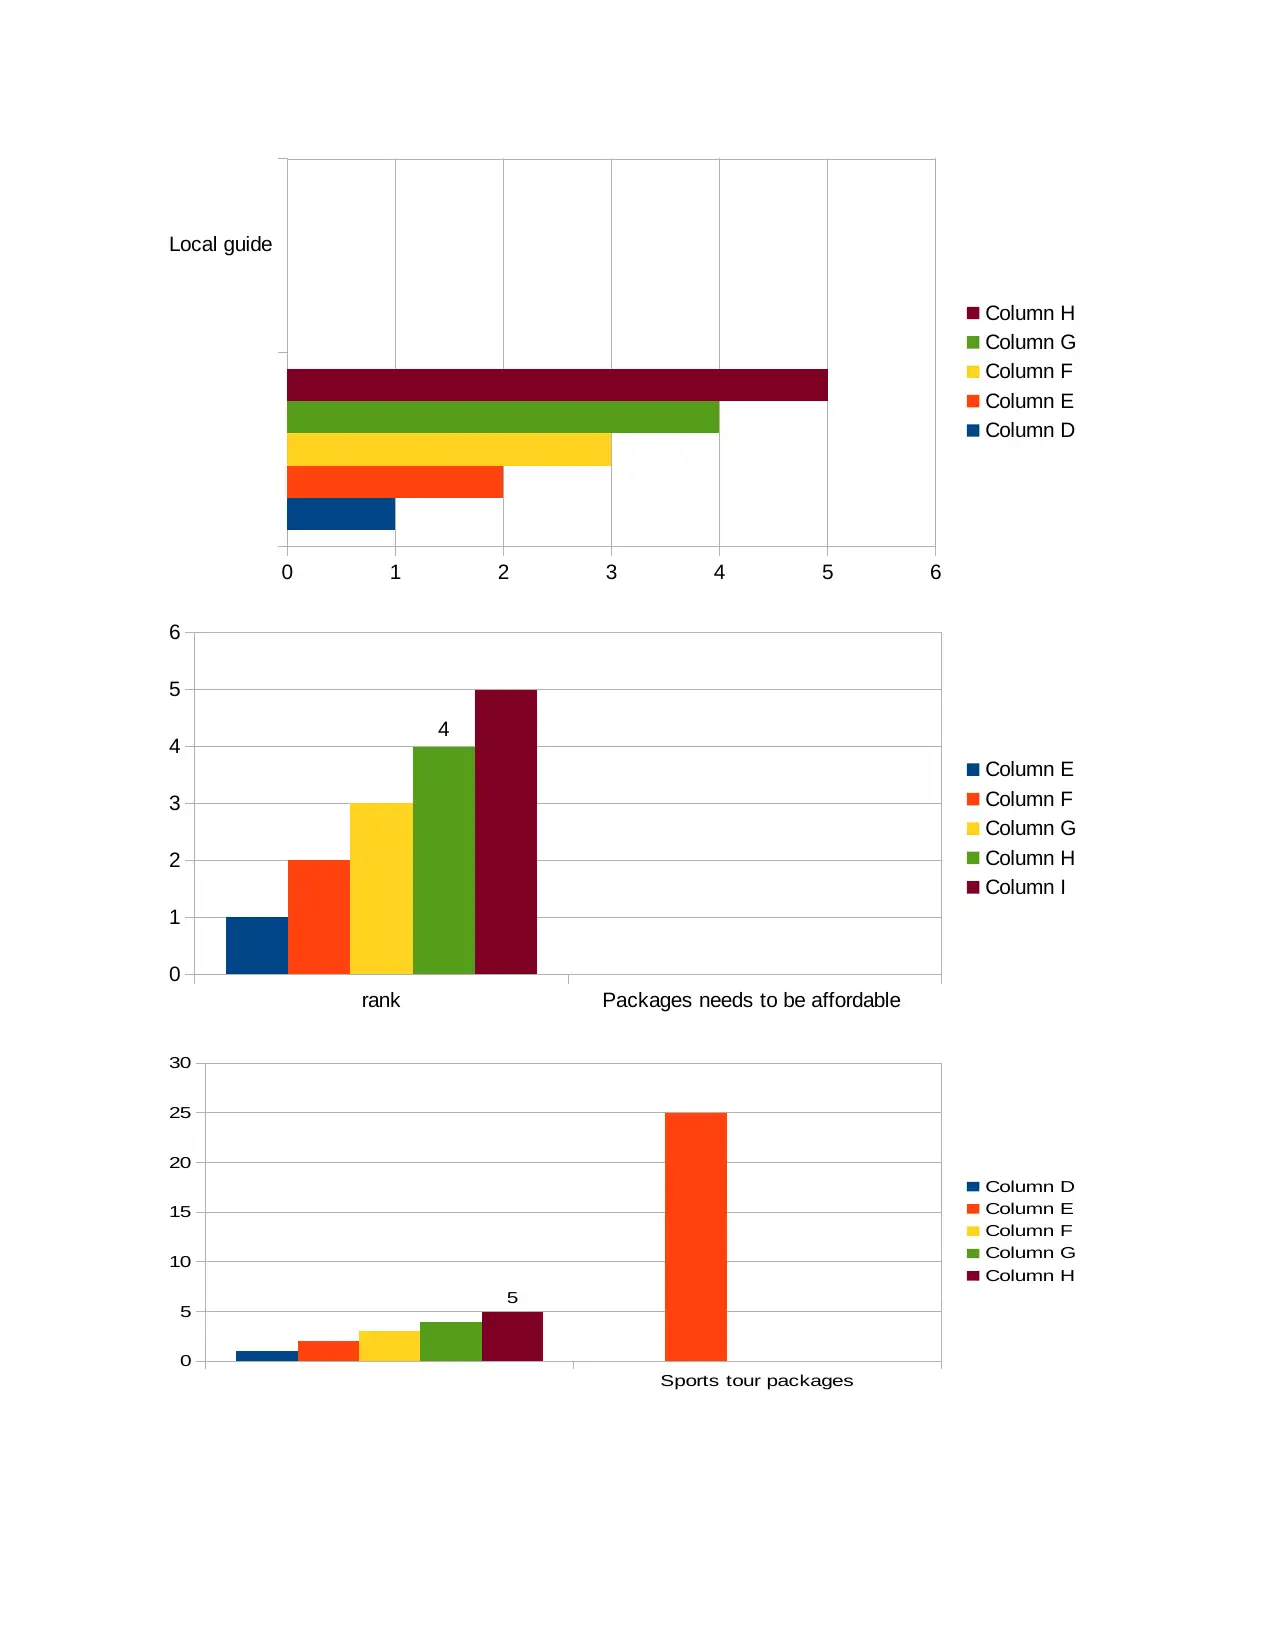
Theme 5: The ranking for quality of services with the tour offers
1 2 3 4 5
Accommodation facilities1 20 30 10 10 30
Local guide 5 20 15 30 20
Packages needs to be
affordable 25 15 20 10 20
Sports tour packages
10 25 15 20 20
1 2 3 4 5
0
5
10
15
20
25
30
35
20
30
10 10
30
Accommodation facilities1
£550 but less than 585 15
£585 but less than 610 18
£610 but less than 635 2
Interpretation: This scenario interprets that maximum people have budget of £500 but less than
535. The organization should focus on its pricing plans and has to mind on the designing of new packages
that people can afford easily.
Theme 5: The ranking for quality of services with the tour offers
1 2 3 4 5
Accommodation facilities1 20 30 10 10 30
Local guide 5 20 15 30 20
Packages needs to be
affordable 25 15 20 10 20
Sports tour packages
10 25 15 20 20
1 2 3 4 5
0
5
10
15
20
25
30
35
20
30
10 10
30
Accommodation facilities1
Local guide
0 1 2 3 4 5 6
Column H
Column G
Column F
Column E
Column D
rank Packages needs to be affordable
0
1
2
3
4
5
6
4
Column E
Column F
Column G
Column H
Column I
Sports tour packages
0
5
10
15
20
25
30
5
Column D
Column E
Column F
Column G
Column H
0 1 2 3 4 5 6
Column H
Column G
Column F
Column E
Column D
rank Packages needs to be affordable
0
1
2
3
4
5
6
4
Column E
Column F
Column G
Column H
Column I
Sports tour packages
0
5
10
15
20
25
30
5
Column D
Column E
Column F
Column G
Column H
⊘ This is a preview!⊘
Do you want full access?
Subscribe today to unlock all pages.
Trusted by 1+ million students worldwide
1 out of 20
Related Documents


Your All-in-One AI-Powered Toolkit for Academic Success.
+13062052269
info@desklib.com
Available 24*7 on WhatsApp / Email
![[object Object]](/_next/static/media/star-bottom.7253800d.svg)
Unlock your academic potential
Copyright © 2020–2026 A2Z Services. All Rights Reserved. Developed and managed by ZUCOL.