Comprehensive Report: Business Decision Making at UKCBC, Data Analysis
VerifiedAdded on 2020/06/06
|29
|5640
|100
Report
AI Summary
This report provides a comprehensive analysis of business decision-making processes at UKCBC. It begins with an introduction to decision-making and its importance, followed by a detailed discussion of the methodology used, including survey planning, methodology, and questionnaire design. The report then delves into data analysis, covering the estimation of data using mean, median, and mode, as well as dispersion analysis and quartile calculations. Graphical presentations and trend line forecasting are used to visualize and predict future trends. Furthermore, the report explores information processing tools, project planning techniques, and investment appraisal methods. The report concludes with a summary of findings, including recommendations for improving services and making informed business decisions for UKCBC. The report also includes tables, illustrations, and references to support the analysis.

BUSINESS DECISION
MAKING
MAKING
Paraphrase This Document
Need a fresh take? Get an instant paraphrase of this document with our AI Paraphraser
TABLE OF CONTENTS
INTRODUCTION...........................................................................................................................1
TASK 1............................................................................................................................................1
1.1 (a) Plan for conducting survey .............................................................................................1
1.2 (b) Survey methodology and sampling framework...............................................................2
1.3 (c) Questionnaire for conducting survey..............................................................................3
TASK 2............................................................................................................................................5
2.1 (a) Estimation on collected data............................................................................................5
2.2 (b) Mean, median and mode of collected data......................................................................6
2.3 (c) Dispersion on collected data............................................................................................8
2.4 (d) Quartile and correlation of collected data.......................................................................9
TASK 3..........................................................................................................................................10
3.1 (a) Graphical presentations on collected data.....................................................................10
3.2 (b) Trend line method for forecasting.................................................................................15
3.3 (c) Power point presentation of collected data....................................................................17
3.4 Business report....................................................................................................................17
TASK 4..........................................................................................................................................17
4.1 (a) Information processing tools.........................................................................................17
4.2 (b) Project planning tools....................................................................................................18
4.3 (c) Investment appraisal techniques for decision making..................................................20
CONCLUSION..............................................................................................................................22
REFERENCE.................................................................................................................................24
INDEX OF TABLES
Table 1: Planning for data collection...............................................................................................1
Table 2: Quartiles of collected data.................................................................................................9
Table 1: Planning for data collection...............................................................................................1
Table 2: Quartiles of collected data.................................................................................................9
⊘ This is a preview!⊘
Do you want full access?
Subscribe today to unlock all pages.
Trusted by 1+ million students worldwide
ILLUSTRATION INDEX
Illustration 1: Formula used for calculating mean...........................................................................5
Illustration 2: Formula use d for evaluating median of odd numbers..............................................6
Illustration 3: Formula use d for evaluating median of even numbers............................................6
Illustration 4: Formula used for calculation of standard deviation..................................................8
Illustration 5: Number of students belonged to campus................................................................11
Illustration 6: Satisfaction level of respondents with services of UKCBC....................................12
Illustration 7: Students' views on teaching services of the organisation........................................13
Illustration 8: Environment of the entity........................................................................................14
Illustration 9: Other facilities of UKCBC......................................................................................15
Illustration 10: Trend line for forecasting on admissions..............................................................16
Illustration 11: Project plan with time line....................................................................................19
Illustration 12: Gantt chart.............................................................................................................19
Illustration 13: Network diagram as project plan..........................................................................20
Illustration 14: NPV ......................................................................................................................21
Illustration 15: IRR........................................................................................................................22
Paraphrase This Document
Need a fresh take? Get an instant paraphrase of this document with our AI Paraphraser
INTRODUCTION
Decision making is crucial for managing entire operations and improving efficiency of an
entity. In accordance with this, a systematic planning procedure is created to meet the
organisational goals efficiently. Present report is based on understanding different tools of
decision making for UKCBC which is going to be reviewed by Quality Assurance Agency
(QAA) in the upcoming months. It is college of UK provide courses
BBA/Bcom/BA/BSC/MBA/MCA/MA and campus faculties. In this regard, data collection and
sampling methods are discussed for analysing students' satisfaction level with college's services.
Including this, estimation on the collected data can also be identified in terms of evaluating
mean, median and mode. Likewise, presentation on collected data is recognised in this
assignment. Moreover, information processing techniques for sharing data and further decision
making process will be introduced. Along with this, investment appraisal techniques are
highlighted for the college. However, significance of decision making and tools related for
processing are understood here as well.
TASK 1
1.1 (a) Plan for conducting survey
Data collection is a process of analysing actual market and business performance of
entity. On which, variety of ideas generated for decision making and increasing efficiency.
However, data is collected at primary and secondary level for which appropriate planning is
created to increase profit level. In accordance with this, primary data collection includes
conducting survey, face to face interview and different other methods for analysing the actual
performance (Craft, 2013). While, for secondary data collection information are collected
through ready and prepared such as; reading articles in newspaper, magazines, social networking
sites and so on.
According to the given case scenario, UKCBC is going to conduct survey with its
students regarding their satisfaction with entity's services (García and Conde, 2014. In this
process, researcher is to select 20 students of the entity for analysing their satisfaction level with
its services. In accordance with this, planning for conducting survey is created as follows:
Table 1: Planning for data collection
Survey related to Analysing students' views with courses and campus facilities of
UKCBC.
Location College auditorium
Data collection method Primary data collection
Sampling method Random sampling (selecting 20 students from different campuses
randomly)
Estimated expenses 600-800
Time frame 2-3 weeks
In data collection process, researcher is to select 20 students from different campuses as;
science, arts and commerce. Therefore, respondents' satisfaction level with services of UKCBC
in terms of teaching, campus and environment. On which, variety of ideas can be identified for
maximizing their satisfaction and maintaining for longer time period.
1.2 (b) Survey methodology and sampling framework
Survey methodology:
Survey is an approach of identifying market and business performance of the organisation
done through asking questions face-to face, online survey, people's attraction towards services
and so on (Ginevičius and Podviezko, 2013). In this regard, investigator is to survey with college
students by asking questions as regarding their satisfaction.
Sampling framework:
It is a structural framework for selecting participants to conduct survey and identifying its
actual performance. It is of different kinds that can be understood as: Systematic sampling: Under this sampling method, respondents are chosen
systematically or in sequence (Gu and et.al., 2013). For example: choosing one by one,
one alternate, in even or odd numbers, etc. Random sampling: In accordance with this, respondents are selected randomly where no
planning is created to choose them alternatively. Likewise, for conducting survey in
⊘ This is a preview!⊘
Do you want full access?
Subscribe today to unlock all pages.
Trusted by 1+ million students worldwide
UKCBC, researcher is to select 20 students randomly for identifying their views on its
campus facilities and environment.
Cluster sampling: This sampling method is for conducting survey in group/cluster (Hill
and et.al., 2013). By which, variety of ideas are generated for improving services and
maximizing satisfaction level of people at higher level.
Thus, sampling and survey methods are effective for data collection on which further
decisions are made to improve efficiency of entity. However, different tools are recognised for
implementing activities and effective future planning.
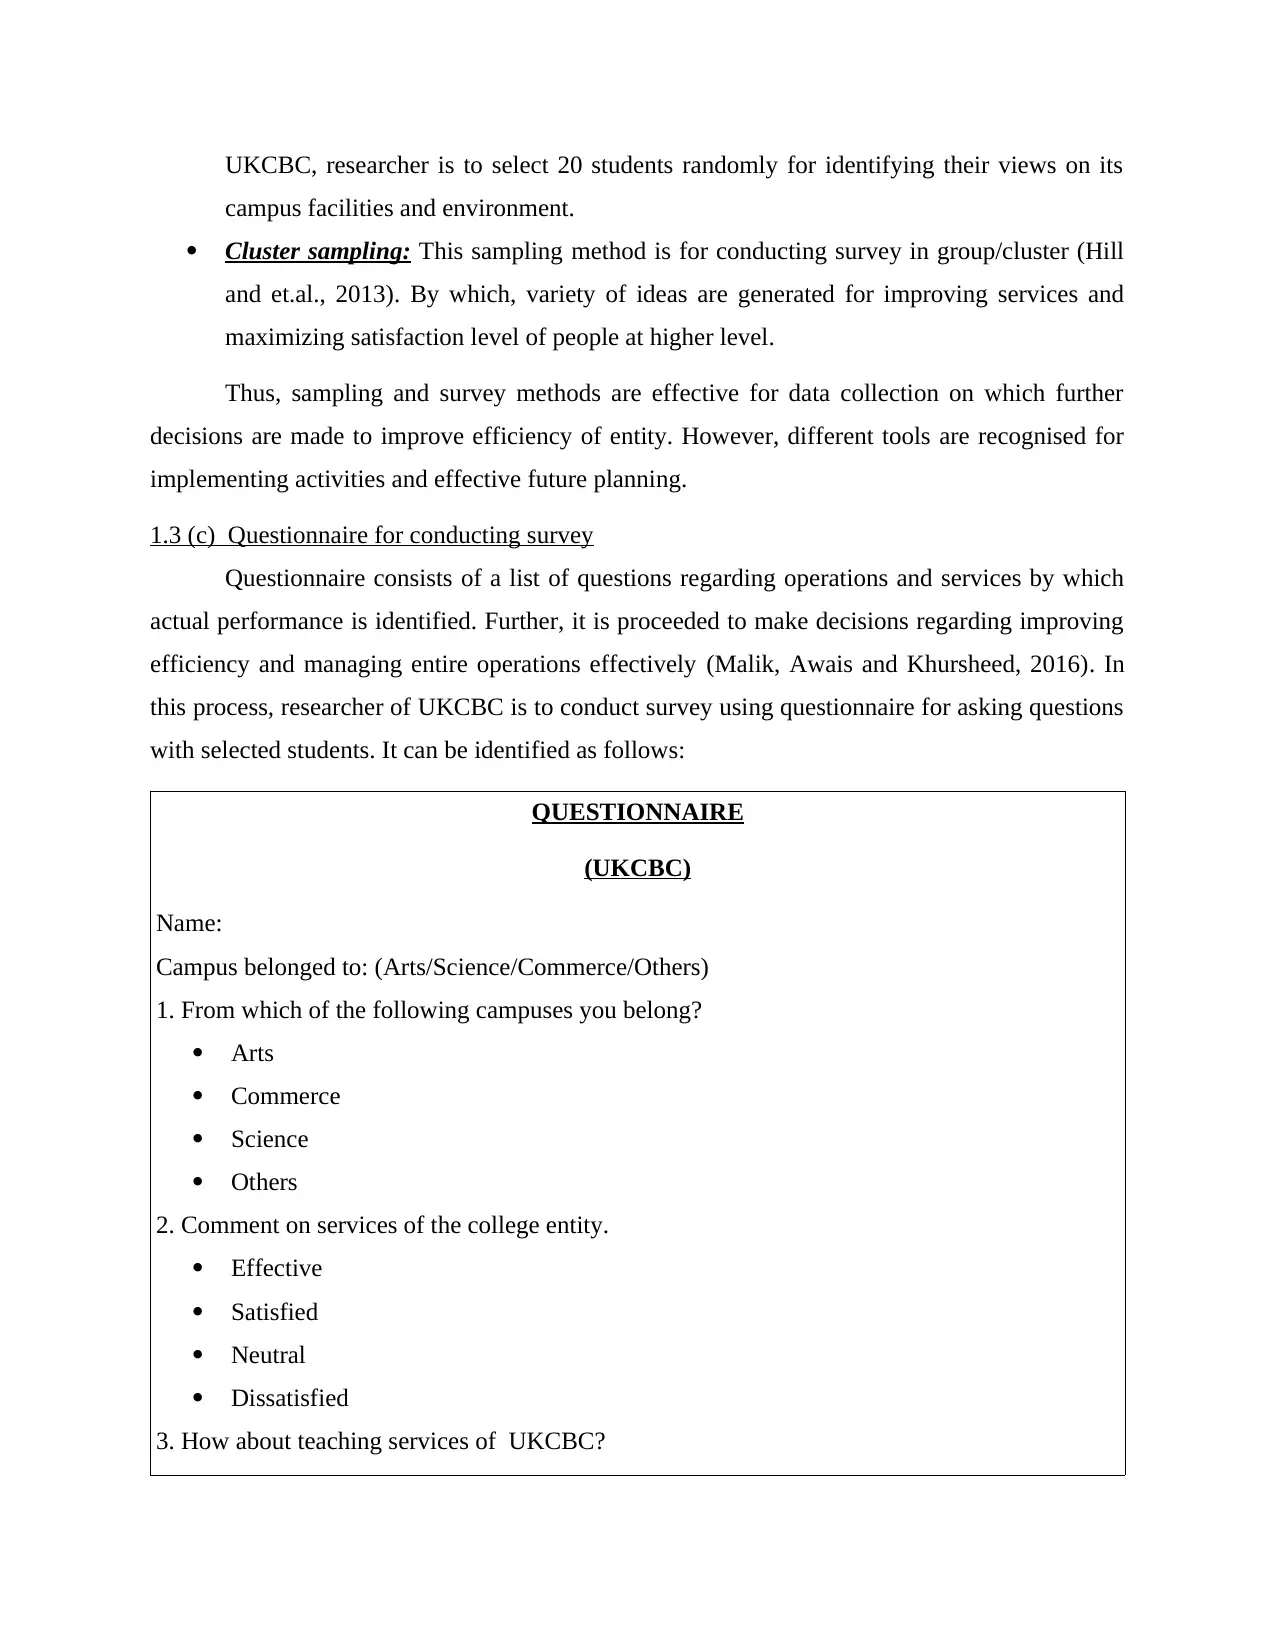
1.3 (c) Questionnaire for conducting survey
Questionnaire consists of a list of questions regarding operations and services by which
actual performance is identified. Further, it is proceeded to make decisions regarding improving
efficiency and managing entire operations effectively (Malik, Awais and Khursheed, 2016). In
this process, researcher of UKCBC is to conduct survey using questionnaire for asking questions
with selected students. It can be identified as follows:
QUESTIONNAIRE
(UKCBC)
Name:
Campus belonged to: (Arts/Science/Commerce/Others)
1. From which of the following campuses you belong?
Arts
Commerce
Science
Others
2. Comment on services of the college entity.
Effective
Satisfied
Neutral
Dissatisfied
3. How about teaching services of UKCBC?
campus facilities and environment.
Cluster sampling: This sampling method is for conducting survey in group/cluster (Hill
and et.al., 2013). By which, variety of ideas are generated for improving services and
maximizing satisfaction level of people at higher level.
Thus, sampling and survey methods are effective for data collection on which further
decisions are made to improve efficiency of entity. However, different tools are recognised for
implementing activities and effective future planning.
1.3 (c) Questionnaire for conducting survey
Questionnaire consists of a list of questions regarding operations and services by which
actual performance is identified. Further, it is proceeded to make decisions regarding improving
efficiency and managing entire operations effectively (Malik, Awais and Khursheed, 2016). In
this process, researcher of UKCBC is to conduct survey using questionnaire for asking questions
with selected students. It can be identified as follows:
QUESTIONNAIRE
(UKCBC)
Name:
Campus belonged to: (Arts/Science/Commerce/Others)
1. From which of the following campuses you belong?
Arts
Commerce
Science
Others
2. Comment on services of the college entity.
Effective
Satisfied
Neutral
Dissatisfied
3. How about teaching services of UKCBC?
Paraphrase This Document
Need a fresh take? Get an instant paraphrase of this document with our AI Paraphraser
Good
Excellent
Neutral
Dissatisfied
4. How is teachers' behaviour with students during guidance in UKCBC?
Good
Effective
Bad
5. Comment on environment of the entity.
Positive and friendly
Normal
Requires to be improved
6. In your opinion, is UKCBC work for physical and mental development of an individual
student?
Yes
No
7. How about library and gaming facilities provided by organisation?
Effective
Satisfied
Dissatisfied
8. According to you, which of the following facilities of entity is required to be improved?
Teaching
Library and gaming
Organising additional curriculum activities
Environment
Campus and canteen facilities
9. Do you recommend your friends and family for college courses of UKCBC?
Yes
No
10. Recommend suggestions for improving facilities of the entity _______________________
TASK 2
2.1 (a) Estimation on collected data
Researcher asks questions with 20 randomly selected students of UKCBC in context to
its facilities and environment (Marshall and et.al., 2016). In this regard, estimation on collected
data is done through evaluating mean, median and mode. However, these three terms can be
understood as follows:
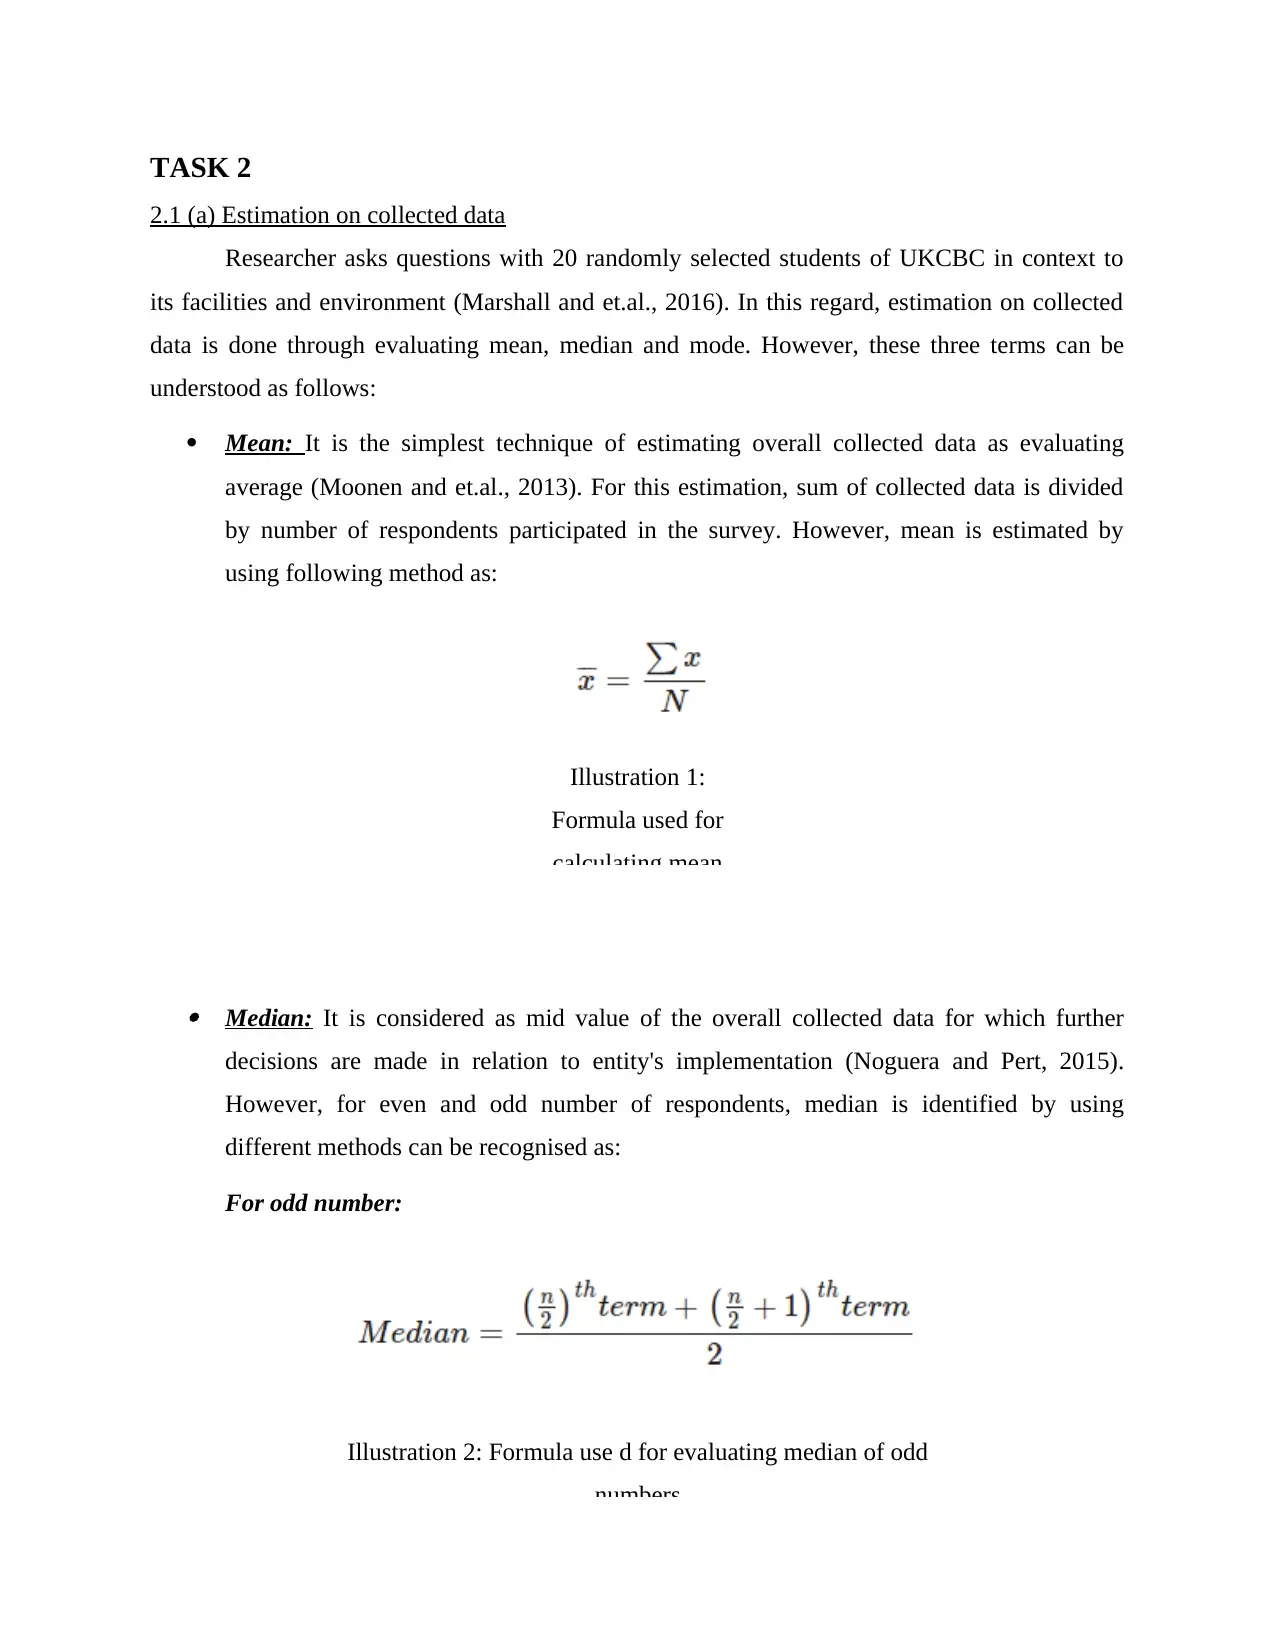
Mean: It is the simplest technique of estimating overall collected data as evaluating
average (Moonen and et.al., 2013). For this estimation, sum of collected data is divided
by number of respondents participated in the survey. However, mean is estimated by
using following method as:
Illustration 1:
Formula used for
calculating mean
Median: It is considered as mid value of the overall collected data for which further
decisions are made in relation to entity's implementation (Noguera and Pert, 2015).
However, for even and odd number of respondents, median is identified by using
different methods can be recognised as:
For odd number:
Illustration 2: Formula use d for evaluating median of odd
numbers
2.1 (a) Estimation on collected data
Researcher asks questions with 20 randomly selected students of UKCBC in context to
its facilities and environment (Marshall and et.al., 2016). In this regard, estimation on collected
data is done through evaluating mean, median and mode. However, these three terms can be
understood as follows:
Mean: It is the simplest technique of estimating overall collected data as evaluating
average (Moonen and et.al., 2013). For this estimation, sum of collected data is divided
by number of respondents participated in the survey. However, mean is estimated by
using following method as:
Illustration 1:
Formula used for
calculating mean
Median: It is considered as mid value of the overall collected data for which further
decisions are made in relation to entity's implementation (Noguera and Pert, 2015).
However, for even and odd number of respondents, median is identified by using
different methods can be recognised as:
For odd number:
Illustration 2: Formula use d for evaluating median of odd
numbers
⊘ This is a preview!⊘
Do you want full access?
Subscribe today to unlock all pages.
Trusted by 1+ million students worldwide
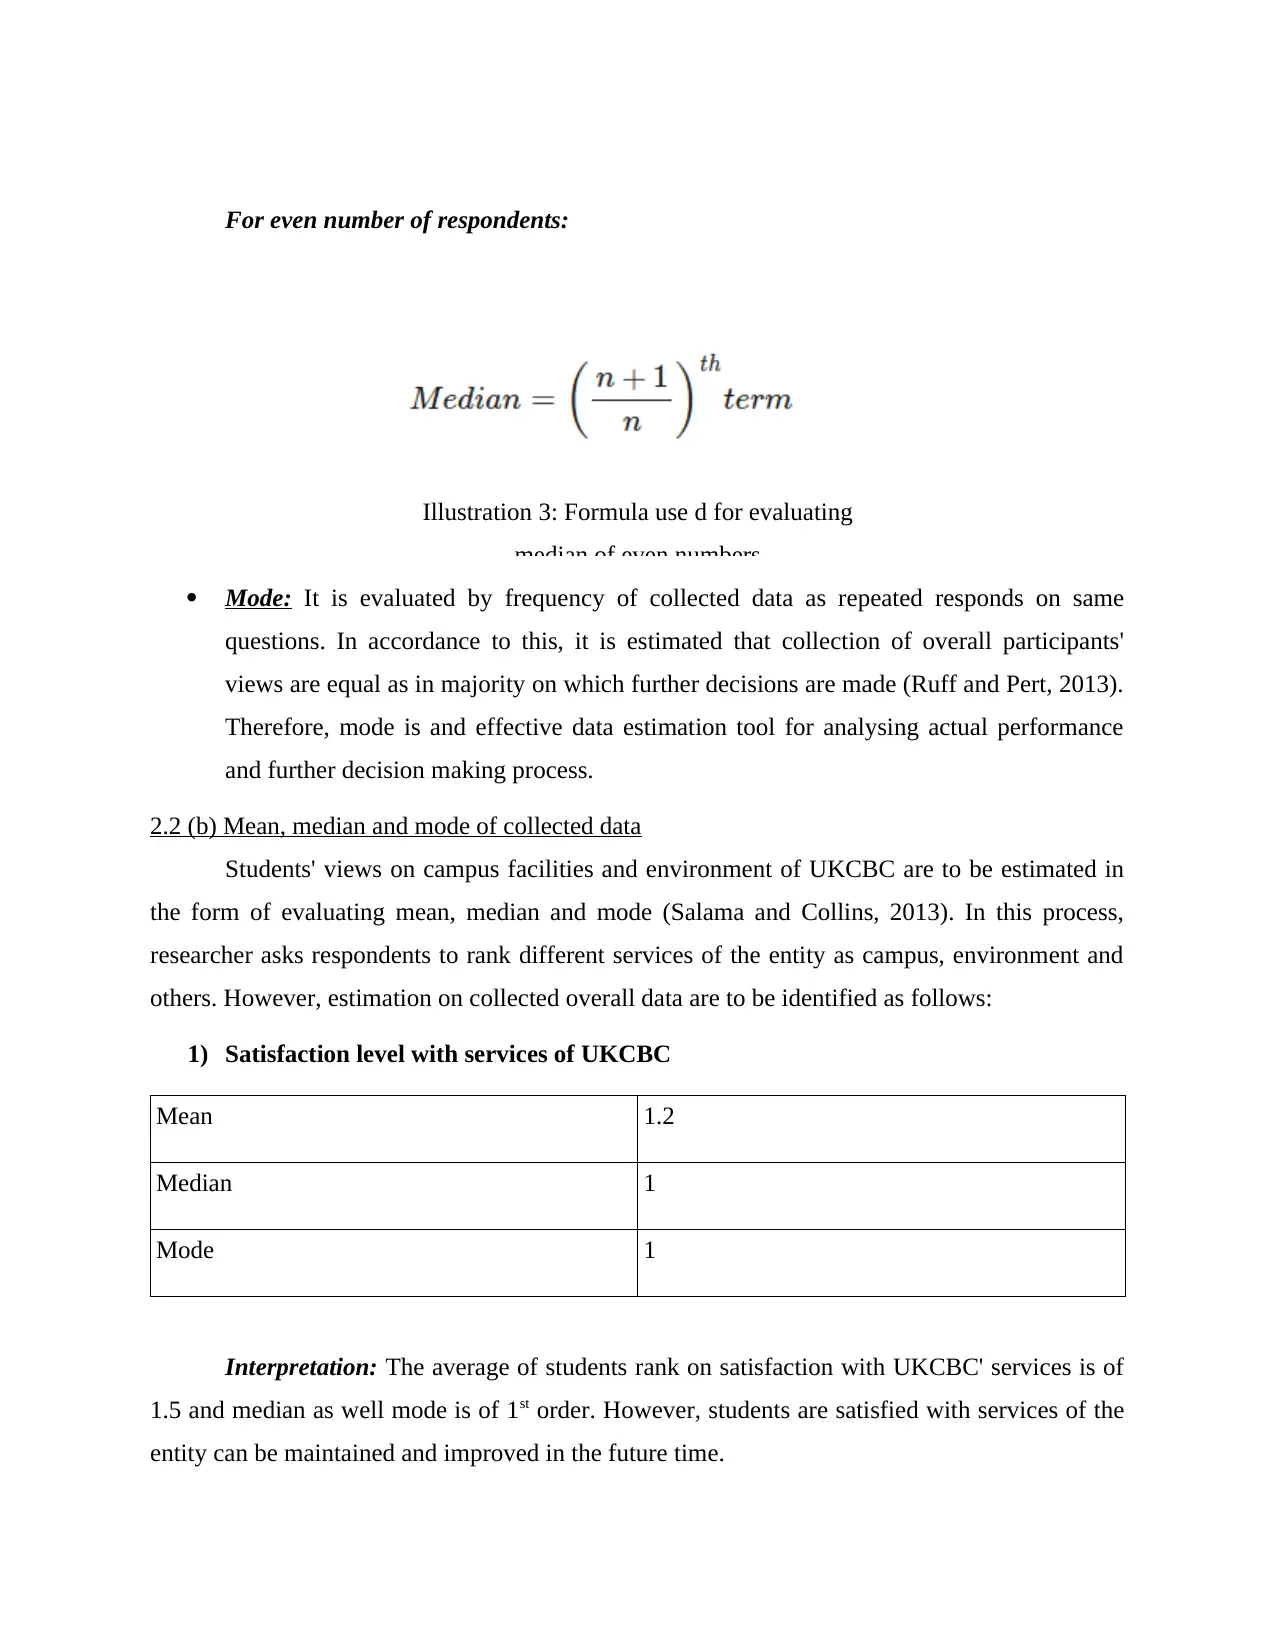
For even number of respondents:
Illustration 3: Formula use d for evaluating
median of even numbers
Mode: It is evaluated by frequency of collected data as repeated responds on same
questions. In accordance to this, it is estimated that collection of overall participants'
views are equal as in majority on which further decisions are made (Ruff and Pert, 2013).
Therefore, mode is and effective data estimation tool for analysing actual performance
and further decision making process.
2.2 (b) Mean, median and mode of collected data
Students' views on campus facilities and environment of UKCBC are to be estimated in
the form of evaluating mean, median and mode (Salama and Collins, 2013). In this process,
researcher asks respondents to rank different services of the entity as campus, environment and
others. However, estimation on collected overall data are to be identified as follows:
1) Satisfaction level with services of UKCBC
Mean 1.2
Median 1
Mode 1
Interpretation: The average of students rank on satisfaction with UKCBC' services is of
1.5 and median as well mode is of 1st order. However, students are satisfied with services of the
entity can be maintained and improved in the future time.
Paraphrase This Document
Need a fresh take? Get an instant paraphrase of this document with our AI Paraphraser
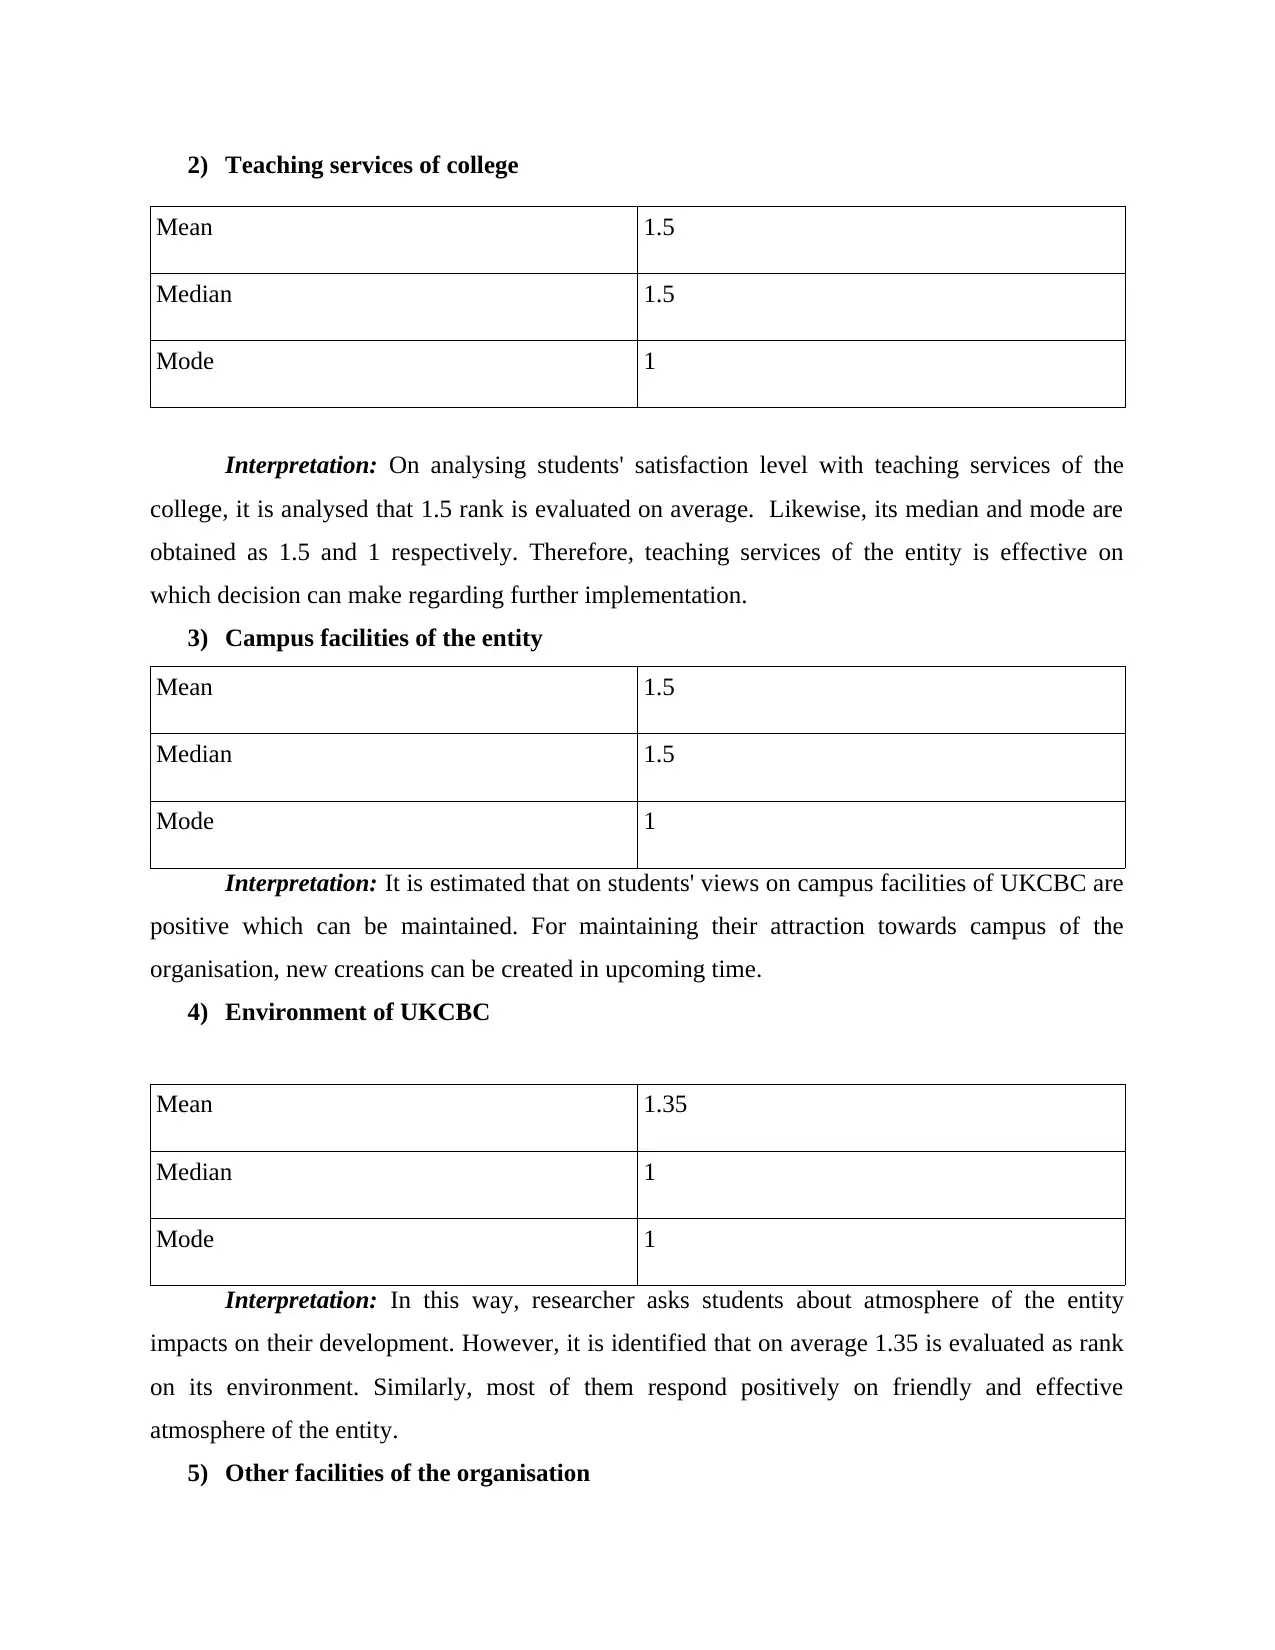
2) Teaching services of college
Mean 1.5
Median 1.5
Mode 1
Interpretation: On analysing students' satisfaction level with teaching services of the
college, it is analysed that 1.5 rank is evaluated on average. Likewise, its median and mode are
obtained as 1.5 and 1 respectively. Therefore, teaching services of the entity is effective on
which decision can make regarding further implementation.
3) Campus facilities of the entity
Mean 1.5
Median 1.5
Mode 1
Interpretation: It is estimated that on students' views on campus facilities of UKCBC are
positive which can be maintained. For maintaining their attraction towards campus of the
organisation, new creations can be created in upcoming time.
4) Environment of UKCBC
Mean 1.35
Median 1
Mode 1
Interpretation: In this way, researcher asks students about atmosphere of the entity
impacts on their development. However, it is identified that on average 1.35 is evaluated as rank
on its environment. Similarly, most of them respond positively on friendly and effective
atmosphere of the entity.
5) Other facilities of the organisation
Mean 1.5
Median 1.5
Mode 1
Interpretation: On analysing students' satisfaction level with teaching services of the
college, it is analysed that 1.5 rank is evaluated on average. Likewise, its median and mode are
obtained as 1.5 and 1 respectively. Therefore, teaching services of the entity is effective on
which decision can make regarding further implementation.
3) Campus facilities of the entity
Mean 1.5
Median 1.5
Mode 1
Interpretation: It is estimated that on students' views on campus facilities of UKCBC are
positive which can be maintained. For maintaining their attraction towards campus of the
organisation, new creations can be created in upcoming time.
4) Environment of UKCBC
Mean 1.35
Median 1
Mode 1
Interpretation: In this way, researcher asks students about atmosphere of the entity
impacts on their development. However, it is identified that on average 1.35 is evaluated as rank
on its environment. Similarly, most of them respond positively on friendly and effective
atmosphere of the entity.
5) Other facilities of the organisation
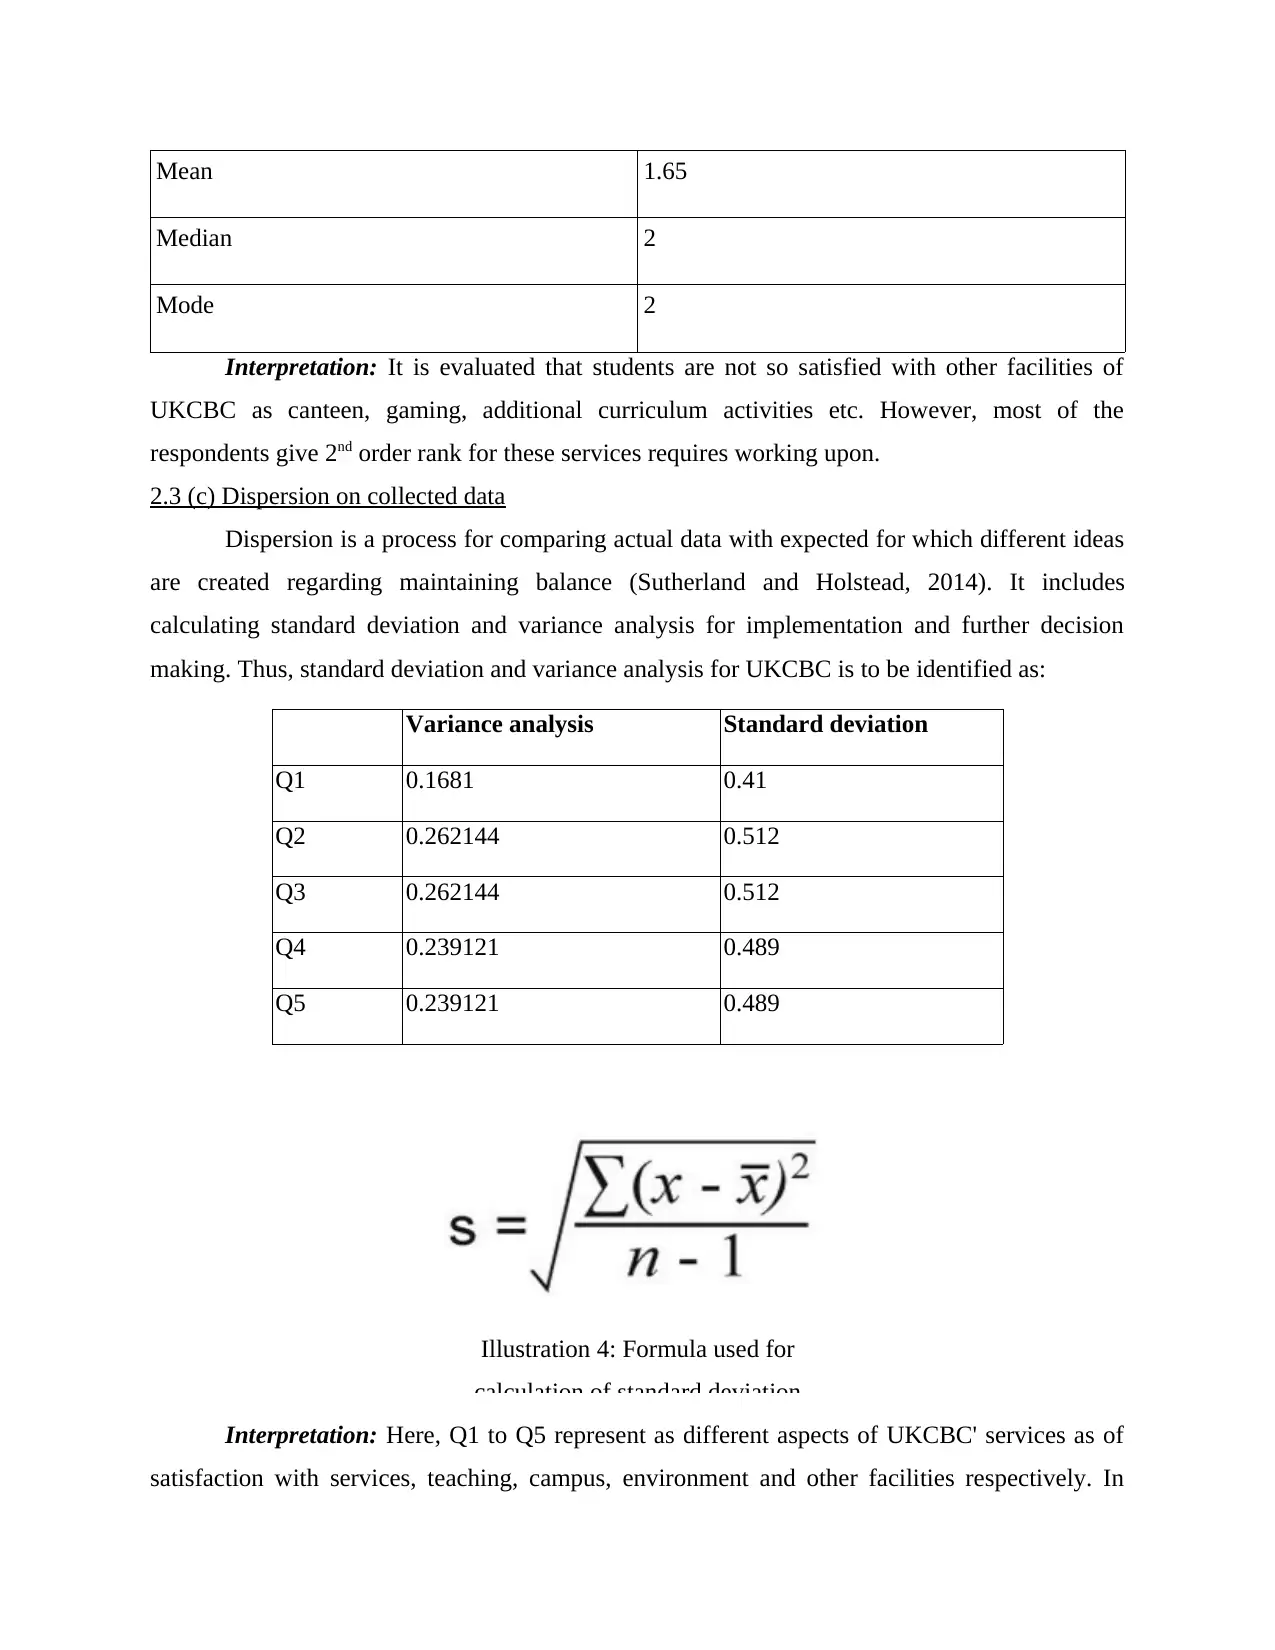
Mean 1.65
Median 2
Mode 2
Interpretation: It is evaluated that students are not so satisfied with other facilities of
UKCBC as canteen, gaming, additional curriculum activities etc. However, most of the
respondents give 2nd order rank for these services requires working upon.
2.3 (c) Dispersion on collected data
Dispersion is a process for comparing actual data with expected for which different ideas
are created regarding maintaining balance (Sutherland and Holstead, 2014). It includes
calculating standard deviation and variance analysis for implementation and further decision
making. Thus, standard deviation and variance analysis for UKCBC is to be identified as:
Variance analysis Standard deviation
Q1 0.1681 0.41
Q2 0.262144 0.512
Q3 0.262144 0.512
Q4 0.239121 0.489
Q5 0.239121 0.489
Illustration 4: Formula used for
calculation of standard deviation
Interpretation: Here, Q1 to Q5 represent as different aspects of UKCBC' services as of
satisfaction with services, teaching, campus, environment and other facilities respectively. In
⊘ This is a preview!⊘
Do you want full access?
Subscribe today to unlock all pages.
Trusted by 1+ million students worldwide
1 out of 29
Related Documents


Your All-in-One AI-Powered Toolkit for Academic Success.
+13062052269
info@desklib.com
Available 24*7 on WhatsApp / Email
![[object Object]](/_next/static/media/star-bottom.7253800d.svg)
Unlock your academic potential
Copyright © 2020–2026 A2Z Services. All Rights Reserved. Developed and managed by ZUCOL.