Comprehensive Business Decision Making and Analysis Report for UKCBC
VerifiedAdded on 2020/06/06
|30
|6242
|63
Report
AI Summary
This report provides a comprehensive analysis of business decision-making processes at UKCBC. It begins with an introduction to the importance of effective planning and the use of various tools for information processing and forecasting. The report details data collection methods, including surveys, questionnaires, and interviews conducted with students from different campuses. It examines sampling techniques and data collection estimations using mean, median, and mode to assess student satisfaction with UKCBC's services. The report further explores information tools for decision-making, graphical presentations of student views, trend lines for forecasting, and business reporting. It also covers information processing tools, project planning, and financial tools such as Net Present Value (NPV), Internal Rate of Return (IRR), and Average Rate of Return (ARR) for investment planning, concluding with an overview of findings and recommendations for future improvements.

BUSINESS DECISION
MAKING
MAKING
Paraphrase This Document
Need a fresh take? Get an instant paraphrase of this document with our AI Paraphraser
TABLE OF CONTENTS
INTRODUCTION...........................................................................................................................1
TASK 1............................................................................................................................................1
1.1 Data collections methods for UKCBC..................................................................................1
1.2 Survey and sampling for conducting survey.........................................................................2
1.3 Questionnaire for UKCBC....................................................................................................4
TASK 2............................................................................................................................................5
2.1 Information tools for decision making process.....................................................................5
2.2 Data collection estimations...................................................................................................6
2.3 Dispersion.............................................................................................................................8
2.4 Quartiles, percentiles and correlation in business context....................................................9
TASK 3..........................................................................................................................................11
3.1 Graphical presentation of students' views on UKCBC facilities........................................11
3.2 Trend lines for forecasting related to operations of UKCBC.............................................16
3.3 Presentation of gathered information related to services provided by UKCBC.................18
3.4 Business report....................................................................................................................18
TASK 4..........................................................................................................................................18
4.1 Information processing tools...............................................................................................18
4.2 Project plan for activity and critical path............................................................................19
4.3 Financial tools for decision making....................................................................................22
CONCLUSION..............................................................................................................................24
REFERENCE.................................................................................................................................25
INDEX OF TABLES
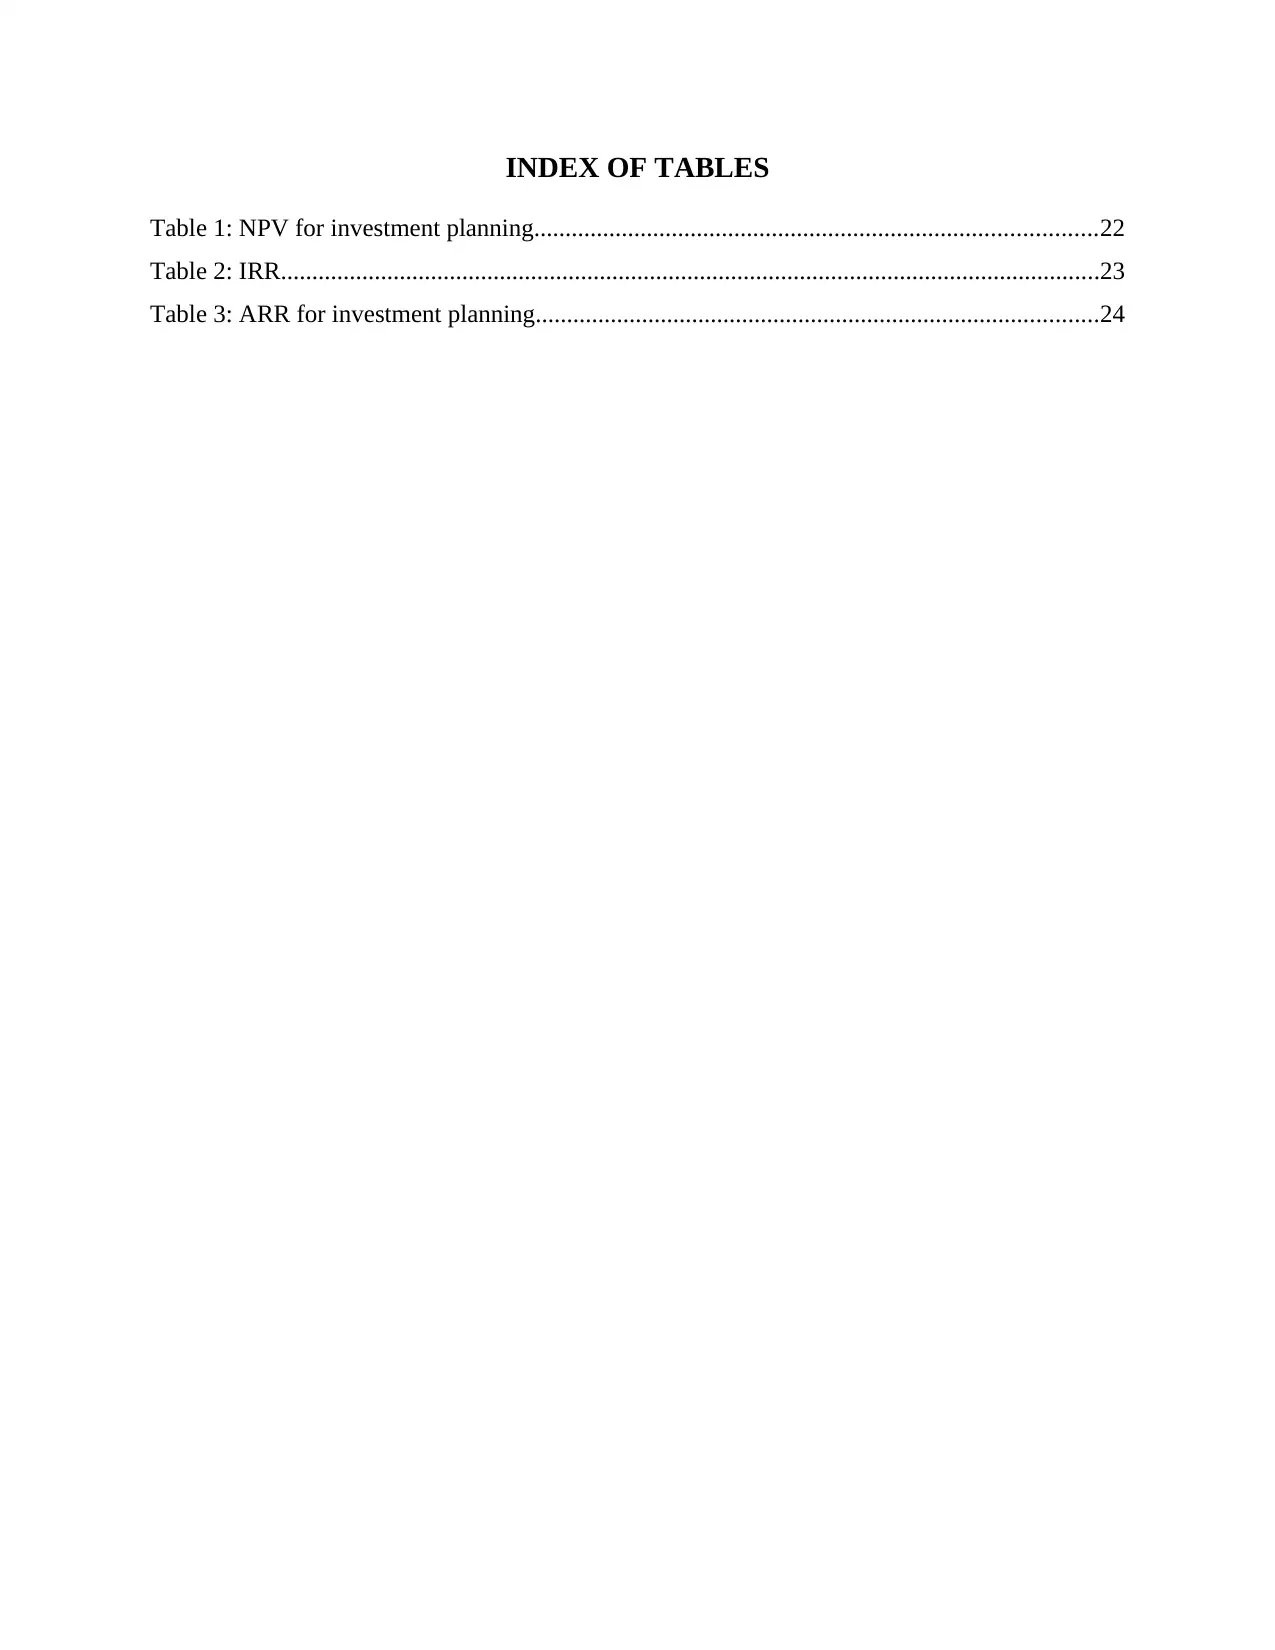
Table 1: NPV for investment planning..........................................................................................22
Table 2: IRR...................................................................................................................................23
Table 3: ARR for investment planning..........................................................................................24
⊘ This is a preview!⊘
Do you want full access?
Subscribe today to unlock all pages.
Trusted by 1+ million students worldwide
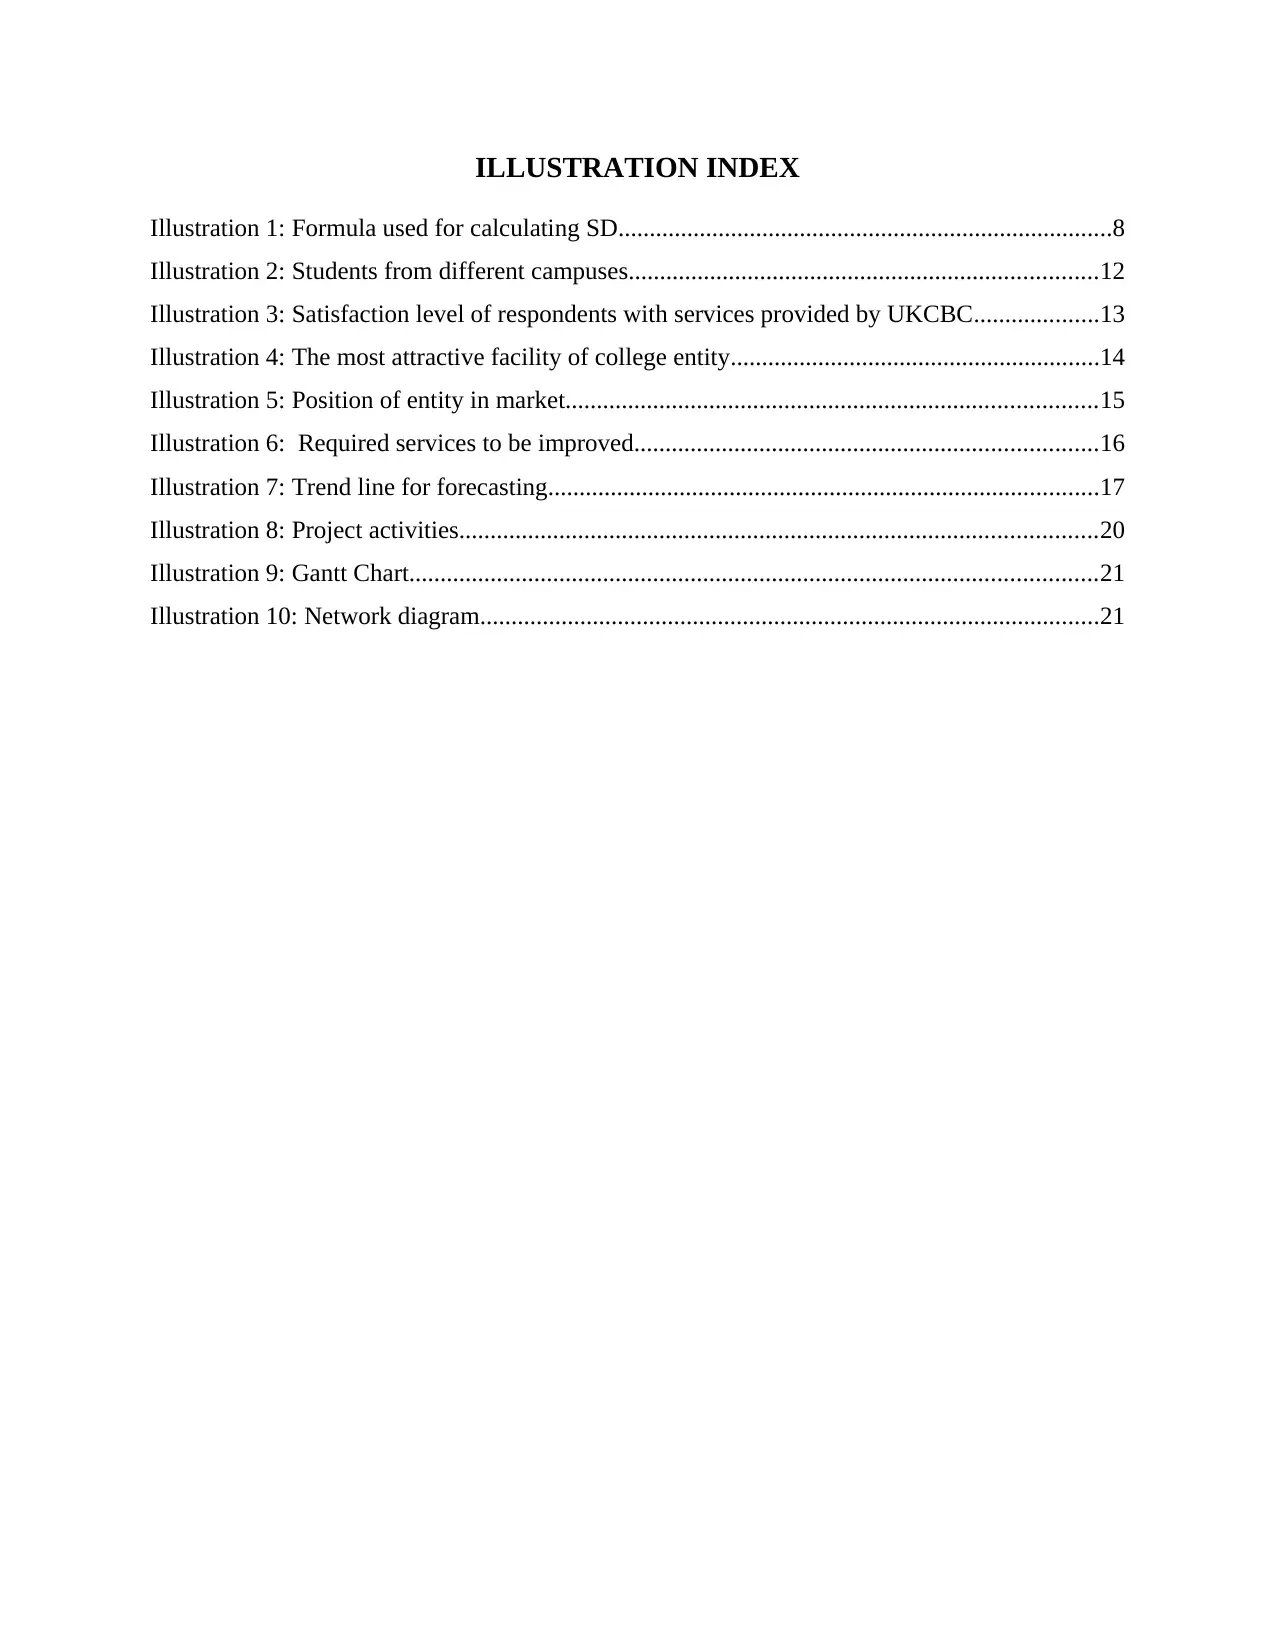
ILLUSTRATION INDEX
Illustration 1: Formula used for calculating SD...............................................................................8
Illustration 2: Students from different campuses...........................................................................12
Illustration 3: Satisfaction level of respondents with services provided by UKCBC....................13
Illustration 4: The most attractive facility of college entity...........................................................14
Illustration 5: Position of entity in market.....................................................................................15
Illustration 6: Required services to be improved..........................................................................16
Illustration 7: Trend line for forecasting........................................................................................17
Illustration 8: Project activities......................................................................................................20
Illustration 9: Gantt Chart..............................................................................................................21
Illustration 10: Network diagram...................................................................................................21
Paraphrase This Document
Need a fresh take? Get an instant paraphrase of this document with our AI Paraphraser
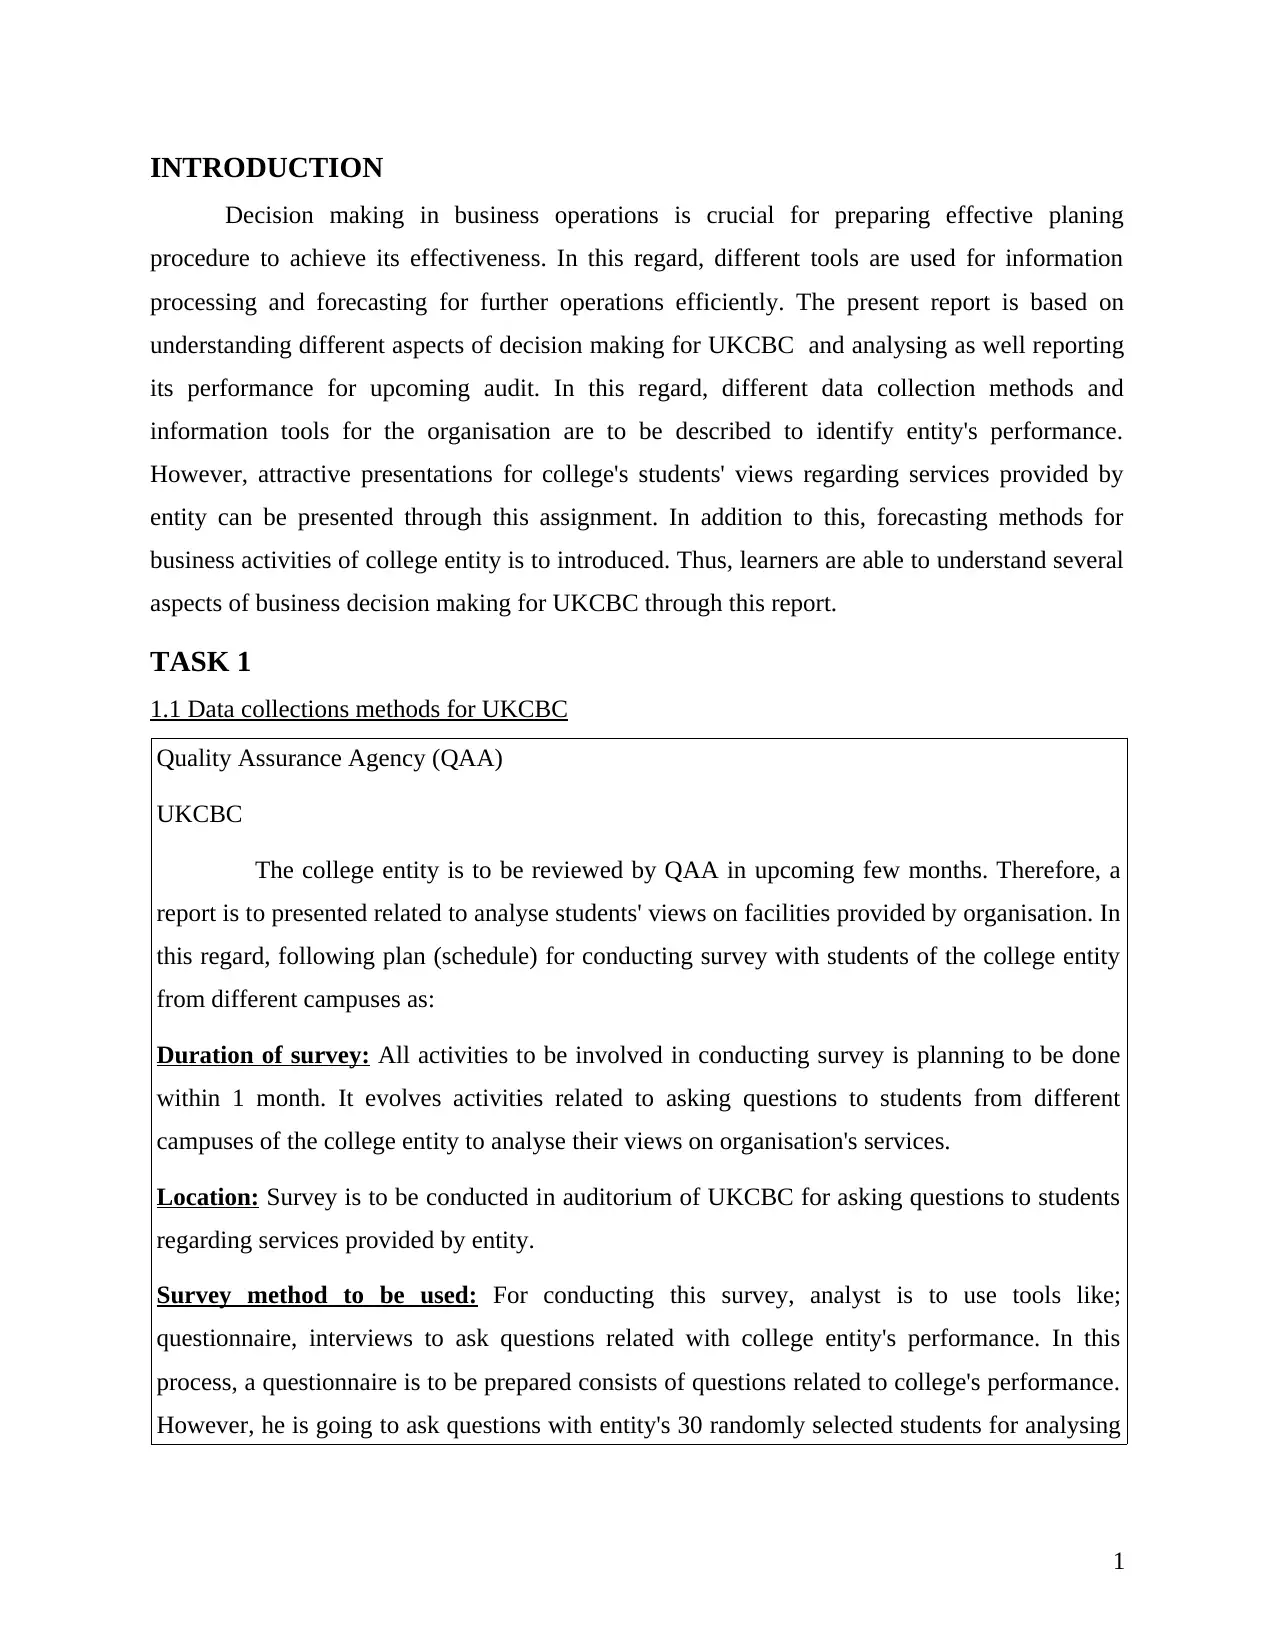
INTRODUCTION
Decision making in business operations is crucial for preparing effective planing
procedure to achieve its effectiveness. In this regard, different tools are used for information
processing and forecasting for further operations efficiently. The present report is based on
understanding different aspects of decision making for UKCBC and analysing as well reporting
its performance for upcoming audit. In this regard, different data collection methods and
information tools for the organisation are to be described to identify entity's performance.
However, attractive presentations for college's students' views regarding services provided by
entity can be presented through this assignment. In addition to this, forecasting methods for
business activities of college entity is to introduced. Thus, learners are able to understand several
aspects of business decision making for UKCBC through this report.
TASK 1
1.1 Data collections methods for UKCBC
Quality Assurance Agency (QAA)
UKCBC
The college entity is to be reviewed by QAA in upcoming few months. Therefore, a
report is to presented related to analyse students' views on facilities provided by organisation. In
this regard, following plan (schedule) for conducting survey with students of the college entity
from different campuses as:
Duration of survey: All activities to be involved in conducting survey is planning to be done
within 1 month. It evolves activities related to asking questions to students from different
campuses of the college entity to analyse their views on organisation's services.
Location: Survey is to be conducted in auditorium of UKCBC for asking questions to students
regarding services provided by entity.
Survey method to be used: For conducting this survey, analyst is to use tools like;
questionnaire, interviews to ask questions related with college entity's performance. In this
process, a questionnaire is to be prepared consists of questions related to college's performance.
However, he is going to ask questions with entity's 30 randomly selected students for analysing
1
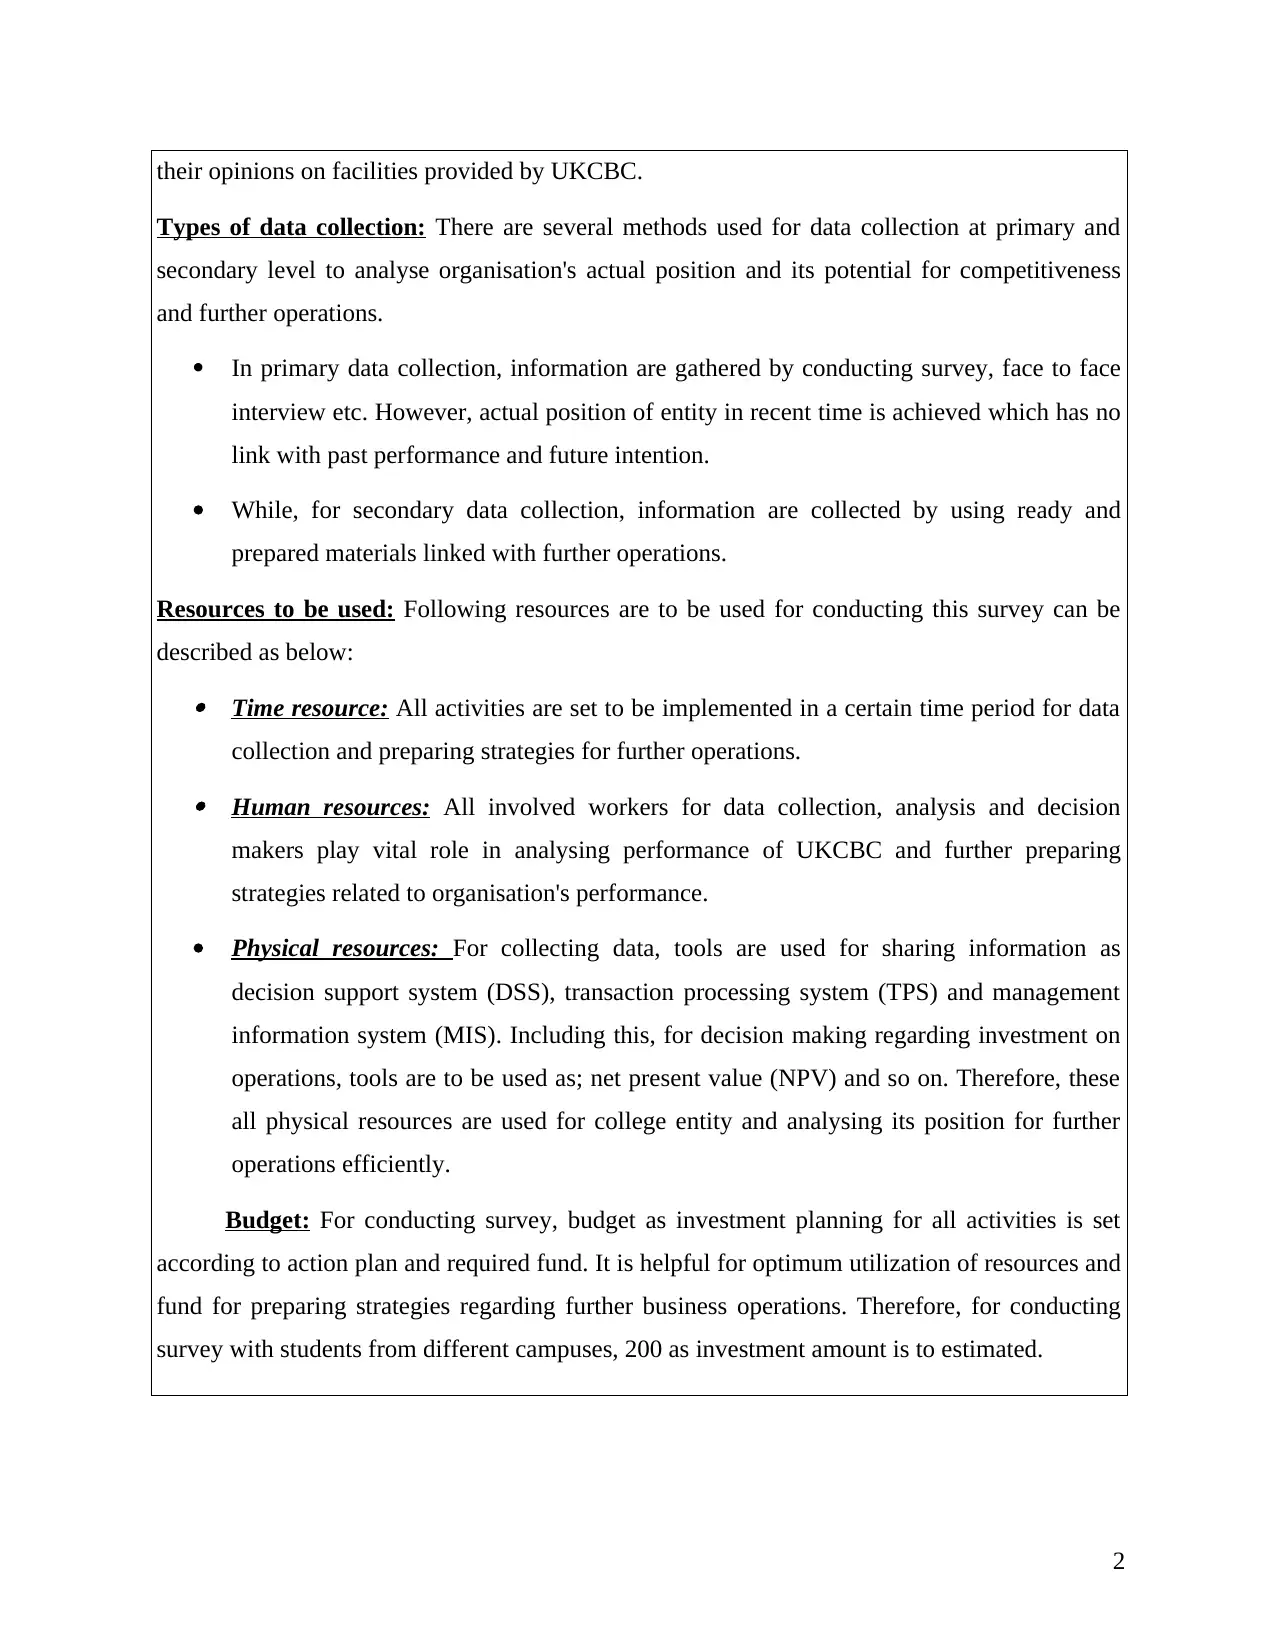
their opinions on facilities provided by UKCBC.
Types of data collection: There are several methods used for data collection at primary and
secondary level to analyse organisation's actual position and its potential for competitiveness
and further operations.
In primary data collection, information are gathered by conducting survey, face to face
interview etc. However, actual position of entity in recent time is achieved which has no
link with past performance and future intention.
While, for secondary data collection, information are collected by using ready and
prepared materials linked with further operations.
Resources to be used: Following resources are to be used for conducting this survey can be
described as below: Time resource: All activities are set to be implemented in a certain time period for data
collection and preparing strategies for further operations. Human resources: All involved workers for data collection, analysis and decision
makers play vital role in analysing performance of UKCBC and further preparing
strategies related to organisation's performance.
Physical resources: For collecting data, tools are used for sharing information as
decision support system (DSS), transaction processing system (TPS) and management
information system (MIS). Including this, for decision making regarding investment on
operations, tools are to be used as; net present value (NPV) and so on. Therefore, these
all physical resources are used for college entity and analysing its position for further
operations efficiently.
Budget: For conducting survey, budget as investment planning for all activities is set
according to action plan and required fund. It is helpful for optimum utilization of resources and
fund for preparing strategies regarding further business operations. Therefore, for conducting
survey with students from different campuses, 200 as investment amount is to estimated.
2
⊘ This is a preview!⊘
Do you want full access?
Subscribe today to unlock all pages.
Trusted by 1+ million students worldwide
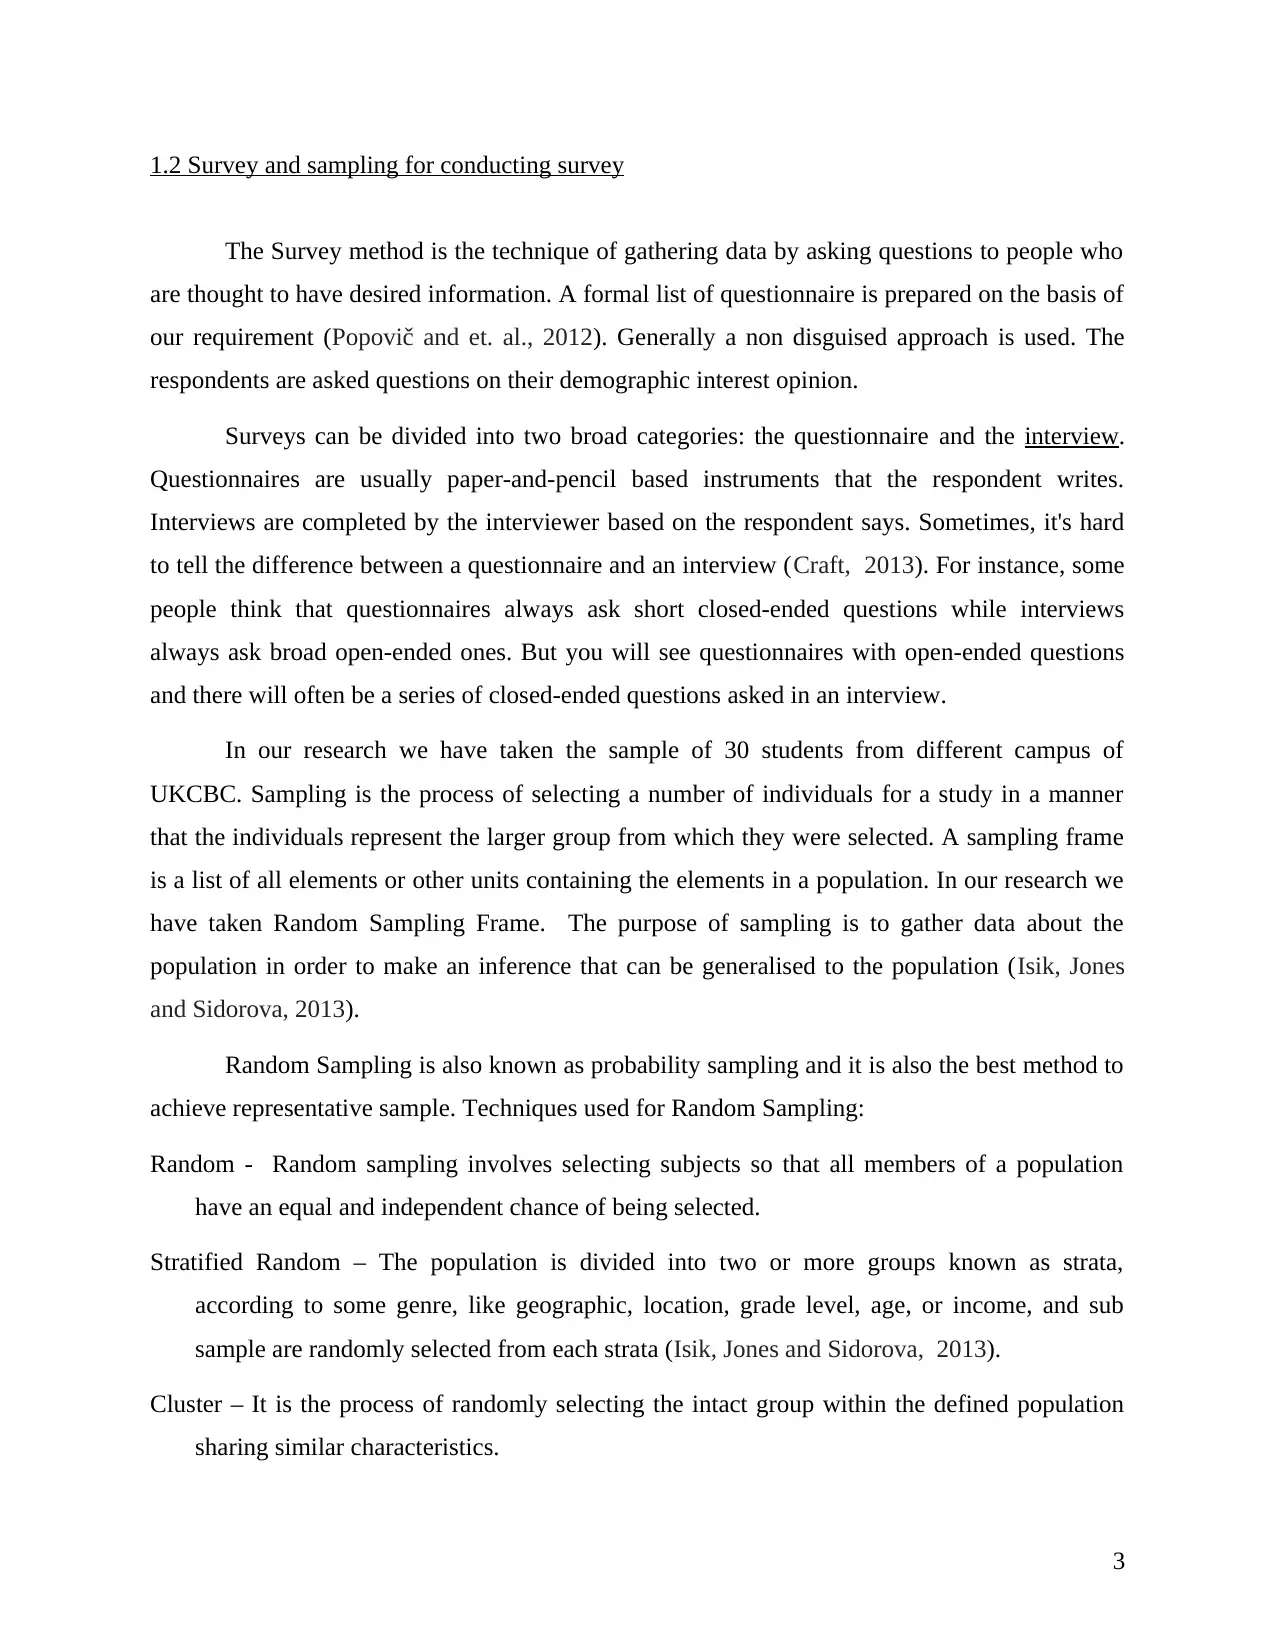
1.2 Survey and sampling for conducting survey
The Survey method is the technique of gathering data by asking questions to people who
are thought to have desired information. A formal list of questionnaire is prepared on the basis of
our requirement (Popovič and et. al., 2012). Generally a non disguised approach is used. The
respondents are asked questions on their demographic interest opinion.
Surveys can be divided into two broad categories: the questionnaire and the interview.
Questionnaires are usually paper-and-pencil based instruments that the respondent writes.
Interviews are completed by the interviewer based on the respondent says. Sometimes, it's hard
to tell the difference between a questionnaire and an interview (Craft, 2013). For instance, some
people think that questionnaires always ask short closed-ended questions while interviews
always ask broad open-ended ones. But you will see questionnaires with open-ended questions
and there will often be a series of closed-ended questions asked in an interview.
In our research we have taken the sample of 30 students from different campus of
UKCBC. Sampling is the process of selecting a number of individuals for a study in a manner
that the individuals represent the larger group from which they were selected. A sampling frame
is a list of all elements or other units containing the elements in a population. In our research we
have taken Random Sampling Frame. The purpose of sampling is to gather data about the
population in order to make an inference that can be generalised to the population (Isik, Jones
and Sidorova, 2013).
Random Sampling is also known as probability sampling and it is also the best method to
achieve representative sample. Techniques used for Random Sampling:
Random - Random sampling involves selecting subjects so that all members of a population
have an equal and independent chance of being selected.
Stratified Random – The population is divided into two or more groups known as strata,
according to some genre, like geographic, location, grade level, age, or income, and sub
sample are randomly selected from each strata (Isik, Jones and Sidorova, 2013).
Cluster – It is the process of randomly selecting the intact group within the defined population
sharing similar characteristics.
3
Paraphrase This Document
Need a fresh take? Get an instant paraphrase of this document with our AI Paraphraser
Systematic – In this sampling we select every kth subject or an individual from a list of the
members of the population.
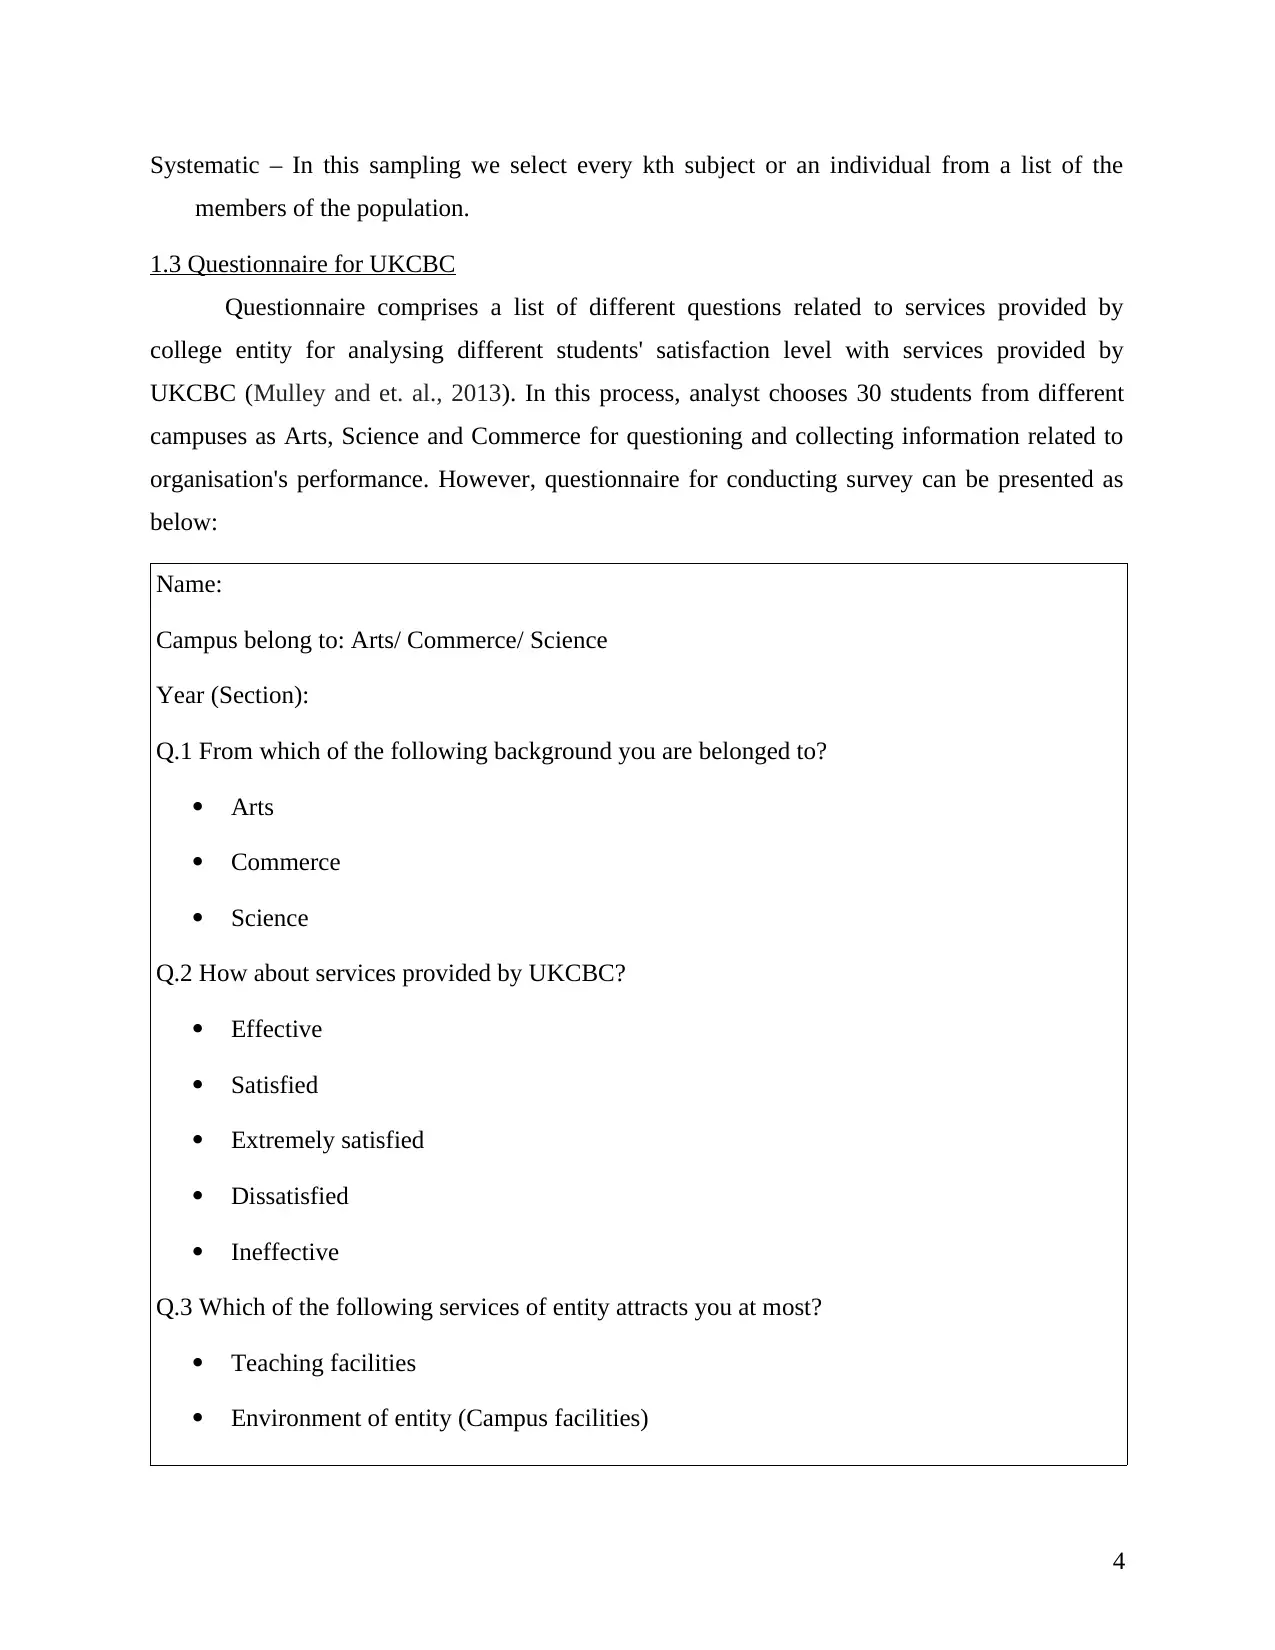
1.3 Questionnaire for UKCBC
Questionnaire comprises a list of different questions related to services provided by
college entity for analysing different students' satisfaction level with services provided by
UKCBC (Mulley and et. al., 2013). In this process, analyst chooses 30 students from different
campuses as Arts, Science and Commerce for questioning and collecting information related to
organisation's performance. However, questionnaire for conducting survey can be presented as
below:
Name:
Campus belong to: Arts/ Commerce/ Science
Year (Section):
Q.1 From which of the following background you are belonged to?
Arts
Commerce
Science
Q.2 How about services provided by UKCBC?
Effective
Satisfied
Extremely satisfied
Dissatisfied
Ineffective
Q.3 Which of the following services of entity attracts you at most?
Teaching facilities
Environment of entity (Campus facilities)
4
members of the population.
1.3 Questionnaire for UKCBC
Questionnaire comprises a list of different questions related to services provided by
college entity for analysing different students' satisfaction level with services provided by
UKCBC (Mulley and et. al., 2013). In this process, analyst chooses 30 students from different
campuses as Arts, Science and Commerce for questioning and collecting information related to
organisation's performance. However, questionnaire for conducting survey can be presented as
below:
Name:
Campus belong to: Arts/ Commerce/ Science
Year (Section):
Q.1 From which of the following background you are belonged to?
Arts
Commerce
Science
Q.2 How about services provided by UKCBC?
Effective
Satisfied
Extremely satisfied
Dissatisfied
Ineffective
Q.3 Which of the following services of entity attracts you at most?
Teaching facilities
Environment of entity (Campus facilities)
4
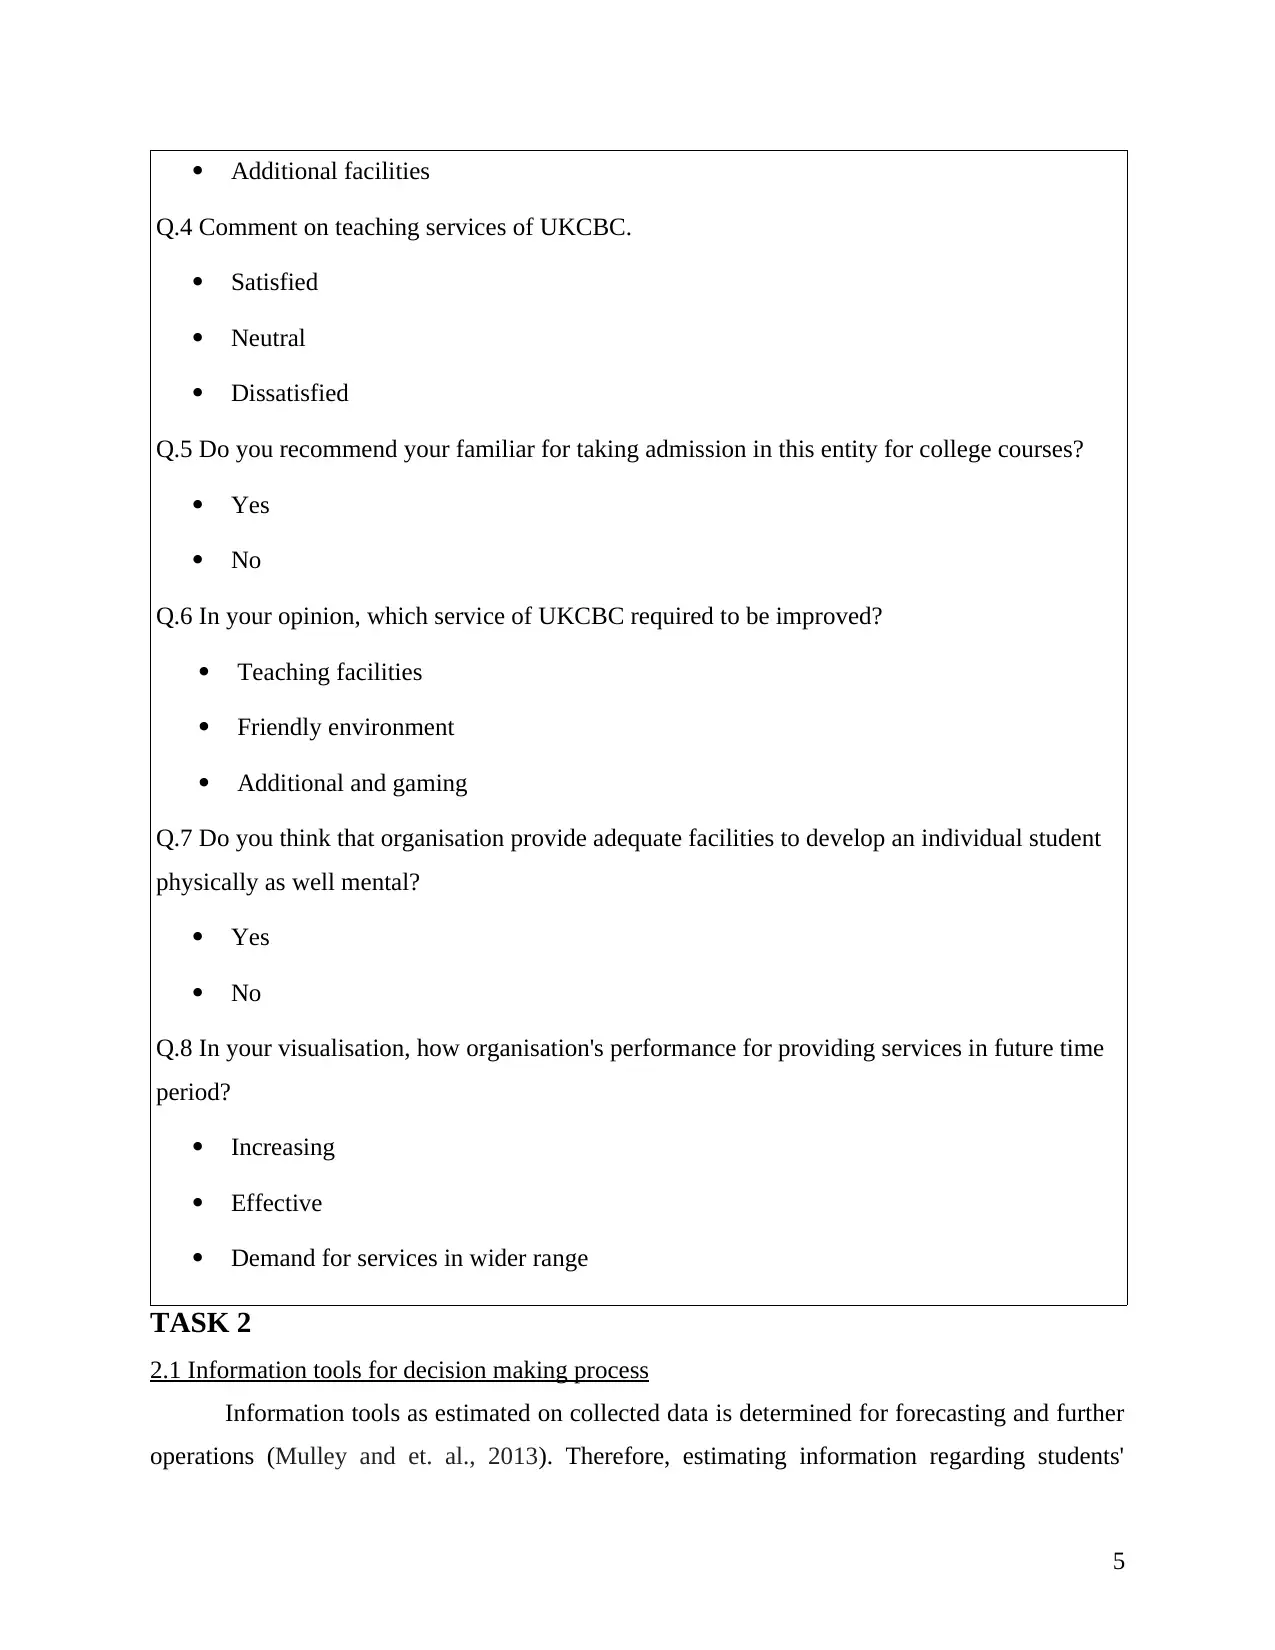
Additional facilities
Q.4 Comment on teaching services of UKCBC.
Satisfied
Neutral
Dissatisfied
Q.5 Do you recommend your familiar for taking admission in this entity for college courses?
Yes
No
Q.6 In your opinion, which service of UKCBC required to be improved?
Teaching facilities
Friendly environment
Additional and gaming
Q.7 Do you think that organisation provide adequate facilities to develop an individual student
physically as well mental?
Yes
No
Q.8 In your visualisation, how organisation's performance for providing services in future time
period?
Increasing
Effective
Demand for services in wider range
TASK 2
2.1 Information tools for decision making process
Information tools as estimated on collected data is determined for forecasting and further
operations (Mulley and et. al., 2013). Therefore, estimating information regarding students'
5
⊘ This is a preview!⊘
Do you want full access?
Subscribe today to unlock all pages.
Trusted by 1+ million students worldwide
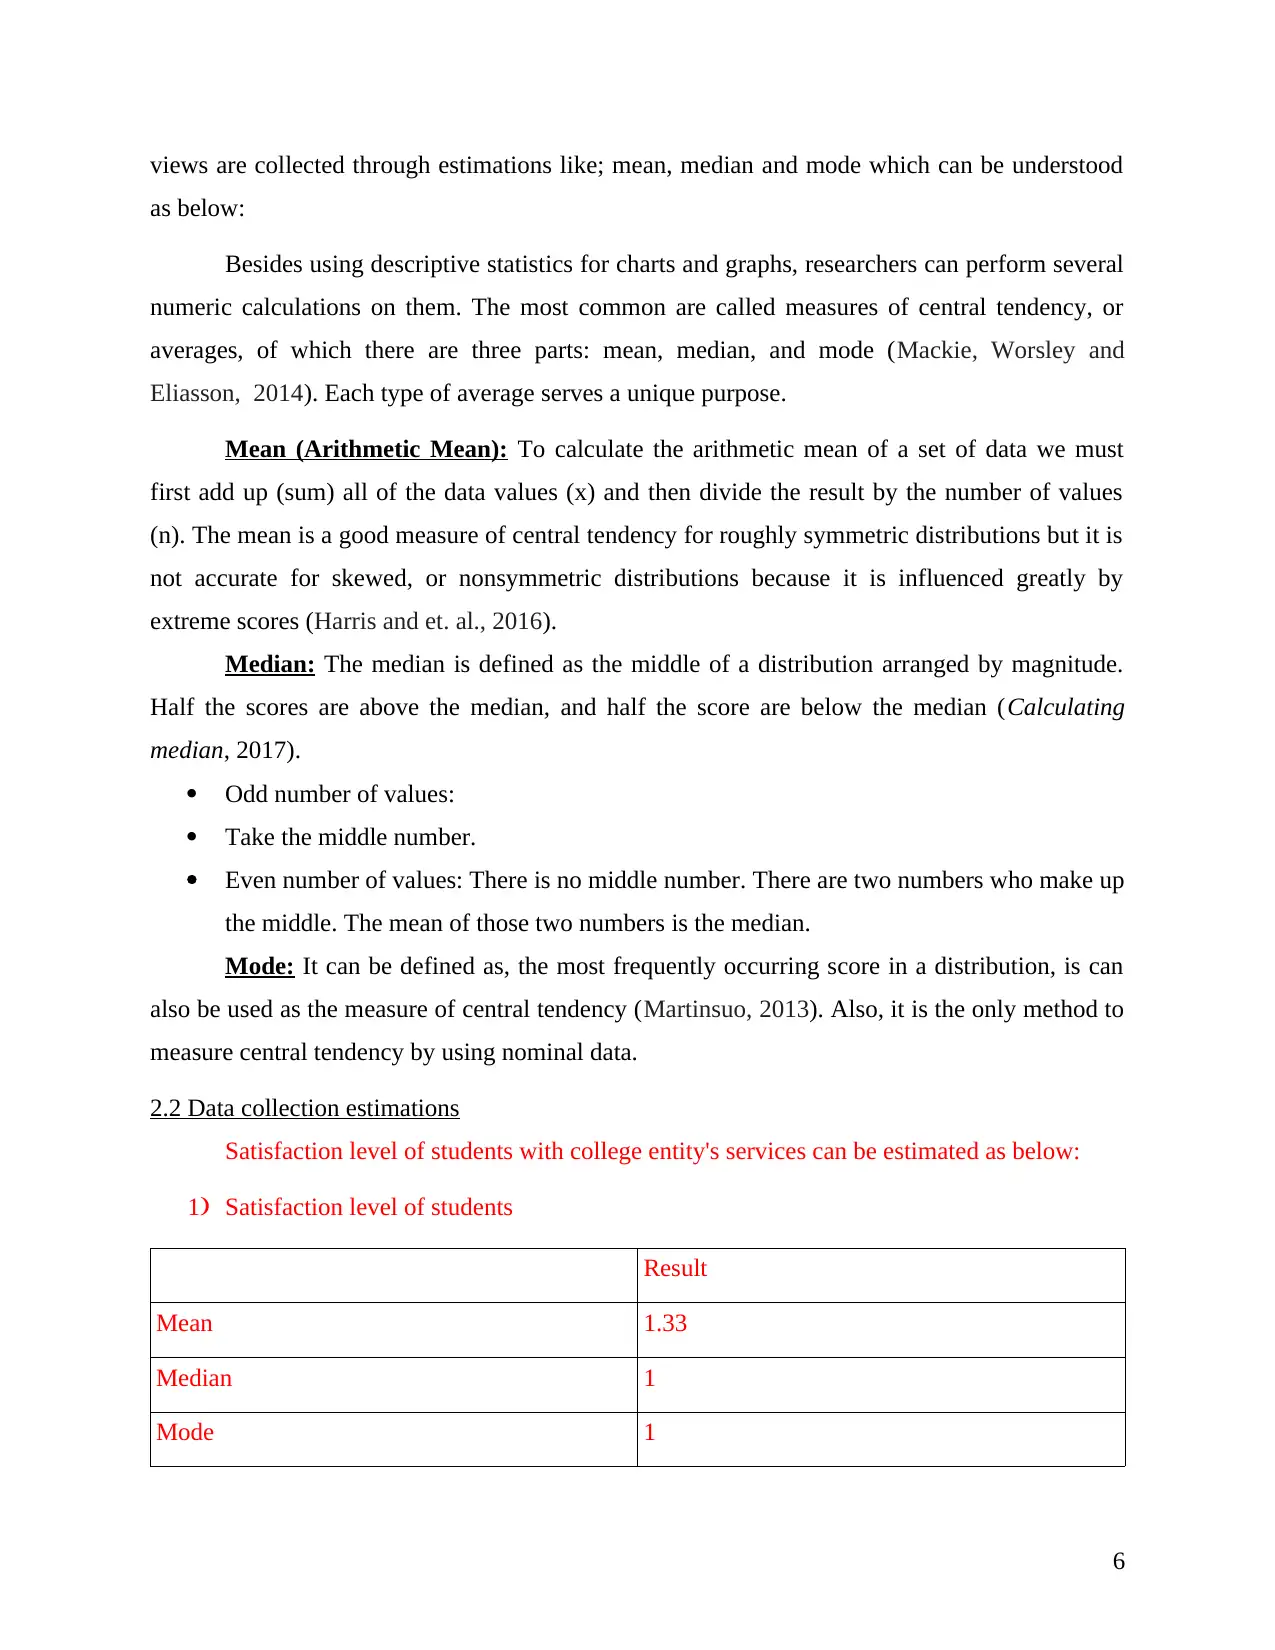
views are collected through estimations like; mean, median and mode which can be understood
as below:
Besides using descriptive statistics for charts and graphs, researchers can perform several
numeric calculations on them. The most common are called measures of central tendency, or
averages, of which there are three parts: mean, median, and mode (Mackie, Worsley and
Eliasson, 2014). Each type of average serves a unique purpose.
Mean (Arithmetic Mean): To calculate the arithmetic mean of a set of data we must
first add up (sum) all of the data values (x) and then divide the result by the number of values
(n). The mean is a good measure of central tendency for roughly symmetric distributions but it is
not accurate for skewed, or nonsymmetric distributions because it is influenced greatly by
extreme scores (Harris and et. al., 2016).
Median: The median is defined as the middle of a distribution arranged by magnitude.
Half the scores are above the median, and half the score are below the median (Calculating
median, 2017).
Odd number of values:
Take the middle number.
Even number of values: There is no middle number. There are two numbers who make up
the middle. The mean of those two numbers is the median.
Mode: It can be defined as, the most frequently occurring score in a distribution, is can
also be used as the measure of central tendency (Martinsuo, 2013). Also, it is the only method to
measure central tendency by using nominal data.
2.2 Data collection estimations
Satisfaction level of students with college entity's services can be estimated as below:
1) Satisfaction level of students
Result
Mean 1.33
Median 1
Mode 1
6
Paraphrase This Document
Need a fresh take? Get an instant paraphrase of this document with our AI Paraphraser
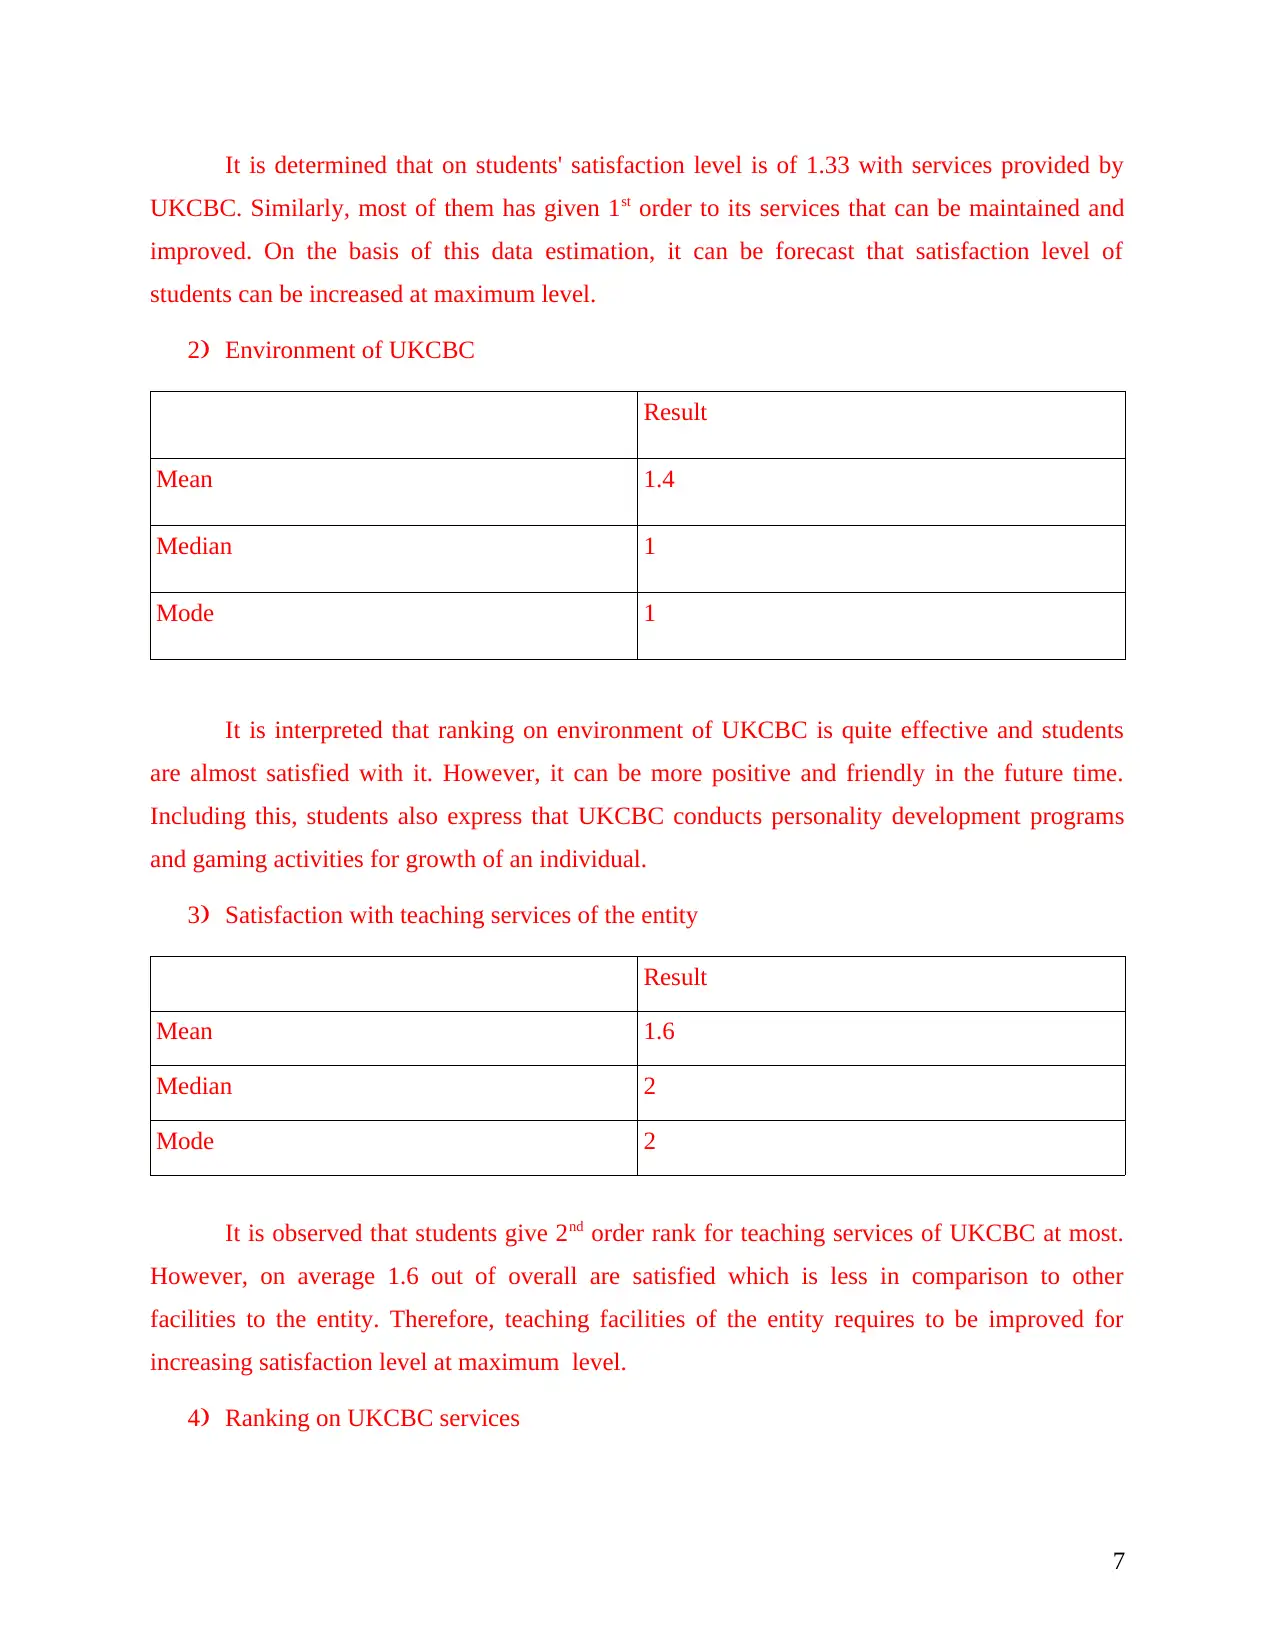
It is determined that on students' satisfaction level is of 1.33 with services provided by
UKCBC. Similarly, most of them has given 1st order to its services that can be maintained and
improved. On the basis of this data estimation, it can be forecast that satisfaction level of
students can be increased at maximum level.
2) Environment of UKCBC
Result
Mean 1.4
Median 1
Mode 1
It is interpreted that ranking on environment of UKCBC is quite effective and students
are almost satisfied with it. However, it can be more positive and friendly in the future time.
Including this, students also express that UKCBC conducts personality development programs
and gaming activities for growth of an individual.
3) Satisfaction with teaching services of the entity
Result
Mean 1.6
Median 2
Mode 2
It is observed that students give 2nd order rank for teaching services of UKCBC at most.
However, on average 1.6 out of overall are satisfied which is less in comparison to other
facilities to the entity. Therefore, teaching facilities of the entity requires to be improved for
increasing satisfaction level at maximum level.
4) Ranking on UKCBC services
7
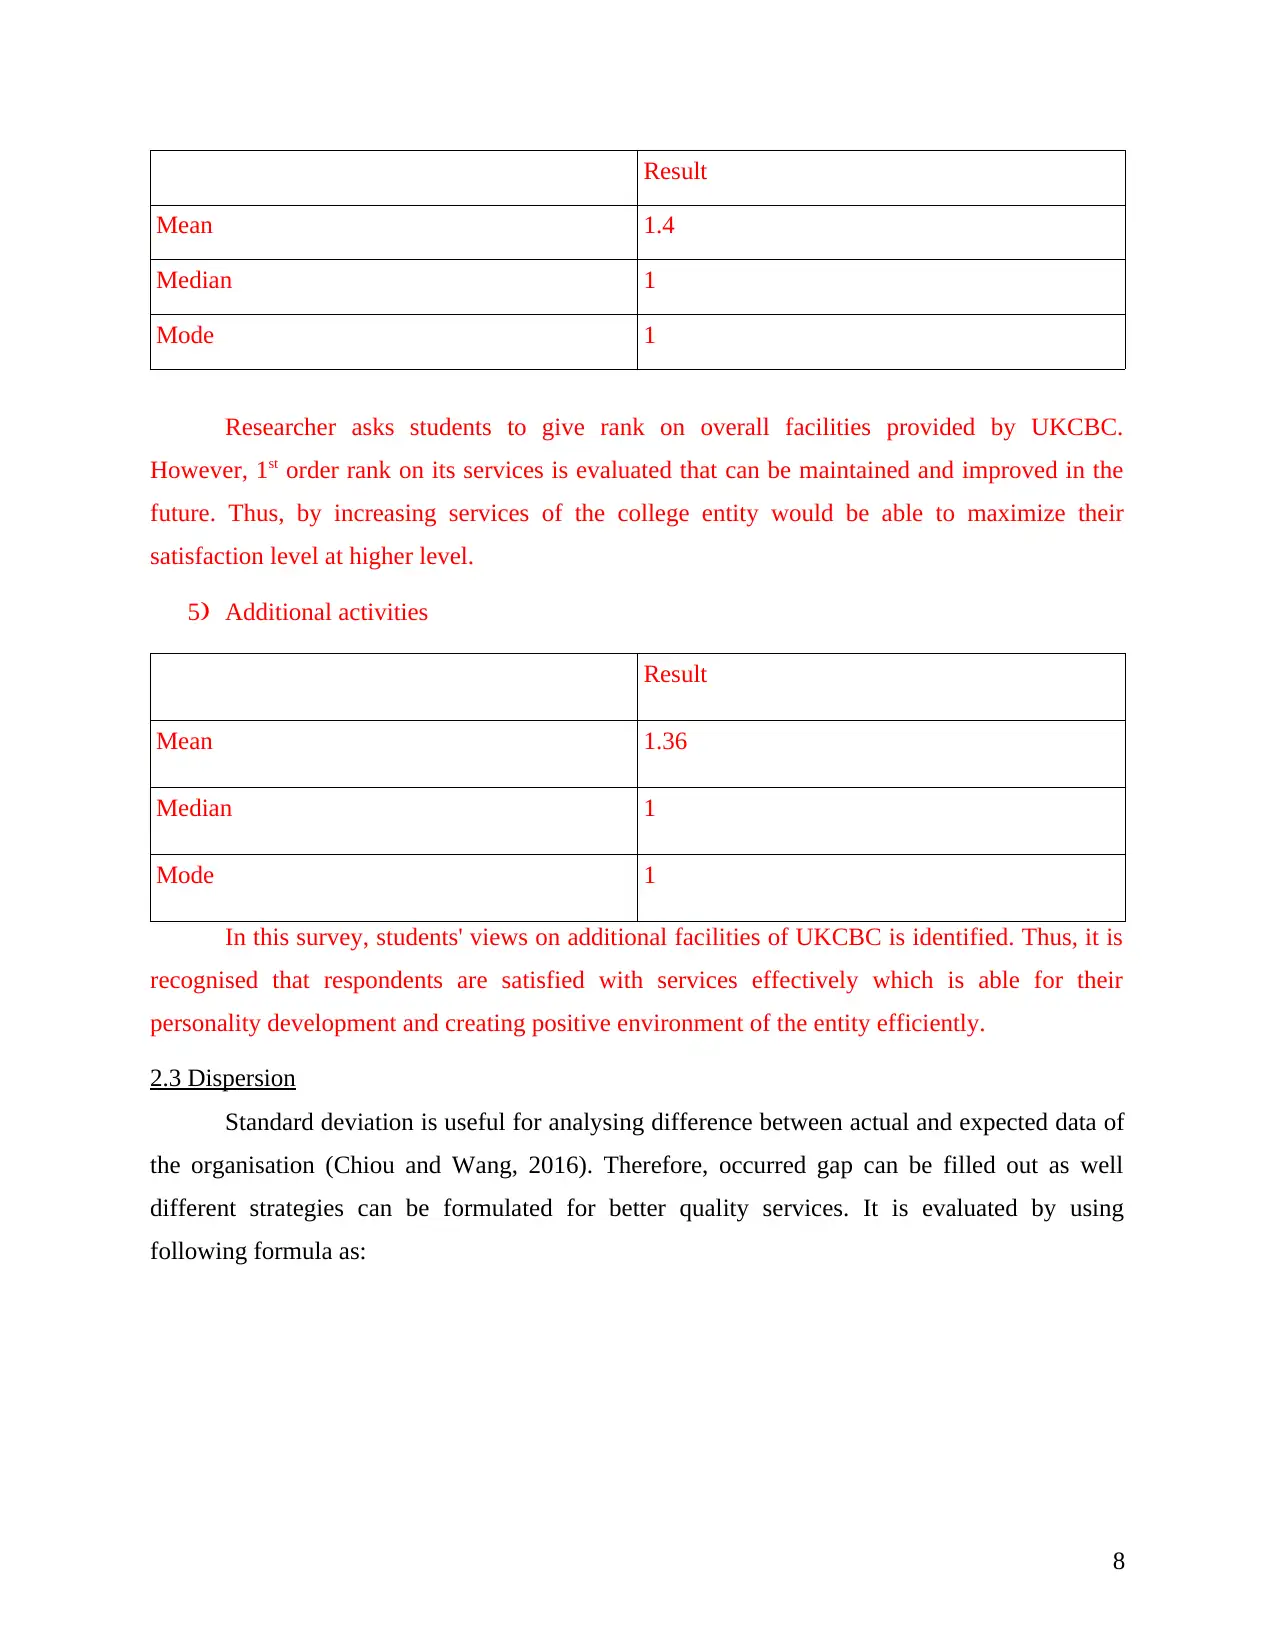
Result
Mean 1.4
Median 1
Mode 1
Researcher asks students to give rank on overall facilities provided by UKCBC.
However, 1st order rank on its services is evaluated that can be maintained and improved in the
future. Thus, by increasing services of the college entity would be able to maximize their
satisfaction level at higher level.
5) Additional activities
Result
Mean 1.36
Median 1
Mode 1
In this survey, students' views on additional facilities of UKCBC is identified. Thus, it is
recognised that respondents are satisfied with services effectively which is able for their
personality development and creating positive environment of the entity efficiently.
2.3 Dispersion
Standard deviation is useful for analysing difference between actual and expected data of
the organisation (Chiou and Wang, 2016). Therefore, occurred gap can be filled out as well
different strategies can be formulated for better quality services. It is evaluated by using
following formula as:
8
⊘ This is a preview!⊘
Do you want full access?
Subscribe today to unlock all pages.
Trusted by 1+ million students worldwide
1 out of 30
Related Documents


Your All-in-One AI-Powered Toolkit for Academic Success.
+13062052269
info@desklib.com
Available 24*7 on WhatsApp / Email
![[object Object]](/_next/static/media/star-bottom.7253800d.svg)
Unlock your academic potential
Copyright © 2020–2026 A2Z Services. All Rights Reserved. Developed and managed by ZUCOL.