Report on Business Decision Making and Student Satisfaction at UKCBC
VerifiedAdded on 2020/06/04
|28
|5185
|47
Report
AI Summary
This report focuses on business decision-making at UKCBC, a UK-based college, to improve its services and effectiveness. The report begins with an introduction to business decision-making and its significance, followed by a detailed explanation of the data collection process, including primary and secondary data methods, and the survey methodology, including sampling techniques such as stratified sampling. A comprehensive questionnaire designed to gather student feedback on various aspects of UKCBC is presented. The analysis of collected data includes statistical tools like mean, median, and mode, along with the evaluation of student satisfaction levels regarding the college's services, teaching, environment, and administrative offices. The report also includes a data analysis using dispersion metrics such as standard deviation and variance, along with quartiles and correlation coefficients. This report aims to provide a thorough understanding of how business decisions impact student satisfaction and how data analysis can be used to inform strategic improvements for the college.

BUSINESS DECISION
MAKING
MAKING
Paraphrase This Document
Need a fresh take? Get an instant paraphrase of this document with our AI Paraphraser

INTRODUCTION
Business decision making is crucial for adequate planning and forecasting for further
years ' operations and improving services of entity. In this regard, different tools are used for
identifying organisation's performance and preparing strategies to allocate resources and funds
adequately. This report is based on understanding significance of decision making for UKCBC- a
college entity of UK. It provides different courses and facilities to college students belonging to
various countries worldwide. In this regard, students' satisfaction level with services of
organisation as well presentation on findings are to be described. However, various decision-
making aspects can be understood for improving services and entity's effectiveness through this
assignment. In addition to this, investment appraisal techniques for adequate decisions and
investment plans is expressed. Thus, learners are able to understand usefulness of business
decision making for UKCBC through this report.
TASK 1
1.1 Data collection survey
Data is to be collected from across the campuses of UKCBC colleges on demand for a
survey on student of the colleges. Collection of data will be arranged in two core ways, primary
collection method and secondary collection method (Craft, 2013). Primary collection of data will
be done through distribution of questionnaires among the students of four UKCBC campuses,
Wentworth House Campus, Cricklewood campus, Lords House campus, Holborn campus. A
sample of 50 students is required for the survey. Secondary data collection will be done through
scripting of information present in books, journals and articles.
Research and analysis Details of research and analysis
Primary data collection Primary data is to be collected via questionnaire from a sample size of 20
across all UKCBC campuses.
Analysis of primary
data
Information collected through survey analysed for report preparation.
1
⊘ This is a preview!⊘
Do you want full access?
Subscribe today to unlock all pages.
Trusted by 1+ million students worldwide
Secondary data
collection
Secondary data gathered from various sources, such as books, journals
and articles.
Analysis of secondary
data
Data collected from research analysed.
Report preparation Report preparation on the basis of information obtained from the primary
and secondary sources of data.
Data collected from secondary sources provide a broader view of the survey but is old
and cannot be trusted completely, whereas the primary data spots on the current trend of the
students in the UKCBC college campuses (García and Conde, 2014). Primary data is collected
by a precise way of questionnaire filled by the students but it may also contain biased views by
individuals of similar category on a particular branch of information.
1.2 Survey methodology and sampling framework
A survey can be organised by many methods. These methods of survey include
questionnaire distribution, interview, observation etc. Primary motive of this survey is collection
of data by distribution of questionnaire among the students of UKCBC colleges (Ginevičius and
Podviezko, 2013).
Sampling frame:
Simple random sampling: Simple random sampling method is the simplest method of
sampling. Under this method of sampling questionnaires are distributed between
individuals with a random algorithm, completely dependent on the biased behaviour of
the distributor. This method is helpful when information is unspecific in nature (Gu and
et.al., 2013).
Cluster sampling: This method of sampling needs a discrete distribution on the basis of
geographical factors of an area. Samples are obtained out of these geographical
distributions. This method of sampling is of use when survey is to be on a specific area.
Quota sampling: Under this method of sampling the population is divided into different
quotas, samples are obtained from created quota (Hill and et.al., 2013).
2
Paraphrase This Document
Need a fresh take? Get an instant paraphrase of this document with our AI Paraphraser
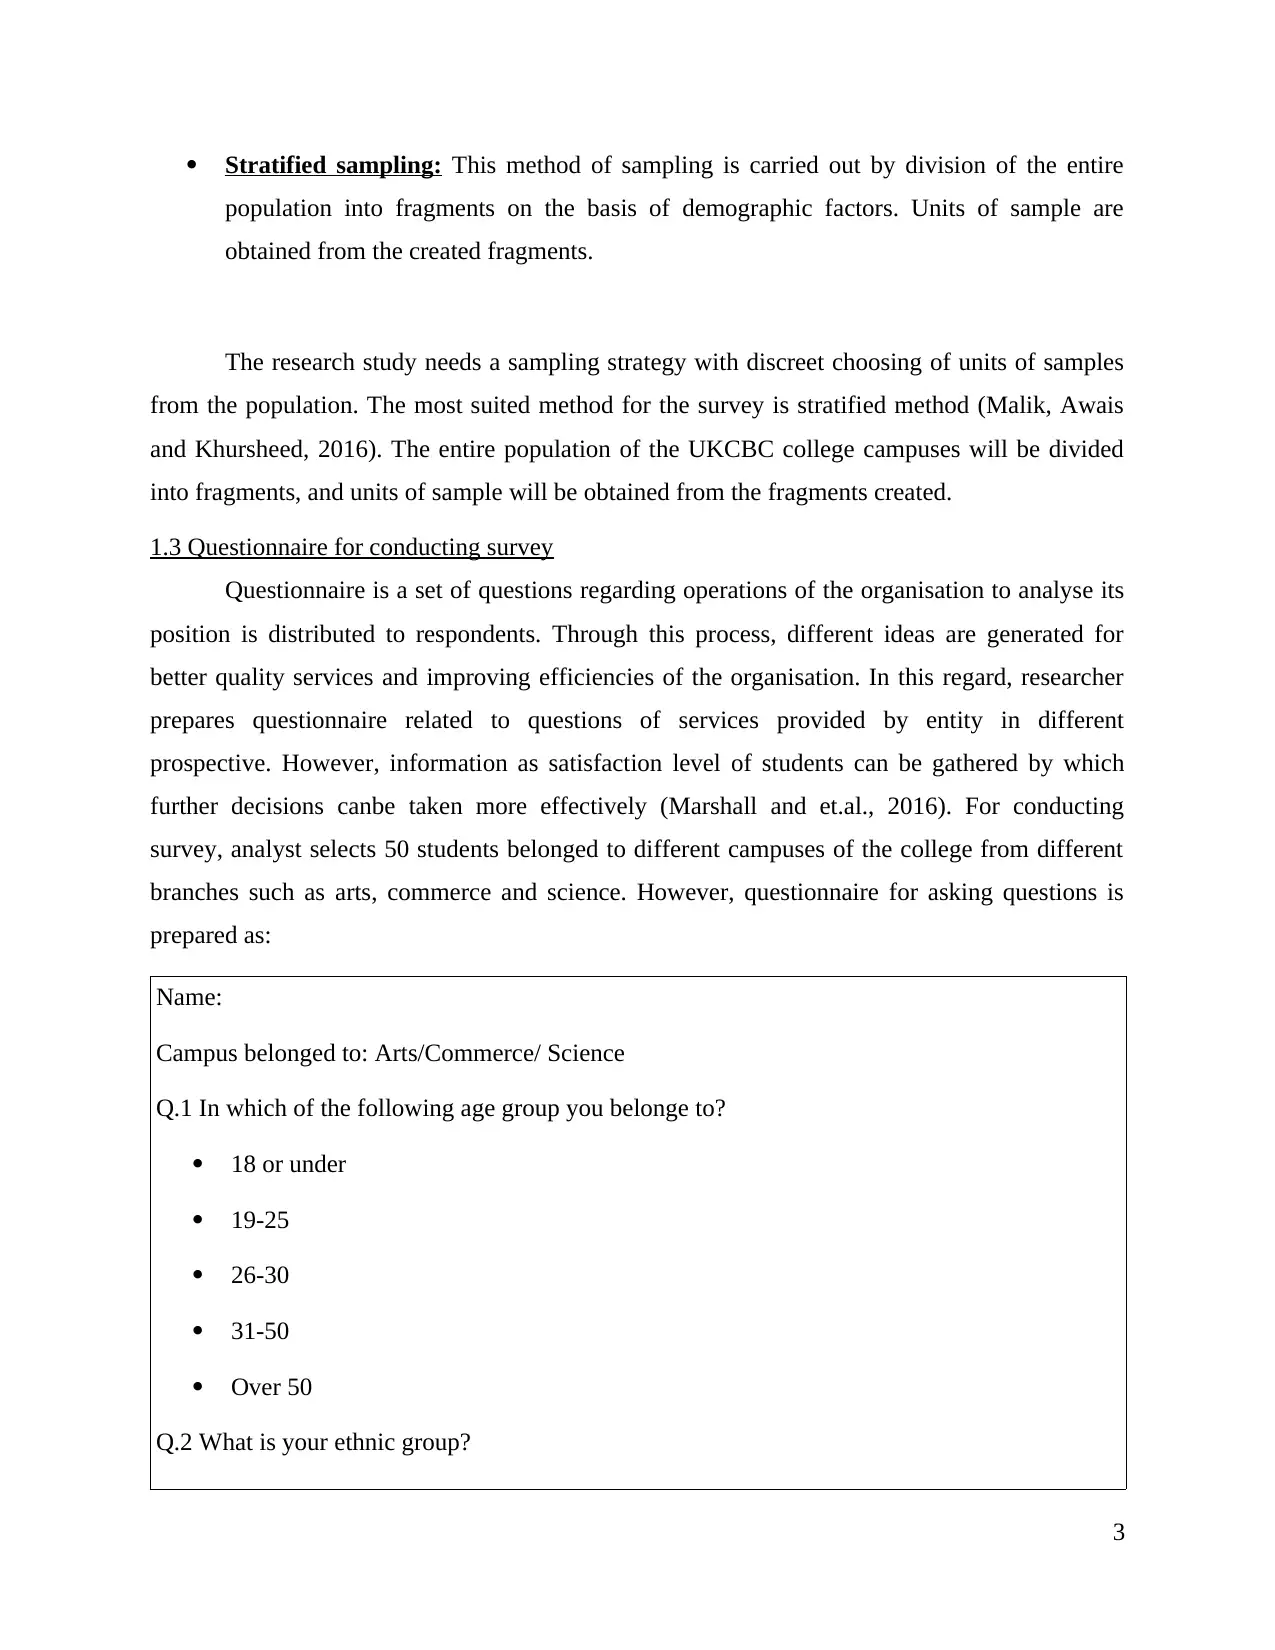
Stratified sampling: This method of sampling is carried out by division of the entire
population into fragments on the basis of demographic factors. Units of sample are
obtained from the created fragments.
The research study needs a sampling strategy with discreet choosing of units of samples
from the population. The most suited method for the survey is stratified method (Malik, Awais
and Khursheed, 2016). The entire population of the UKCBC college campuses will be divided
into fragments, and units of sample will be obtained from the fragments created.
1.3 Questionnaire for conducting survey
Questionnaire is a set of questions regarding operations of the organisation to analyse its
position is distributed to respondents. Through this process, different ideas are generated for
better quality services and improving efficiencies of the organisation. In this regard, researcher
prepares questionnaire related to questions of services provided by entity in different
prospective. However, information as satisfaction level of students can be gathered by which
further decisions canbe taken more effectively (Marshall and et.al., 2016). For conducting
survey, analyst selects 50 students belonged to different campuses of the college from different
branches such as arts, commerce and science. However, questionnaire for asking questions is
prepared as:
Name:
Campus belonged to: Arts/Commerce/ Science
Q.1 In which of the following age group you belonge to?
18 or under
19-25
26-30
31-50
Over 50
Q.2 What is your ethnic group?
3
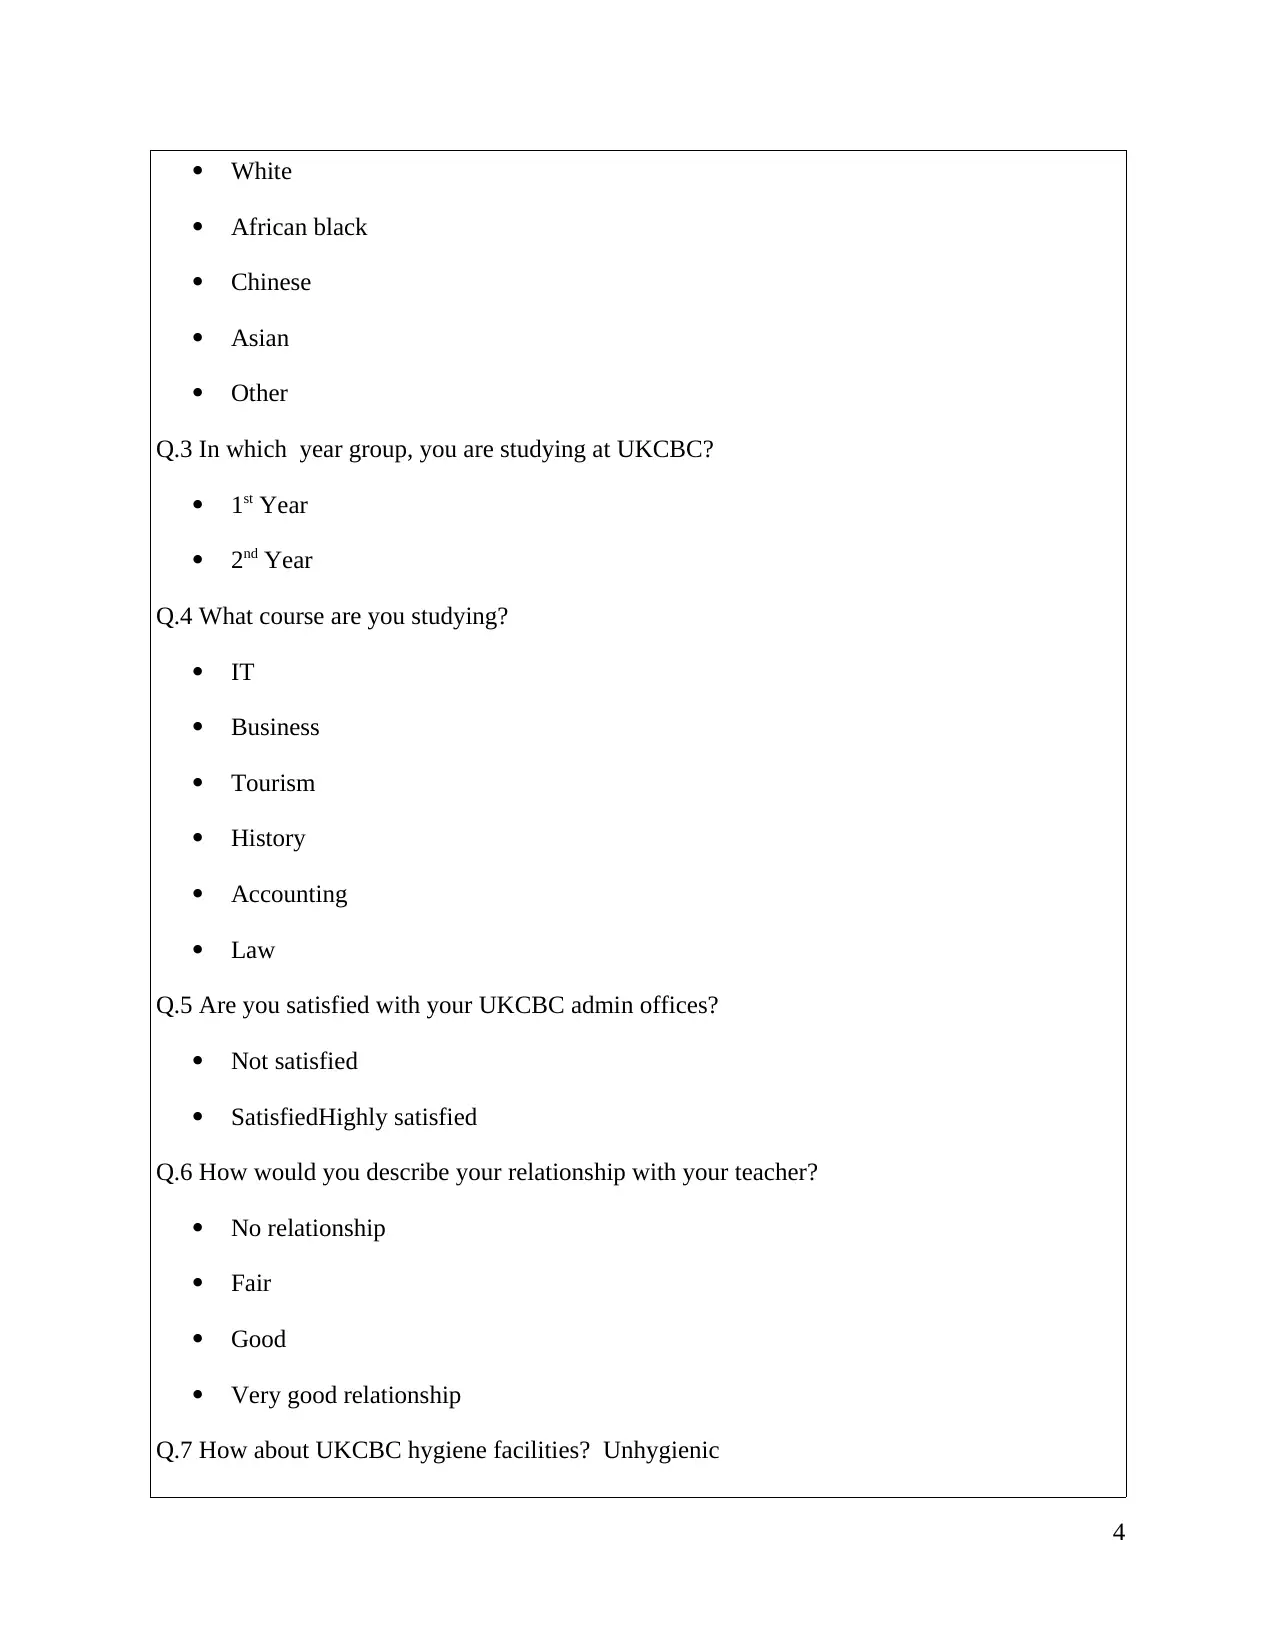
White
African black
Chinese
Asian
Other
Q.3 In which year group, you are studying at UKCBC?
1st Year
2nd Year
Q.4 What course are you studying?
IT
Business
Tourism
History
Accounting
Law
Q.5 Are you satisfied with your UKCBC admin offices?
Not satisfied
SatisfiedHighly satisfied
Q.6 How would you describe your relationship with your teacher?
No relationship
Fair
Good
Very good relationship
Q.7 How about UKCBC hygiene facilities? Unhygienic
4
⊘ This is a preview!⊘
Do you want full access?
Subscribe today to unlock all pages.
Trusted by 1+ million students worldwide
Fair
Good
Very hygienic
Q.8 Why have you chosen UKCBC?
Close to my house
Good ranking
They offer the course I like to study
They have good facilities in place
Recommended by someone else
Random
Q.9 How likely you would recommend UKCBC to others?
Not likely
Likely
Very likely
Q.10 How cooperative the customer service/receptions are?
Non CooperativeModerately cooperative
Highly cooperative
Q.11 How far do you have to travel to UKCBC?
Very far
Far
Close
Q.12 Do you have social events planned by UKCBC as student group?
No
Sometimes
5
Paraphrase This Document
Need a fresh take? Get an instant paraphrase of this document with our AI Paraphraser
Very often
Any suggestion of improving facilities of UKCBC................
TASK 2
2.1 Summarisation of collected data from survey
Collected data is evaluated by using statistical tools as mean, median and mode.
However, overall data is determined on average basis for decision making regarding further
activities (Moonen and et.al., 2013). These tools can be summarised as below:
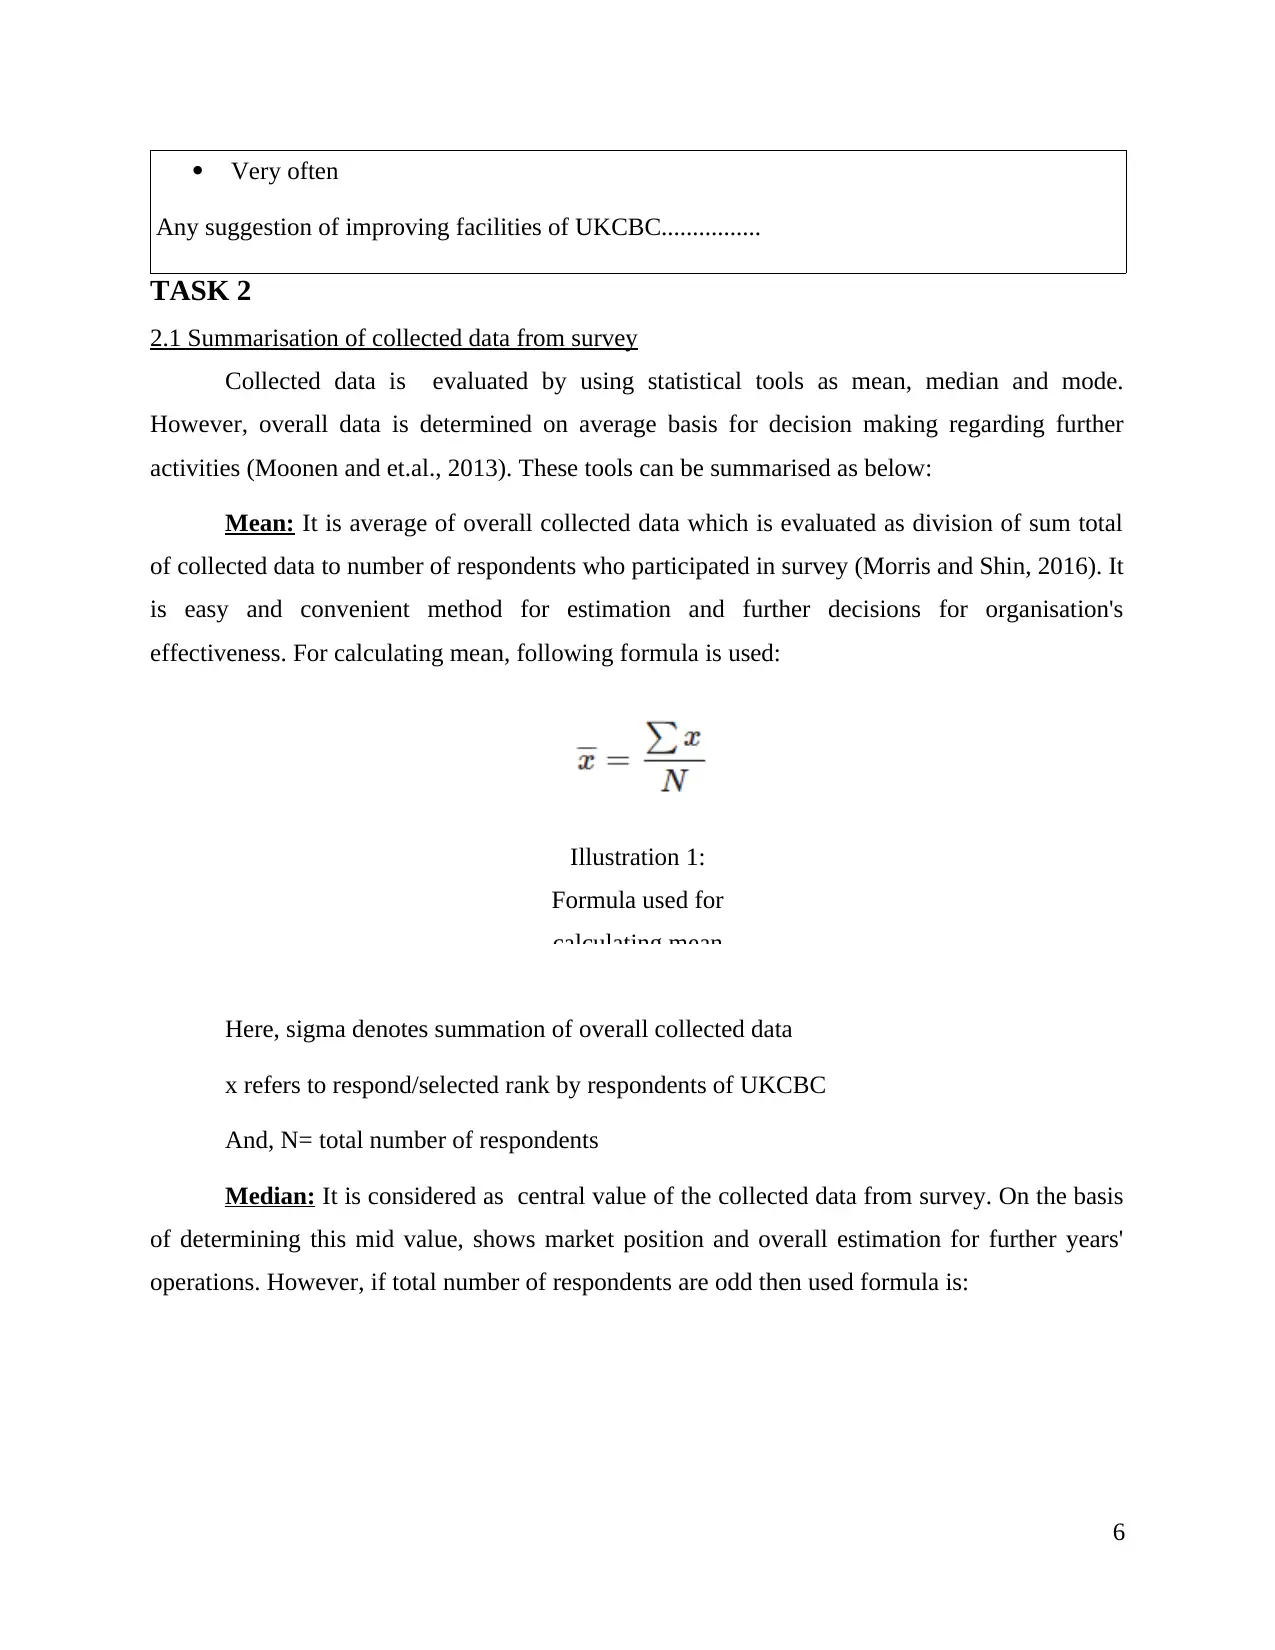
Mean: It is average of overall collected data which is evaluated as division of sum total
of collected data to number of respondents who participated in survey (Morris and Shin, 2016). It
is easy and convenient method for estimation and further decisions for organisation's
effectiveness. For calculating mean, following formula is used:
Here, sigma denotes summation of overall collected data
x refers to respond/selected rank by respondents of UKCBC
And, N= total number of respondents
Median: It is considered as central value of the collected data from survey. On the basis
of determining this mid value, shows market position and overall estimation for further years'
operations. However, if total number of respondents are odd then used formula is:
6
Illustration 1:
Formula used for
calculating mean
Any suggestion of improving facilities of UKCBC................
TASK 2
2.1 Summarisation of collected data from survey
Collected data is evaluated by using statistical tools as mean, median and mode.
However, overall data is determined on average basis for decision making regarding further
activities (Moonen and et.al., 2013). These tools can be summarised as below:
Mean: It is average of overall collected data which is evaluated as division of sum total
of collected data to number of respondents who participated in survey (Morris and Shin, 2016). It
is easy and convenient method for estimation and further decisions for organisation's
effectiveness. For calculating mean, following formula is used:
Here, sigma denotes summation of overall collected data
x refers to respond/selected rank by respondents of UKCBC
And, N= total number of respondents
Median: It is considered as central value of the collected data from survey. On the basis
of determining this mid value, shows market position and overall estimation for further years'
operations. However, if total number of respondents are odd then used formula is:
6
Illustration 1:
Formula used for
calculating mean
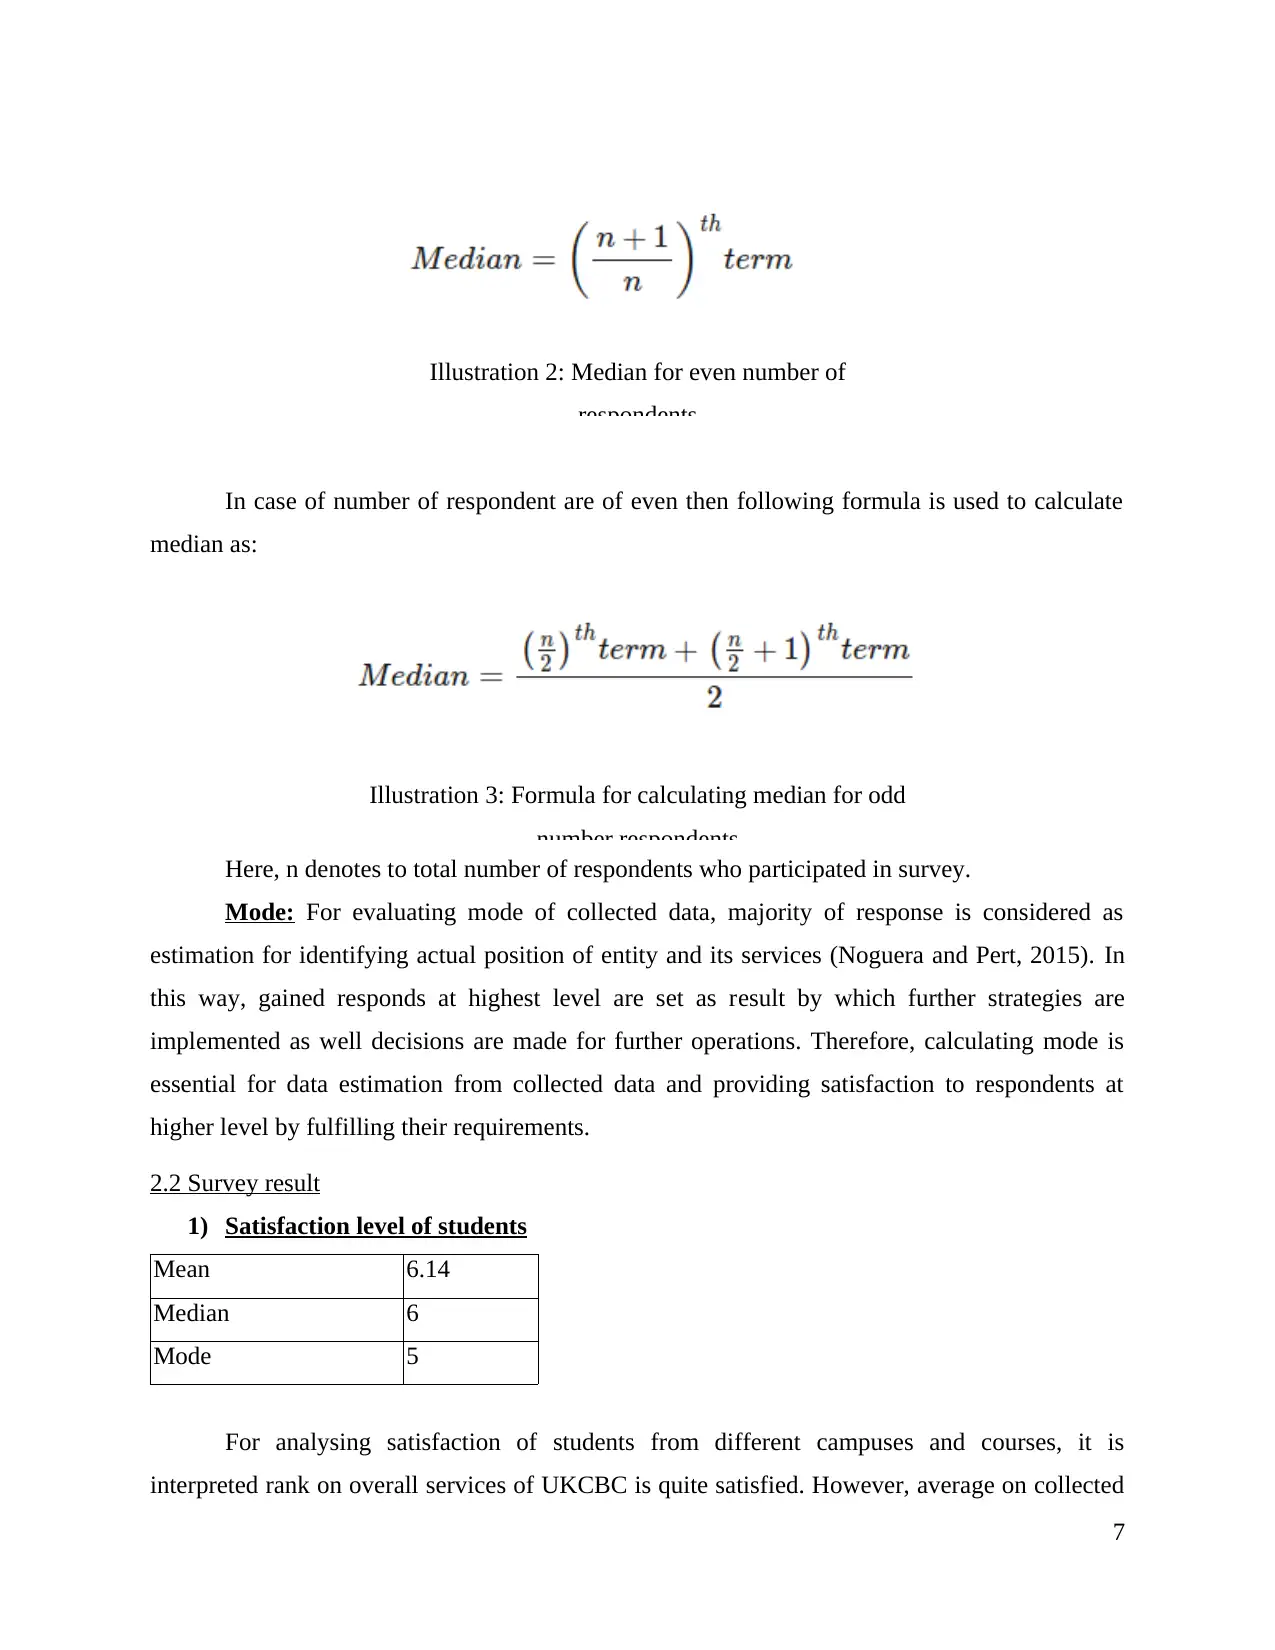
In case of number of respondent are of even then following formula is used to calculate
median as:
Here, n denotes to total number of respondents who participated in survey.
Mode: For evaluating mode of collected data, majority of response is considered as
estimation for identifying actual position of entity and its services (Noguera and Pert, 2015). In
this way, gained responds at highest level are set as result by which further strategies are
implemented as well decisions are made for further operations. Therefore, calculating mode is
essential for data estimation from collected data and providing satisfaction to respondents at
higher level by fulfilling their requirements.
2.2 Survey result
1) Satisfaction level of students
Mean 6.14
Median 6
Mode 5
For analysing satisfaction of students from different campuses and courses, it is
interpreted rank on overall services of UKCBC is quite satisfied. However, average on collected
7
Illustration 2: Median for even number of
respondents
Illustration 3: Formula for calculating median for odd
number respondents
⊘ This is a preview!⊘
Do you want full access?
Subscribe today to unlock all pages.
Trusted by 1+ million students worldwide
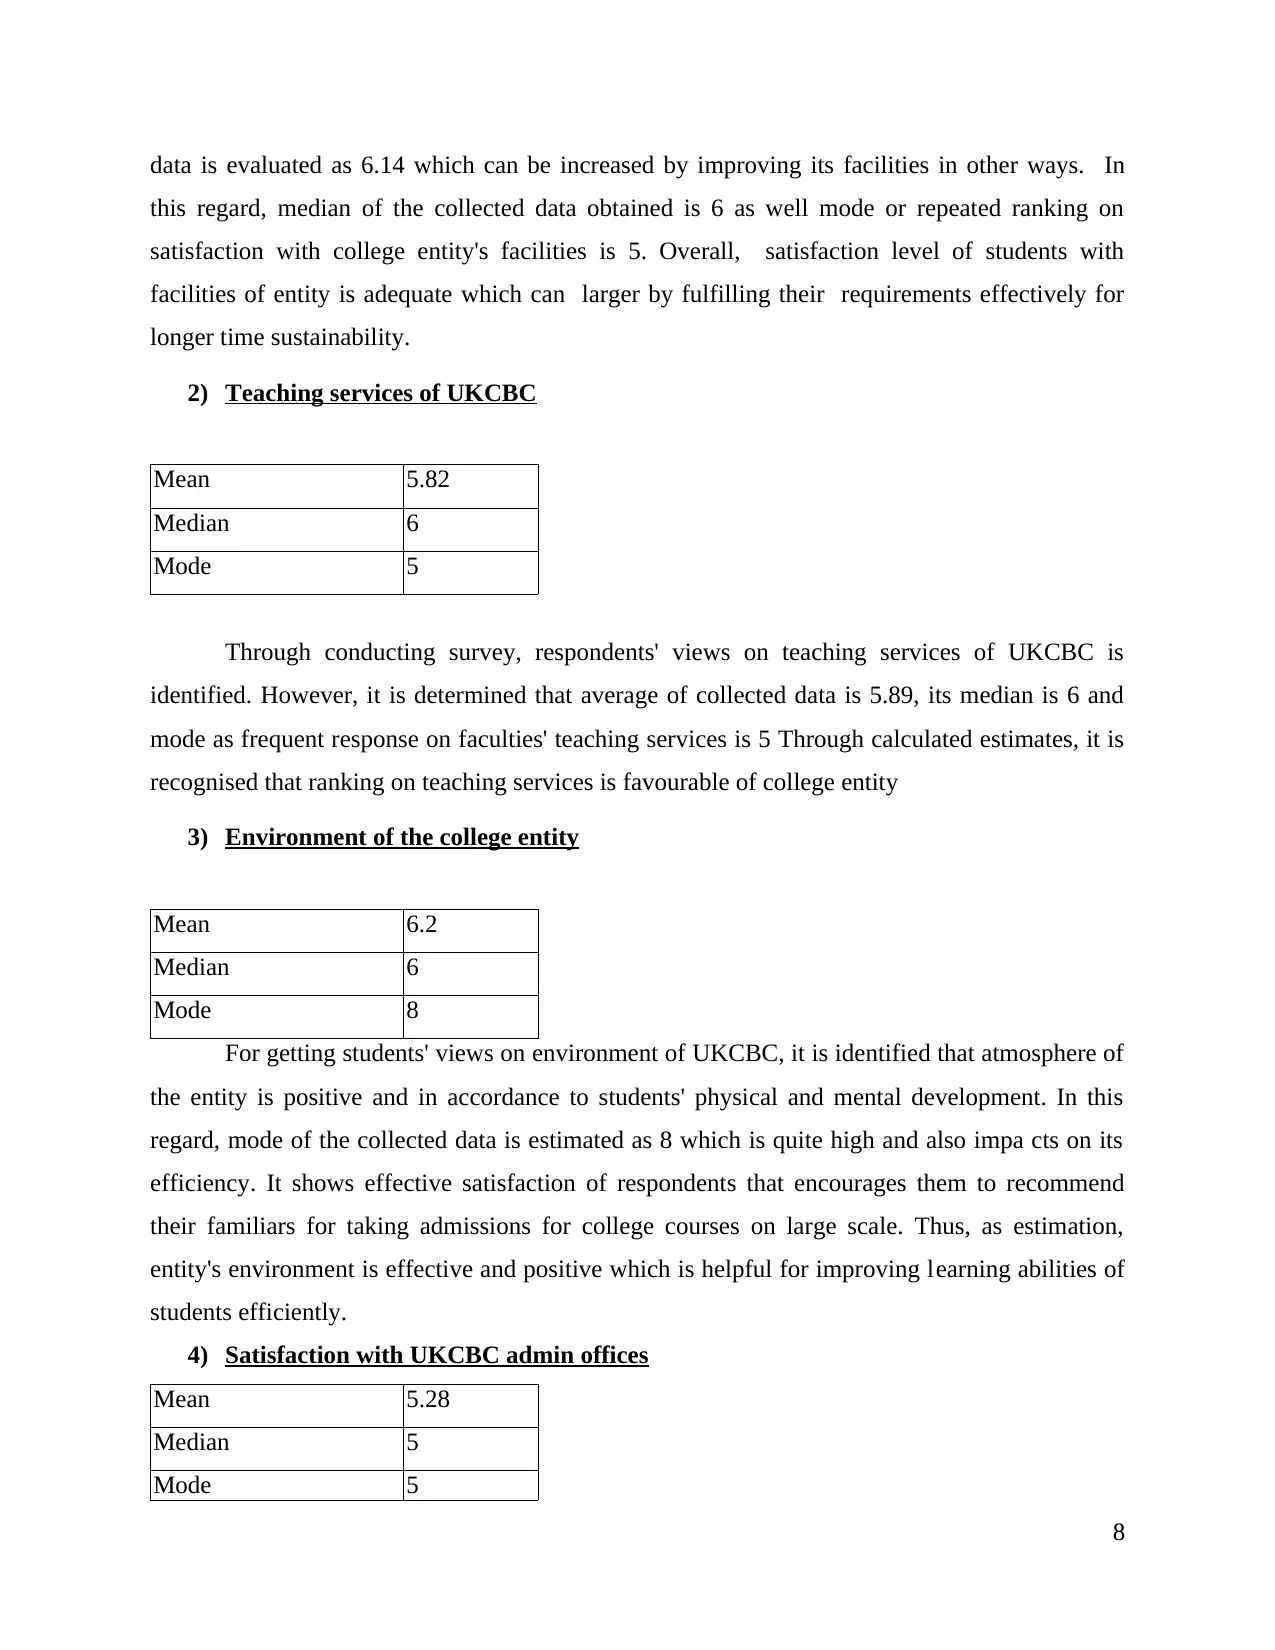
data is evaluated as 6.14 which can be increased by improving its facilities in other ways. In
this regard, median of the collected data obtained is 6 as well mode or repeated ranking on
satisfaction with college entity's facilities is 5. Overall, satisfaction level of students with
facilities of entity is adequate which can larger by fulfilling their requirements effectively for
longer time sustainability.
2) Teaching services of UKCBC
Mean 5.82
Median 6
Mode 5
Through conducting survey, respondents' views on teaching services of UKCBC is
identified. However, it is determined that average of collected data is 5.89, its median is 6 and
mode as frequent response on faculties' teaching services is 5 Through calculated estimates, it is
recognised that ranking on teaching services is favourable of college entity
3) Environment of the college entity
Mean 6.2
Median 6
Mode 8
For getting students' views on environment of UKCBC, it is identified that atmosphere of
the entity is positive and in accordance to students' physical and mental development. In this
regard, mode of the collected data is estimated as 8 which is quite high and also impa cts on its
efficiency. It shows effective satisfaction of respondents that encourages them to recommend
their familiars for taking admissions for college courses on large scale. Thus, as estimation,
entity's environment is effective and positive which is helpful for improving learning abilities of
students efficiently.
4) Satisfaction with UKCBC admin offices
Mean 5.28
Median 5
Mode 5
8
Paraphrase This Document
Need a fresh take? Get an instant paraphrase of this document with our AI Paraphraser
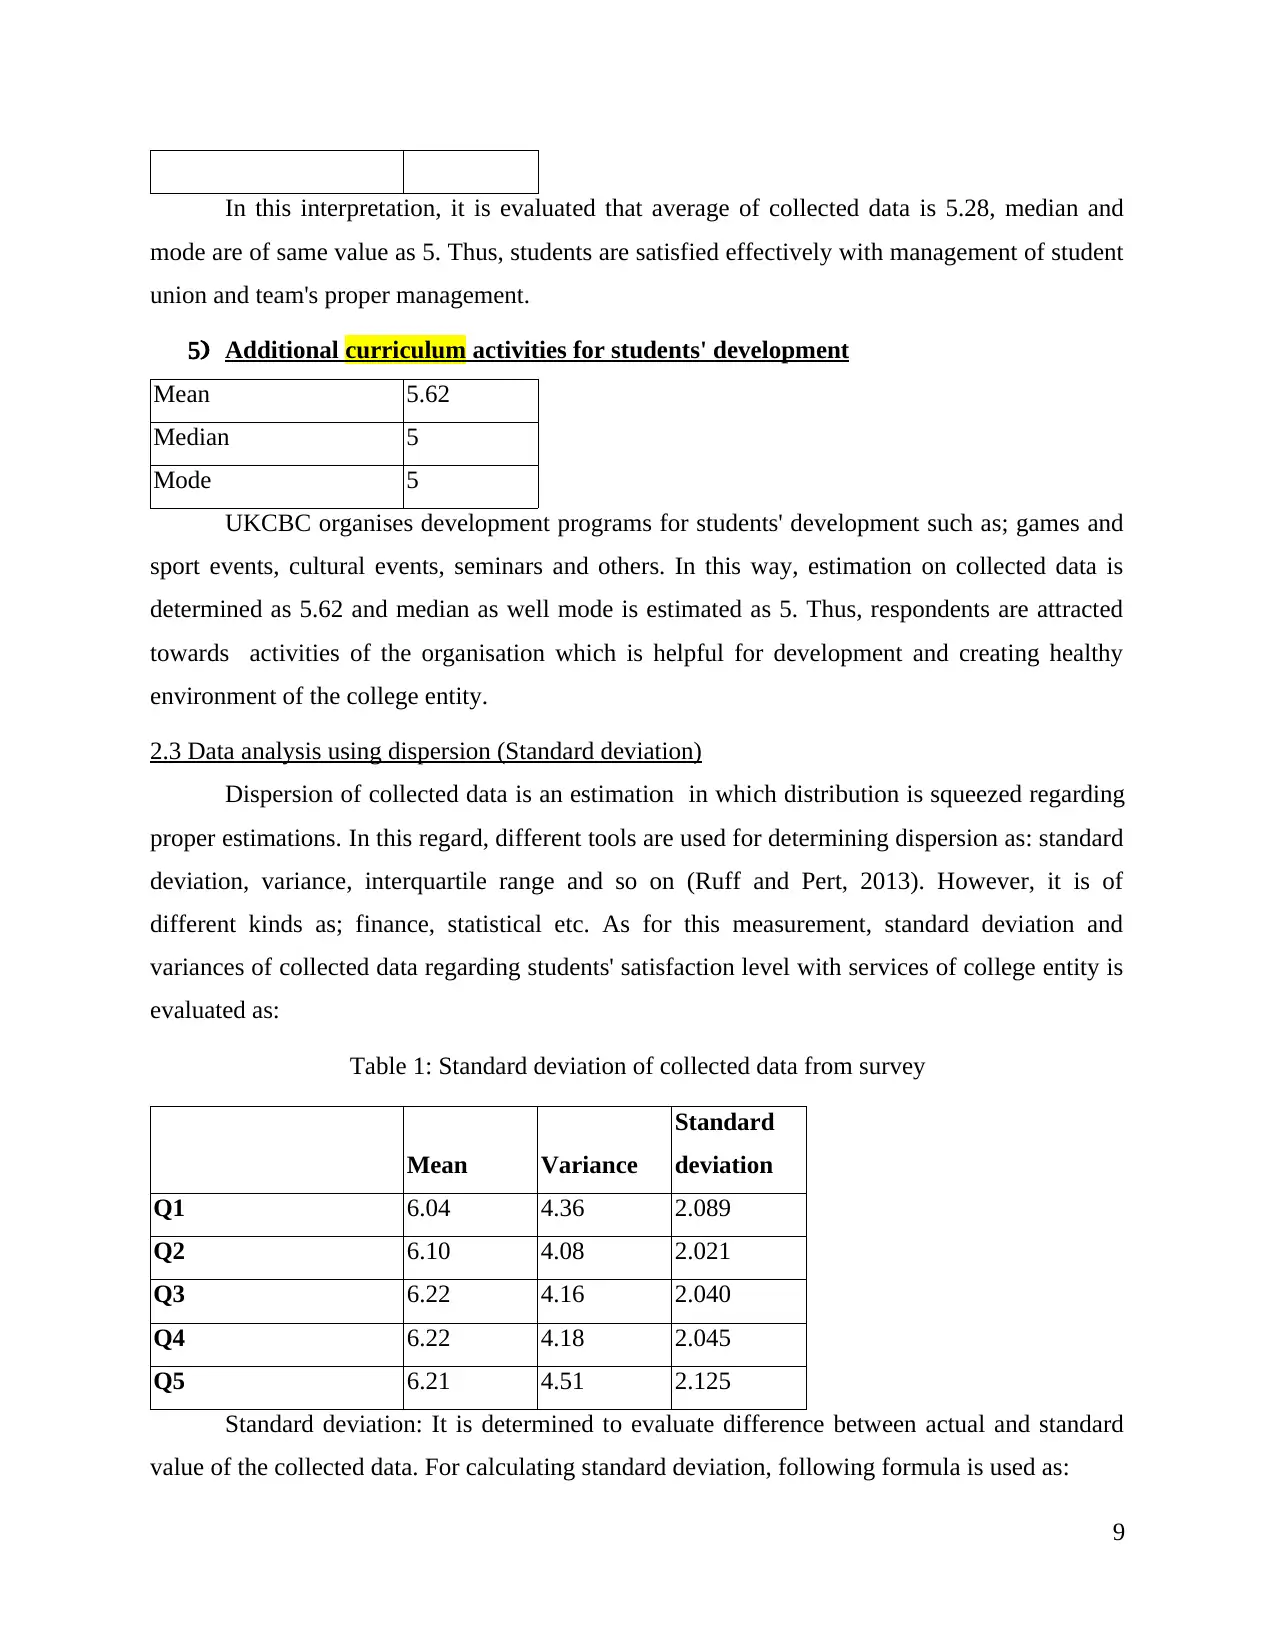
In this interpretation, it is evaluated that average of collected data is 5.28, median and
mode are of same value as 5. Thus, students are satisfied effectively with management of student
union and team's proper management.
5) Additional curriculum activities for students' development
Mean 5.62
Median 5
Mode 5
UKCBC organises development programs for students' development such as; games and
sport events, cultural events, seminars and others. In this way, estimation on collected data is
determined as 5.62 and median as well mode is estimated as 5. Thus, respondents are attracted
towards activities of the organisation which is helpful for development and creating healthy
environment of the college entity.
2.3 Data analysis using dispersion (Standard deviation)
Dispersion of collected data is an estimation in which distribution is squeezed regarding
proper estimations. In this regard, different tools are used for determining dispersion as: standard
deviation, variance, interquartile range and so on (Ruff and Pert, 2013). However, it is of
different kinds as; finance, statistical etc. As for this measurement, standard deviation and
variances of collected data regarding students' satisfaction level with services of college entity is
evaluated as:
Table 1: Standard deviation of collected data from survey
Mean Variance
Standard
deviation
Q1 6.04 4.36 2.089
Q2 6.10 4.08 2.021
Q3 6.22 4.16 2.040
Q4 6.22 4.18 2.045
Q5 6.21 4.51 2.125
Standard deviation: It is determined to evaluate difference between actual and standard
value of the collected data. For calculating standard deviation, following formula is used as:
9
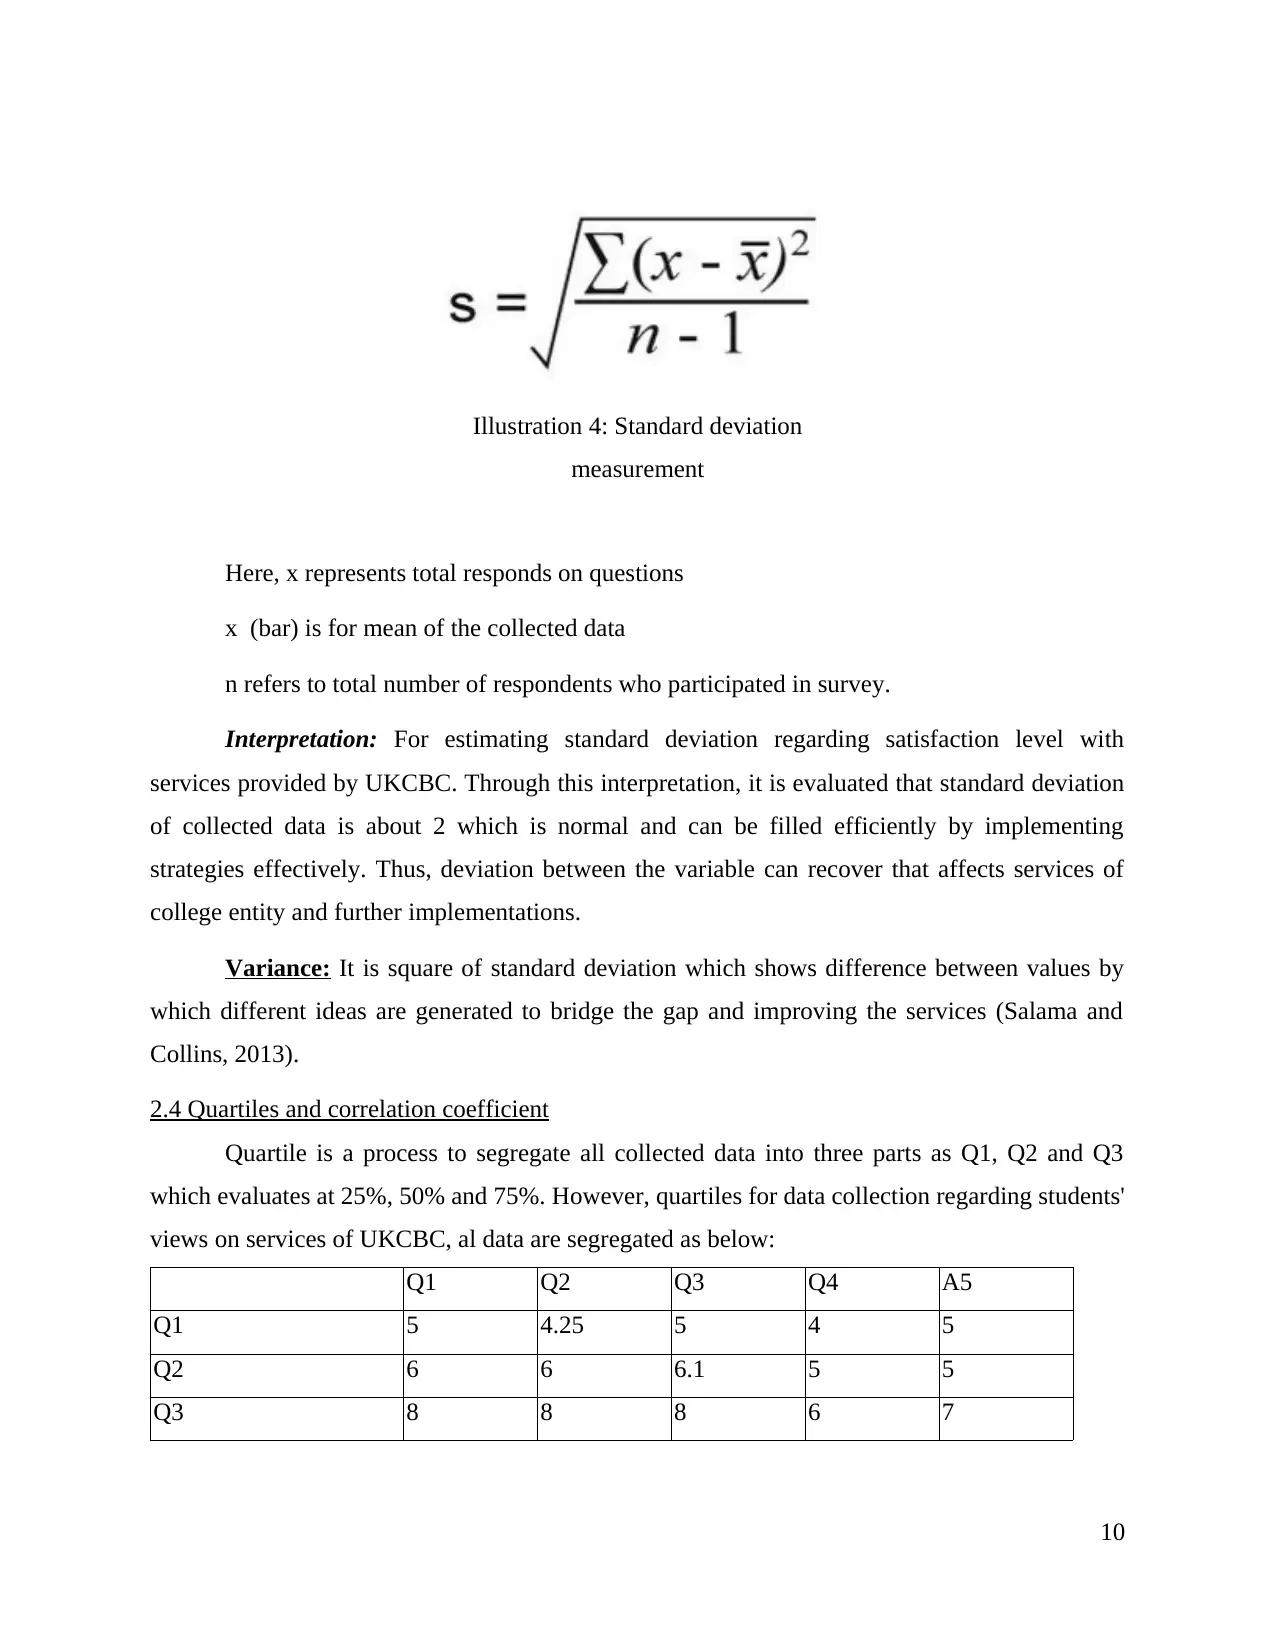
Here, x represents total responds on questions
x (bar) is for mean of the collected data
n refers to total number of respondents who participated in survey.
Interpretation: For estimating standard deviation regarding satisfaction level with
services provided by UKCBC. Through this interpretation, it is evaluated that standard deviation
of collected data is about 2 which is normal and can be filled efficiently by implementing
strategies effectively. Thus, deviation between the variable can recover that affects services of
college entity and further implementations.
Variance: It is square of standard deviation which shows difference between values by
which different ideas are generated to bridge the gap and improving the services (Salama and
Collins, 2013).
2.4 Quartiles and correlation coefficient
Quartile is a process to segregate all collected data into three parts as Q1, Q2 and Q3
which evaluates at 25%, 50% and 75%. However, quartiles for data collection regarding students'
views on services of UKCBC, al data are segregated as below:
Q1 Q2 Q3 Q4 A5
Q1 5 4.25 5 4 5
Q2 6 6 6.1 5 5
Q3 8 8 8 6 7
10
Illustration 4: Standard deviation
measurement
⊘ This is a preview!⊘
Do you want full access?
Subscribe today to unlock all pages.
Trusted by 1+ million students worldwide
1 out of 28
Related Documents


Your All-in-One AI-Powered Toolkit for Academic Success.
+13062052269
info@desklib.com
Available 24*7 on WhatsApp / Email
![[object Object]](/_next/static/media/star-bottom.7253800d.svg)
Unlock your academic potential
Copyright © 2020–2026 A2Z Services. All Rights Reserved. Developed and managed by ZUCOL.